Archives: Quiz
GSM 684
Which of the following is an internal mechanism that seeks to ensure ethical corporate governance? a. European Union 8th Directive b. The Sarbanes-Oxley Act c. The COSO framework d. European Union 7th directive According to the tradition of theoretical reason, […]
MSC 211 Test 2
Principle-based ethics direct us to consider the moral character of individuals and how various character traits can contribute to, or obstruct a happy and meaningful human life. The ‘feasibility’ approach to standards allows OSHA to make tradeoffs between health and […]
MSC 586 Test 2
The first three class marks for a frequency distribution of “weights of college men” recorded to the nearest pound are 105, 115, and 125. What is the lower limit for the third class? A company wants to study the effect […]
Business 167 Test
A _____ chart is useful for displaying a frequency distribution for a nominal variable. The null hypothesis for an ANOVA comparing three population means is ___________________. Answer: Feedback: We let refer to the respective population means. The null hypothesis is […]
MG 391
The Kruskal-Wallis method tests the hypothesis that ____________ or more population means are equal. What is the difference between chi-square nonparametric tests and nonparametric tests based on ranks? Answer: Chi-square tests are appropriate for nominal and ordinal data that can […]
BUS 381
A total of _______ different samples of size 3 can be collected from a population of 10 items. The Nile Superstore is conducting a survey of consumer preferences for a new wireless e-book reader. A sample of 160 people reveals […]
Business 172
The “in control” region of a control chart is called the ____________________. A person is trying to decide if they should buy a lottery ticket. The ticket costs $1.00. If the ticket is a winner, the prize would be $10,000. […]
BUS 102 Midterm 2
The Poisson distribution or, the law of improbable events, is _______________ skewed. The Canal Corporation recorded the last five annual percent changes in profit. What is the mean annual percentage change over the last five years? Answer: 7.89% A new […]
MSC 376
Suppose your annual 2001 salary was $40,000 and your 2006 salary was $52,000. Assume the annual CPI rose from 177.1 to 202.9 during this period of time. What was the purchasing power of the dollar in 2001? When the special […]
MSC 473
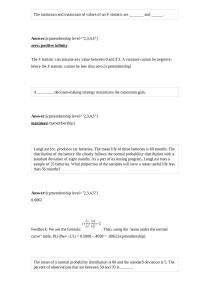
The shape of the uniform distribution is ___________. The waiting time for patients at a local walk-in health clinic follows a normal distribution with a mean of 15 minutes and a population standard deviation of 5 minutes. The quality-assurance department […]
GP 709 Test 1
A study conducted by a local tennis center revealed that 25 percent of its new members have novice level tennis skills. A membership drive in a metropolitan area resulted in 500 new members. What is the probability that 110 or […]
MOB 761 Quiz 2
A survey of property owners’ opinions about a street-widening project was taken to determine if owners’ opinions were related to the distance between their home and the street. A randomly selected sample of 100 property owners was contacted and the […]
MG 385 Test
A company’s human resources department was interested in the average number of years that a person works before retiring. The sample of size 11 follows: What is the mode? A company wants to study the effect of an employee’s length […]
GP 589
Approximately 25% of tourists going to Atlantic City to gamble spend more than $500. The Atlantic City Chamber of Commerce wants to update this percentage. For the new study, the estimate should be within 1% of the population proportion, with […]
MOB 357
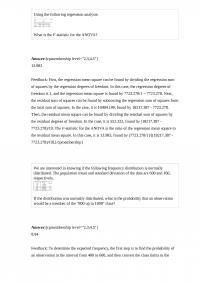
Using the following regression analysis: What is the F-statistic for the ANOVA? We are interested in knowing if the following frequency distribution is normally distributed. The population mean and standard deviation of the data are 600 and 160, respectively. If […]
BUS 468 Test You have a decision to
You have a decision to invest $10,000 in any of four different companies. You estimate the probabilities that the economy will be favorable or unfavorable, and you estimate the percent returns over the next year. What is the maximax choice? […]
GSM 128 Quiz 2
A Pareto chart is designed to show the ____________ in which different types of defects occur in a process. A multiple regression analysis showed the following results of the individual independent variables. X4 is a qualitative variable. If X4 is […]
GSM 255
To verify that an observed frequency distribution is normally distributed, a ________ statistic is used to test the hypothesis that the sample data is normally distributed. The test statistic used to compare two variances is the ___________ statistic. Answer: F-statistic […]
BUS 133 Test
Two movie reviewers gave their ratings (0 to 4 stars) to ten movies released this past month as follows: The rank order correlation is to be used. What is the value of the sum of the differences? A company set […]
BUS 225
High school students were interested in a teacher’s claim that the longer the length of time (hours) that a student studies for a test, the higher the test score. The students collected the data and the teacher did the regression […]
GP 448
You have four different strategic business plans you can select to implement against your competitors. You estimate that the probability that the competitors are aware of your strategies is 0.3, and 0.7 that they are unaware. The payoffs estimated for […]
MOB 346 Quiz 3
Suppose you toss a coin four times and get heads four times (no tails). The probability that heads will appear on the next toss of the coin is ____. If the coefficient of determination is 0.81, the coefficient of correlation […]
GSM 337 Test 1
A useful method for eliminating fluctuations in a time series is computing a ______. From past history, the scores on a statistics test are normally distributed with a mean score of 70 and a standard deviation of 5. To earn […]
BUS 435 Midterm 1
An airline is investigating the causes of lost bags. The following table of data was collected over the last six months. What is the reason with the highest percentage of bags is lost, and what is the percentage? The F […]
MG 483 Quiz 1
What chart or graph uses several rows of data to show a frequency distribution? High school students were interested in a teacher’s claim that the longer the length of time (hours) that a student studies for a test, the higher […]
GSM 712 Midterm
When observing a checkout line at a food store, the average number of people served is 30 per hour. Using the Poisson distribution, what is the standard deviation of the number of people served in an hour? One of the […]
MOB 282 Final
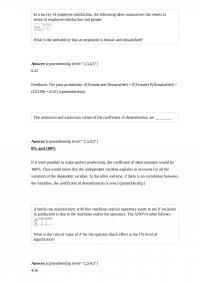
If the binomial distribution is used to develop an operating characteristic curve for an acceptance sampling plan, then the trials must be ________________. A bottle cap manufacturer with four machines and six operators wants to see if variation in production […]
Business 323 Test
The interquartile range is the distance between ___________. To compute a confidence interval for a population proportion, a __________ statistic is used. Answer: z We use the z statistic or the standard normal distribution to create a confidence interval for […]
MSC 538
An assumption of linear regression states that for each value of X, there is a group of Y values that are statistically __________________ and normally distributed about the regression line. A soap manufacturer is experimenting with several formulas of soap […]
GSM 869 Midterm 1
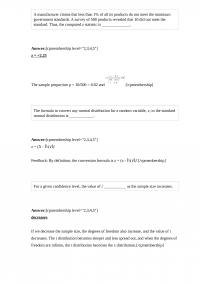
A manufacturer claims that less than 1% of all its products do not meet the minimum government standards. A survey of 500 products revealed that 10 did not meet the standard. Thus, the computed z statistic is ______________. The formula […]
MSC 470
A continuous random variable can assume one of a(n) ____________ number of values within a specific range. Draw a negatively or positively skewed distribution and show the relative locations of the mean, median, and mode. Answer: See the text for […]
GP 426 Quiz 1
One card will be randomly selected from a standard 52-card deck. The probability that it will be the jack of hearts is ____. The measurement of color is a(n) _____________. Answer: attribute A person is trying to decide if they […]
MG 330 Quiz 2
When reporting descriptive statistics for a variable, why should the report include measures of location and dispersion? Most indexes have a _____________ and a ______________ in common. Answer: base period; current period A probability is calculated by dividing the number […]
BUS 583
Assuming that the larger of two variances is in the numerator of an F-statistic, the rejection region to test a null hypothesis is in the _________ tail of the F distribution. A _________ sign test should be applied, if H0: […]
GSM 269 Test 2
We are interested in knowing if the following frequency distribution is normally distributed. The population mean and standard deviation of the data are 600 and 160, respectively. If the distribution was normally distributed, what is the probability that an observation […]
MG 741
Two movie reviewers gave their ratings (0 to 4 stars) to seven movies released this past month as follows: The Wilcoxon signed-rank test of differences is used. What is the null hypothesis? A New York newspaper reported the average gasoline […]
MG 695 Test 2
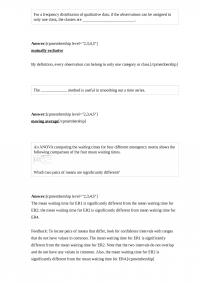
For a frequency distribution of qualitative data, if the observations can be assigned to only one class, the classes are __________________________. The _____________ method is useful in smoothing out a time series. Answer: moving average An ANOVA comparing the waiting […]
Business 179
In a survey of employee satisfaction, the following table summarizes the results in terms of employee satisfaction and gender. What is the probability that an employee is female and dissatisfied? The minimum and maximum values of the coefficient of determination […]
Business 263 Midterm
The minimum and maximum of values of an F statistic are _______ and ______. A ________ decision-making strategy maximizes the maximum gain. Answer: maximax LongLast Inc. produces car batteries. The mean life of these batteries is 60 months. The distribution […]
MOB 401
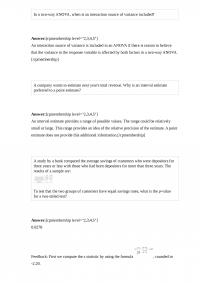
In a two-way ANOVA, when is an interaction source of variance included? A company wants to estimate next year’s total revenue. Why is an interval estimate preferred to a point estimate? Answer: An interval estimate provides a range of possible […]
BUS 211
The first three class marks for a frequency distribution of “weights of college men” recorded to the nearest pound are 105, 115, and 125. What is the upper limit for the third class? The center line of a mean chart […]
MOB 431 Quiz 2
Complete the following analogy: An experiment relates to outcome, as the role of a die relates to _____. A company set up a kiosk in the Mall of America for several hours and asked randomly selected people which color cell […]
MG 679 Midterm
Nonparametric tests require data that can be __________. Define autocorrelation. Answer: Correlation between successive or ordered residuals. An example of autocorrelation occurs when a series of residuals show a decreasing or increasing trend. For the hypergeometric distribution there are ________________ […]
BUS 638 Midterm 1
Two movie reviewers gave their ratings (0 to 4 stars) to seven movies released this past month as follows: The Wilcoxon signed-rank test of difference is to be used. What is your decision at the 5% level of significance? A […]
GSM 605
The proportion of explained variation is called the _______________. Six people have declared their intentions to run for a seat on the school board in the next local election. A poll is conducted during the campaign among 1,020 randomly sampled […]
MG 131 Test 2
In a tree diagram that illustrates the joint probabilities for a probability problem, the sum of all the joint probabilities must equal _______________. Draw a Venn diagram showing the probability for two mutually exclusive events and also draw a Venn […]
GSM 762 Test 1
A fishbone diagram starts with the definition of a problem and explores its possible ________. Sampling from a population may be preferred, because studying all the items in a population may be too ____________. Answer: cost/time consuming Collecting data is […]
Business 496 Final
The ___________ sampling method is best to use if the population can be divided into two or more homogeneous subgroups. When we make an estimate or prediction, we use _______________. Answer: inferential statistics Inferential statistics are the methods used to […]
MG 860 Quiz 1
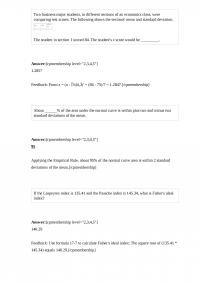
Two business major students, in different sections of an economics class, were comparing test scores. The following shows the sections’ mean and standard deviation. The student in section 1 scored 84. The student’s z score would be _________. About ______% […]
GP 454
When H0: is rejected in ANOVA, we compute ____________ to identify pairs of means that differ. The human resources department of a software company encourages their employees to participate in a wellness program. They sampled 16 employees, 2 males and […]