Archives
Chapter 1 A random sample is a sample drawn in such
Ans: A Difficulty level: low Objective: Explain what constitutes inferential statistics. Ans: C Difficulty level: low Objective: Describe the difference between a population and a sample. Ans: D Difficulty level: low Objective: Describe the difference between a population and a […]
Chapter 10 What is the p-value for this hypothesis test
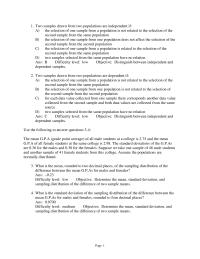
1. Two samples drawn from two populations are independent if: A) the selection of one sample from a population is not related to the selection of the second sample from the same population B) the selection of one sample from […]
Chapter 10 What The Mean The Sampling Distribution The
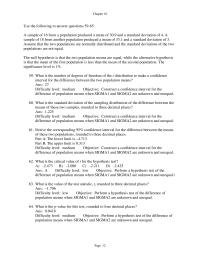
Chapter 10 Use the following to answer questions 59-65: A sample of 16 from a population produced a mean of 30.9 and a standard deviation of 4. A sample of 18 from another population produced a mean of 33.1 and […]
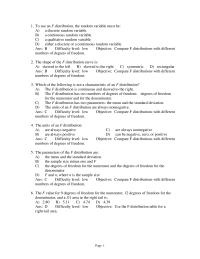
Chapter 11 Which of the following is not a characteristic
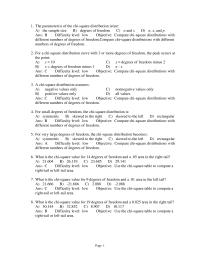
Ans: C Difficulty level: low Objective: Compare chi-square distributions with different numbers of degrees of freedom. Ans: C Difficulty level: low Objective: Compare chi-square distributions with different numbers of degrees of freedom. Ans: B Difficulty level: low Objective: Compare chi-square […]
Chapter 12 The table Shown Below Contains The Weight Loss
Ans: B Difficulty level: low Objective: Compare F distributions with different numbers of degrees of freedom. Ans: C Difficulty level: low Objective: Compare F distributions with different numbers of degrees of freedom. Ans: C Difficulty level: low Objective: Compare F […]
Chapter 13 The coefficient of determination for the regression
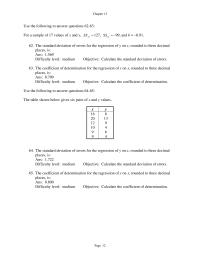
Chapter 13 Use the following to answer questions 62-63: For a sample of 17 values of x and y, yy SS = 127, xy SS = –99, and b = –0.91. 62. The standard deviation of errors for the regression […]
Chapter 13 The Values And Rounded Three Decimal Places
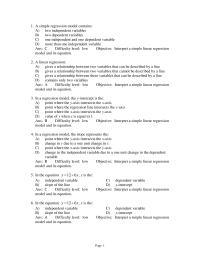
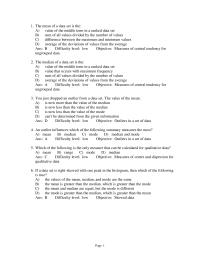
Page 1 1. A simple regression model contains: A) two independent variables B) two dependent variables C) one independent and one dependent variable D) more than one independent variable 2. A linear regression: A) gives a relationship between two variables […]
Chapter 2 The percentage of persons with a Bachelor’s
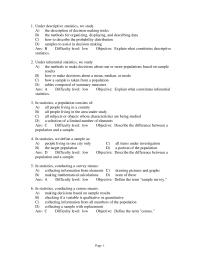
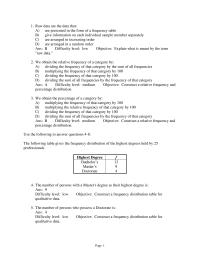
1. Raw data are the data that: A) are presented in the form of a frequency table B) give information on each individual sample member separately C) are arranged in increasing order D) are arranged in a random order Ans: […]
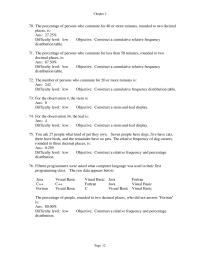
Chapter 2 The percentage of persons who commute for less
Chapter 2 70. The percentage of persons who commute for 40 or more minutes, rounded to two decimal places, is: Ans: 27.25% Difficulty level: low Objective: Construct a cumulative relative frequency distribution table. 71. The percentage of persons who commute […]
Chapter 3 The combined mean score of the 27 male
Ans: A Difficulty level: low Objective: Measures of central tendency for ungrouped data Ans: D Difficulty level: low Objective: Outliers in a set of data Ans: A Difficulty level: low Objective: Outliers in a set of data Ans: C Difficulty […]
Chapter 4 Pioneer The Nile A Want Revenge
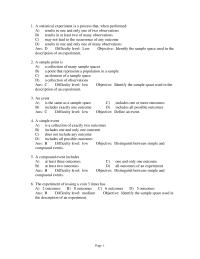
Ans: C Difficulty level: low Objective: Identify the sample space used in the description of an experiment. Ans: C Difficulty level: low Objective: Define an event. Ans: B Difficulty level: low Objective: Distinguish between simple and compound events. Ans: B […]
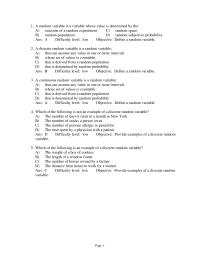
Chapter 5 A random variable is a variable whose value
Ans: B Difficulty level: low Objective: Define a random variable. Ans: A Difficulty level: low Objective: Define a random variable. Ans: D Difficulty level: low Objective: Provide examples of a discrete random variable. Page 1 Ans: C Difficulty level: low […]
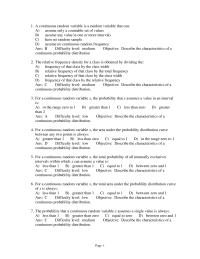
Chapter 6 A continuous random variable is a random
Ans: C Difficulty level: medium Objective: Describe the characteristics of a continuous probability distribution. Ans: A Difficulty level: low Objective: Describe the characteristics of a continuous probability distribution. Ans: D Difficulty level: low Objective: Describe the characteristics of a continuous […]
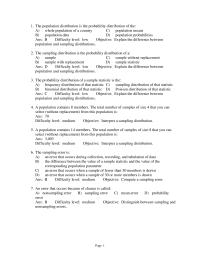
Chapter 7 The population distribution is the probability
Ans: D Difficulty level: low Objective: Explain the difference between population and sampling distributions. Ans: C Difficulty level: low Objective: Explain the difference between population and sampling distributions. Ans: 70 Difficulty level: medium Objective: Interpret a sampling distribution. Ans: 3,003 […]
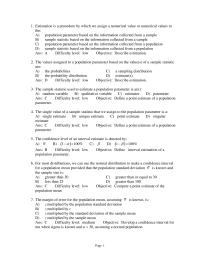
Chapter 8 Estimation is a procedure by which we assign
Ans: D Difficulty level: low Objective: Describe estimation. Ans: C Difficulty level: low Objective: Define a point estimate of a population parameter. Ans: C Difficulty level: low Objective: Define a point estimate of a population parameter. Page 1 Ans: C […]
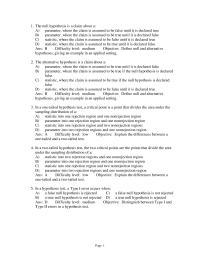
Chapter 9 The null hypothesis is a claim about a
1. The null hypothesis is a claim about a: A) parameter, where the claim is assumed to be false until it is declared true B) parameter, where the claim is assumed to be true until it is declared false C) […]
Chapter 9 Two samples drawn from two populations are
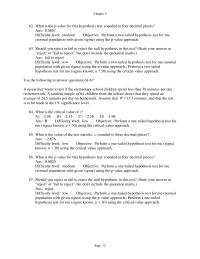
Chapter 9 62. What is the p-value for this hypothesis test, rounded to four decimal places? Ans: 0.0867 Difficulty level: medium Objective: Perform a two-tailed hypothesis test for mu (normal population with given sigma) using the p-value approach. 63. Should […]