1. The mean of a data set is the:
A) value of the middle term in a ranked data set
B) sum of all values divided by the number of values
C) difference between the maximum and minimum values
D) average of the deviations of values from the average
2. The median of a data set is the:
A) value of the middle term in a ranked data set
B) value that occurs with maximum frequency
C) sum of all values divided by the number of values
D) average of the deviations of values from the average
3. You just dropped an outlier from a data set. The value of the mean:
A) is now more than the value of the median
B) is now less than the value of the median
C) is now less than the value of the mode
D) can’t be determined from the given information
4. An outlier influences which of the following summary measures the most?
A) mean B) median C) mode D) median and mode
5. Which of the following is the only measure that can be calculated for qualitative data?
A) mean B) range C) mode D) median
6. If a data set is right-skewed with one peak in the histogram, then which of the following
is true?
A) the values of the mean, median, and mode are the same
B) the mean is greater than the median, which is greater than the mode
C) the mean and median are equal, but the mode is different
D) the mode is greater than the median, which is greater than the mean
Chapter 3
7. If a distribution is symmetric with one peak, then:
A) the values of the mean, median, and mode are identical
B) the mean is greater than the median, which is greater than the mode
C) the values of the mean and median are equal but the mode is different
D) the mode is greater than the median, which is greater than the mean
Use the following to answer questions 8-10:
The annual salaries of six employees of a company are as follows:
$22,000 $35,000 $22,000 $46,000 $57,000 $51,000
8. The mean salary of these employees is:
9. The median salary of these employees is:
10. The mode of the salaries of these employees is:
Use the following to answer questions 11-13:
The points scored by a team in five basketball games are as follows:
118 124 77 99 112
11. The mean for this data set is:
12. The median for this data set is:
13. The mode of this data set is:
A) 47 B) 77 C) 112 D) this data set does not have a unique mode
Chapter 3
14. The mean age of five members of a family is 40 years. The ages of four of the five
members are 61, 60, 27, and 23. The age of the fifth member is:
A) 32 B) 27 C) 29 D) 35
15. The scores of eight students taking a mathematics test are 87, 93, 76, 7, 84, 90, 95, and
93. The best measure of central tendency in this case is the:
A) median B) mean C) box-and whisker D) variance
16. The mean score of 15 male students taking a test is 76 and the mean score of 12 female
students taking the same test is 73. The combined mean score of the 27 male and female
students is
A) 69.15 B) 80.19 C) 74.67 D) 77.43
17. The summary measure obtained by taking the difference between the minimum and
maximum values in a data set is the:
A) median B) standard deviation C) variance D) range
18. Outliers influence which of the following summary measures?
A) standard deviation D) A and B only
B) interquartile range E) A and C only
C) range
19. The value of the standard deviation of a data set is:
A) never zero B) never negative C) never positive D) always positive
20. The quantity
x
−
is called the:
A) standard deviation B) deviation of
x
from the mean C) variance D)
range
Chapter 3
Page 4
21. The measurement units of the standard deviation are always:
A) the same as those of the original data
B) the square of the measurement units of the original data
C) 50% of the measurement units of the original data
D) the square root of the sum of the squares of the original data set
22. The procedure for obtaining the variance from the standard deviation is to:
A) take the square root of the standard deviation
B) square the standard deviation
C) divide the standard deviation by 2
D) multiply the standard deviation by 2
23. A numerical measure calculated from population data is called a(n):
A) parameter B) statistic C) empirical rule D) probability distribution
Use the following to answer questions 24-26:
The annual salaries of six employees of a company are as follows:
$22,000 $35,000 $22,000 $46,000 $57,000 $51,000
24. The range of these salaries is:
25. The variance of these salaries, rounded to the nearest dollar, is:
26. The standard deviation of these salaries, rounded to the nearest dollar, is:
Use the following to answer questions 27-29:
The temperatures (in degrees Fahrenheit) observed during seven days of summer in Los Angeles
are:
78 99 68 91 105 75 85
Chapter 3
Page 5
27. The range of these temperatures is:
28. The variance of these temperatures, rounded to three decimals, is:
29. The standard deviation, rounded to three decimals, of these temperatures is:
Use the following to answer questions 30-32:
The times (in minutes) taken by a sample of nine students to complete a statistics test are:
52 47 57 33 39 43 52 41 36
30. The range of these times is:
31. The variance of these times, rounded to three decimal places, is:
32. The standard deviation of these times, rounded to three decimal places, is:
Use the following to answer questions 33-37:
You have just recorded the waiting times for a random sample of 50 customers who visited
Elmo’s Pizza Shop. The following table gives the frequency distribution of waiting times (in
minutes) for these customers.
Waiting Time
f
10 to less than 16
6
16 to less than 22
10
22 to less than 28
18
28 to less than 34
8
34 to less than 40
7
40 to less than 46
1
Chapter 3
33. The value of
mf
is:
34. The value of
2
mf
is:
35. The mean waiting time, rounded to two decimal places, is:
36. The variance of waiting times, rounded to two decimal places, is:
37. The standard deviation of waiting times, rounded to two decimal places, is:
Use the following to answer questions 38-42:
The following table gives the frequency distribution of prices for a sample of 30 college
textbooks.
Price
f
20 to less than 30
4
30 to less than 40
7
40 to less than 50
13
50 to less than 60
3
60 to less than 70
3
38. The value of
mf
is:
39. The value of
2
mf
is:
40. The mean price of these textbooks, rounded to two decimal places, is:
Chapter 3
41. The variance of the textbook prices, rounded to two decimal places, is:
42. The standard deviation of the textbook prices, rounded to two decimal places, is:
43. According to Chebyshev’s theorem, the minimum percentage of values that fall within 3
standard deviations of the mean is:
A) 86% B) 90% C) 87% D) 89%
44. According to Chebyshev’s theorem, the minimum percentage of values that fall within
1.5 standard deviations of the mean is:
A) 53.56% B) 57.06% C) 55.56% D) 52.56%
45. Chebyshev’s theorem is applicable to:
A) a bell-shaped distribution D) A and B only
B) a skewed distribution E) A, B and C
C) a multimodal distribution
46. The empirical rule is applicable to:
A) a bell-shaped distribution D) A and B only
B) a skewed distribution E) A, B, and C
C) a multimodal distribution
47. According to the empirical rule, the percentage of values that fall within one standard
deviation of the mean is approximately:
A) 63% B) 72% C) 68% D) 59%
48. According to the empirical rule, the percentage of values that fall within two standard
deviations of the mean is approximately:
A) 93% B) 95% C) 94% D) 91%
49. According to the empirical rule, the percentage of values that fall within three standard
deviations of the mean is approximately:
A) 99.4% B) 99.7% C) 97.9% D) 97.3%
Chapter 3
50. According to the empirical rule, the percentage of values that fall outside two standard
deviations of the mean is approximately:
A) 5% B) 9% C) 7% D) 4%
51. The mean age of all high school teachers in New York state is 41 years and the standard
deviation is 6 years. According to Chebyshev’s theorem, the percentage of teachers in
New York who are 23 to 59 years old is at least:
A) 88.89 B) 77.78 C) 84.39 D) 90.89
52. The mean age of all high school teachers in New York state is 50 years and the standard
deviation is 7 years. According to Chebyshev’s theorem, the percentage of teachers in
New York who are 25.5 to 74.5 years old is at least:
A) 91.84 B) 83.67 C) 87.34 D) 93.84
53. The ages of all high school teachers in New York state have a bell-shaped distribution
with a mean of 39 years and a standard deviation of 7 years. According to the empirical
rule, the percentage of teachers in this state who are 32 to 46 years old is approximately:
A) 75% B) 68% C) 95% D) 62%
54. The ages of all high school teachers in New York state have a bell-shaped distribution
with a mean of 45 years and a standard deviation of 7 years. According to the empirical
rule, the percentage of teachers in this state who are 24 to 66 years old is approximately:
A) 99.4% B) 97.9% C) 98.3% D) 99.7%
55. The ages of all high school teachers in New York state have a bell-shaped distribution
with a mean of 43 years and a standard deviation of 6 years. According to the empirical
rule, the percentage of teachers in this state who are 31 to 55 years old is approximately:
A) 97% B) 94% C) 89% D) 95%
56. The mean income of all MBA degree holders working in Los Angeles is $65,000 per year
and the standard deviation of their incomes is $8,000 per year. According to Chebyshev’s
theorem, the percentage of MBA degree holders, working in Los Angeles, with an annual
income of $33,000 to $97,000 is at least:
A) 87.50 B) 95.75 C) 89.25 D) 93.75
Chapter 3
57. The mean income of all MBA degree holders working in Los Angeles is $86,000 per year
and the standard deviation of their incomes is $10,500 per year. According to
Chebyshev’s theorem, the percentage of MBA degree holders, working in Los Angeles,
with an annual income of $49,250 to $122,750 is at least::
A) 91.84 B) 86.39 C) 87.34 D) 93.84
58. The annual incomes of all MBA degree holders working in Los Angeles have a
bell-shaped distribution with a mean of $71,000 and a standard deviation of $8,000.
According to the empirical rule, the percentage of MBA degree holders working in Los
Angeles who have an annual income of $63,000 to $79,000 is approximately:
A) 86% B) 68% C) 64% D) 89%
59. The annual incomes of all MBA degree holders working in Los Angeles have a
bell-shaped distribution with a mean of $72,000 and a standard deviation of $6,000.
According to the empirical rule, the percentage of MBA degree holders working in Los
Angeles who have an annual income of $54,000 to $90,000 is approximately:
A) 97.9% B) 99.4% C) 94.9% D) 99.7%
60. The annual incomes of all MBA degree holders working in Los Angeles have a
bell-shaped distribution with a mean of $78,000 and a standard deviation of $11,000.
According to the empirical rule, the percentage of MBA degree holders working in Los
Angeles who have an annual income of $56,000 to $100,000 is approximately:
A) 75% B) 95% C) 88% D) 97%
61. The quartiles divide a ranked data set into:
A) 2 equal parts B) 4 equal parts C) 100 equal parts D) 10 equal parts
62. The percentiles divide a ranked data set into:
A) 2 equal parts B) 4 equal parts C) 100 equal parts D) 10 equal parts
63. The value of the third quartile for a data set is 65. This means that:
A) 25% of the values in that data set are smaller than 65.
B) 75% of the values in that data set are smaller than 65.
C) 75% of the values in that data set are greater than 65.
D) 50% of the values in that data set are greater than 65.
Chapter 3
Page 10
64. The value of the 65th percentile for a data set is 82. This means that:
A) 35% of the values in that data set are smaller than 82.
B) 65% of the values in that data set are greater than 82.
C) 65% of the values in that data set are smaller than 82.
D) 82% of the values in that data set are greater than 82.
65. The percentile rank of a value in a data set is 43. This means that:
A) 43% of the values in that data set are greater than that value
B) 43% of the values in that data set are greater than 43
C) 57% of the values in that data set are smaller than that value
D) 43% of the values in that data set are smaller than that value
Use the following to answer questions 66-70:
The waiting times (in minutes) for 11 customers at a supermarket are:
14 9 15 4 4 7 9 11 14 2 6
66. The first quartile for these data is:
67. The second quartile for these data is:
68. The third quartile for these data is:
69. The approximate value of the 60th percentile for these data is:
70. The percentile rank for the customer who waited 11 minutes is:
A) 80.00% B) 72.72% C) 68.33% D) 63.64%
Use the following to answer questions 71-75:
The work experiences (in years) of 14 employees of a company are
8 21 11 4 14 17 11 8 8 7 2 11 27 6
Chapter 3
71. The first quartile for these data is:
72. The second quartile for these data is:
73. The third quartile for these data is:
74. The approximate value of the 70th percentile for these data is:
75. The percentile rank for the employee with 17 years of experience is:
A) 62.96% B) 78.57% C) 68.00% D) 85.71%
76. Which of the following does a box-and-whisker plot not show?
A) spread of the data
B) percent of the data within two standard deviations of the mean
C) center of the data set
D) skewness of the data set
Use the following to answer questions 77-78:
Data concerning the time between failures (in hours of operation) for a computer printer have
been recorded, and the first quartile equals 38 hours, the second quartile equals 59 hours, and the
third quartile equals 87 hours.
77. The value for the lower inner fence equals
78. The value for the upper inner fence equals
Chapter 3
Use the following to answer questions 79-90:
The following data represent the ages of 15 people buying lift tickets at a ski area.
15 25 26 17 38 16 74 41 30 24 28 40 20
34 31
79. What is the mean of these data, rounded to two decimal places?
80. What is the median of these data?
81. What is the range of these data?
82. What is the variance of these data, rounded to two decimal places?
83. What is the standard deviation of these data, rounded to two decimal places?
84. What is the value of the first quartile?
85. What is the value of the third quartile?
86. What is the value of the interquartile range?
87. What is the value of the lower inner fence?
Minimum
Q1
Median
Q3
Maximum
Chapter 3
88. What is the value of the upper inner fence?
89. Are there any outliers in this data set? If so, what are they?
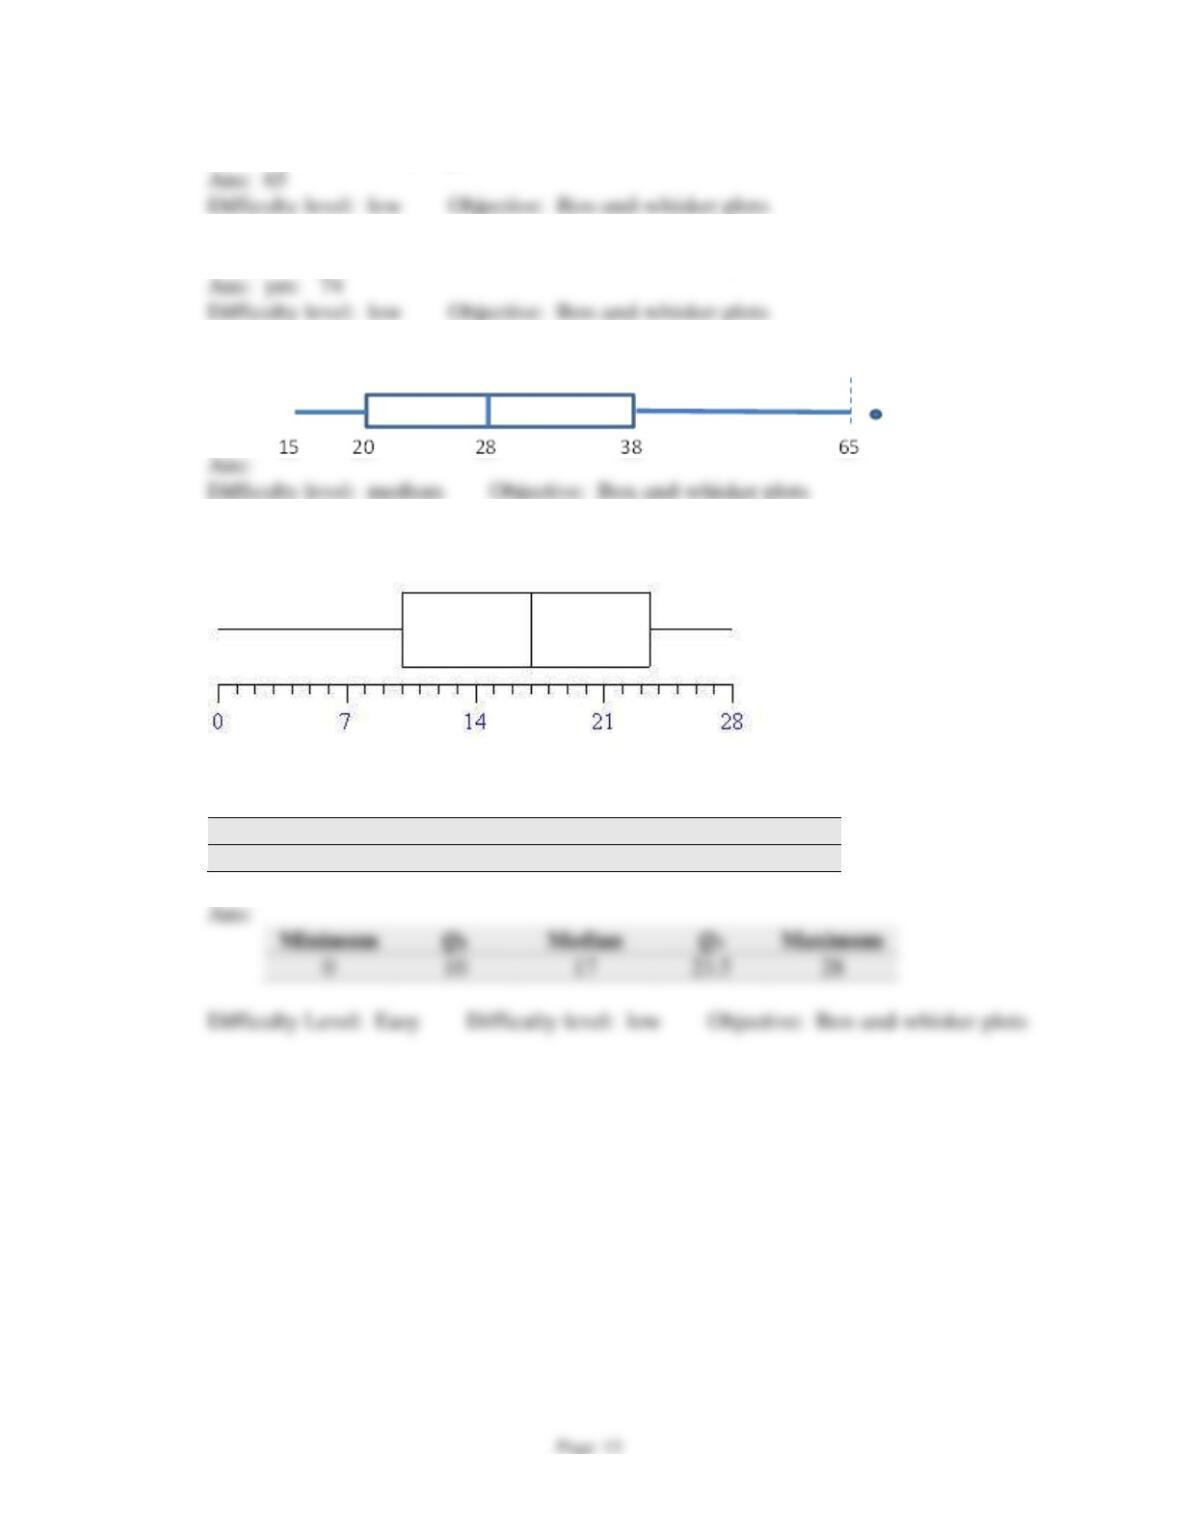
90. Create a boxplot of the data. Describe the features of the distribution.
91. Based on the box-and-whisker plot,
complete the table.
Minimum
Q1
Median
Q3
Maximum
—-
—-
—-
—-
—-
Chapter 3
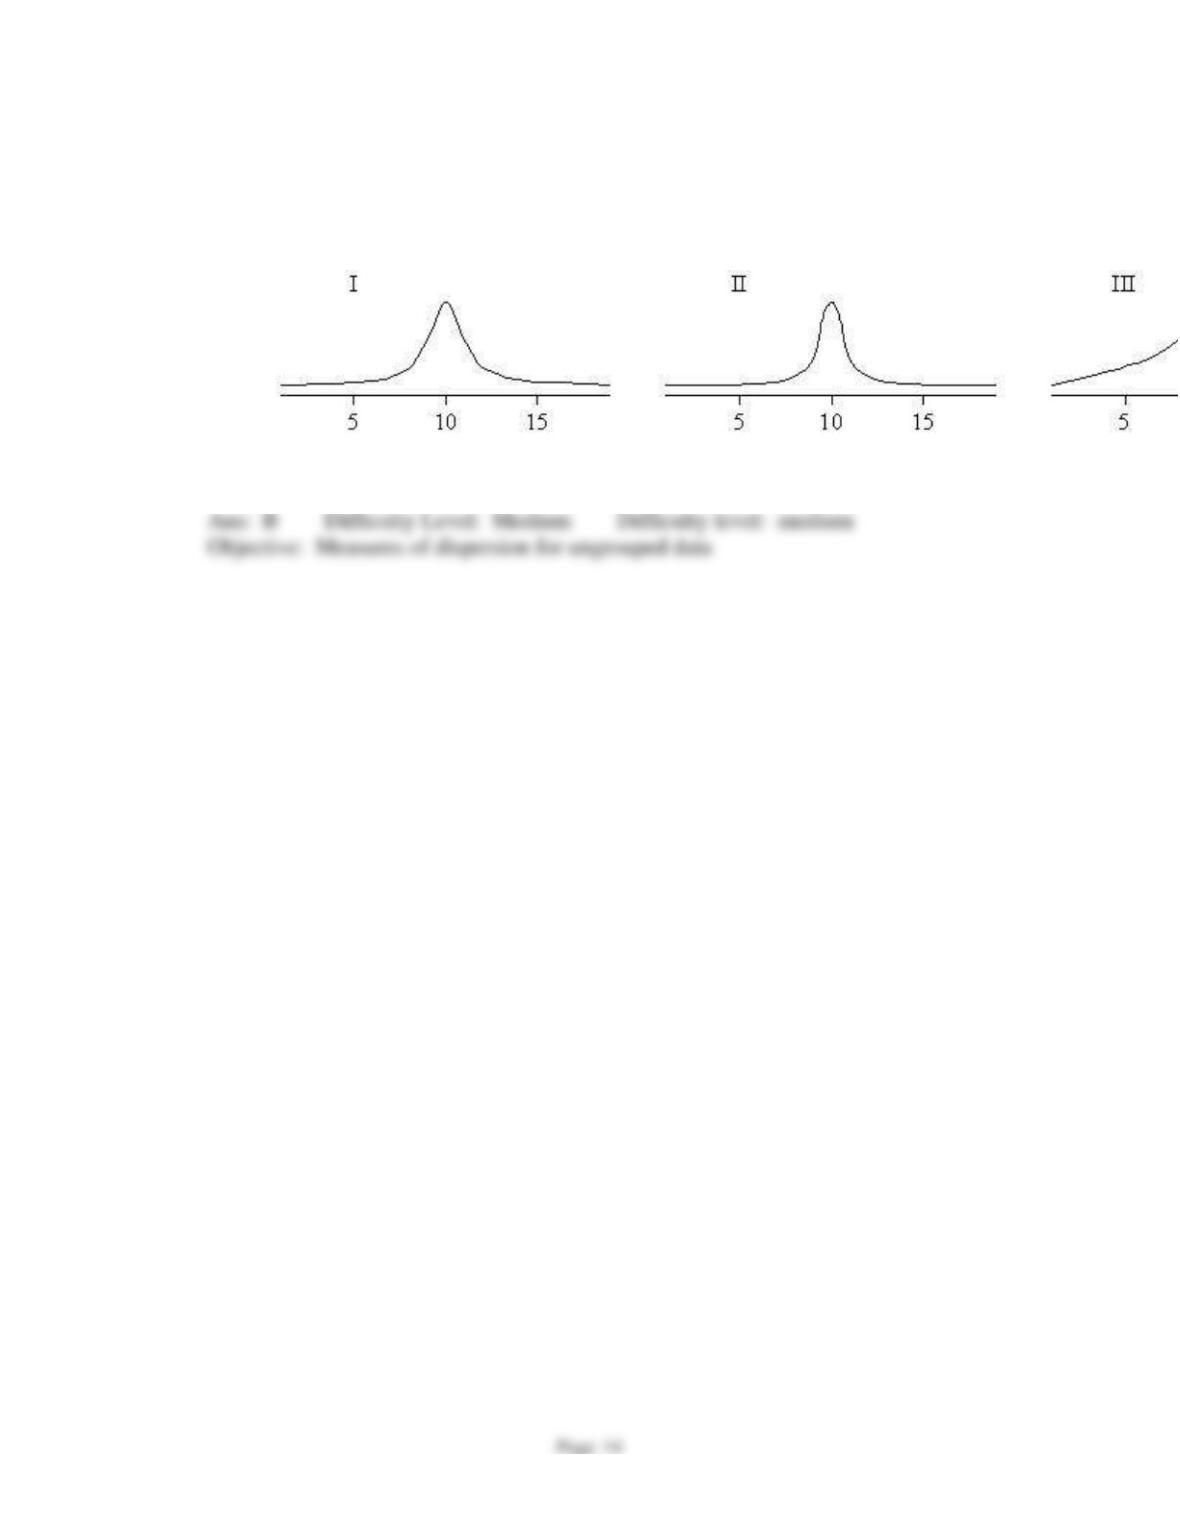
92. Let s1, s2, and s3 be the standard deviations of the bell-shaped graphs I, II, and III,
respectively. Place them in increasing order.
A)
3 1 3
,,s s s
B)
3 1 3
,,s s s
C)
1 3 3
,,s s s
D)
3 3 1
,,sss