
Chapter 2
70. The percentage of persons who commute for 40 or more minutes, rounded to two decimal
places, is:
71. The percentage of persons who commute for less than 50 minutes, rounded to two
decimal places, is:
72. The number of persons who commute for 20 or more minutes is:
73. For the observation 4, the stem is:
74. For the observation 34, the leaf is:
75. You ask 27 people what kind of pet they own. Seven people have dogs, five have cats,
three have birds, and the remainder have no pets. The relative frequency of dog owners,
rounded to three decimal places, is:
76. Fifteen programmers were asked what computer language was used in their first
programming class. The raw data appears below:
Java
Visual Basic
Visual Basic
Java
Fortran
C++
C++
Fortran
Java
Visual Basic
Fortran
Visual Basic
C
Visual Basic
Visual Basic
The percentage of people, rounded to two decimal places, who did not answer “Fortran”
is:
Chapter 2
77. In a game of four-handed Hearts, all 52 cards of a standard deck are dealt, so that each
player starts each round with 13 cards in a hand. Suppose player A’s hand has three clubs,
six diamonds, two hearts, and two spades. What is the relative frequency of spades,
rounded to two decimal places, dealt to player A?
Use the following to answer questions 78-81:
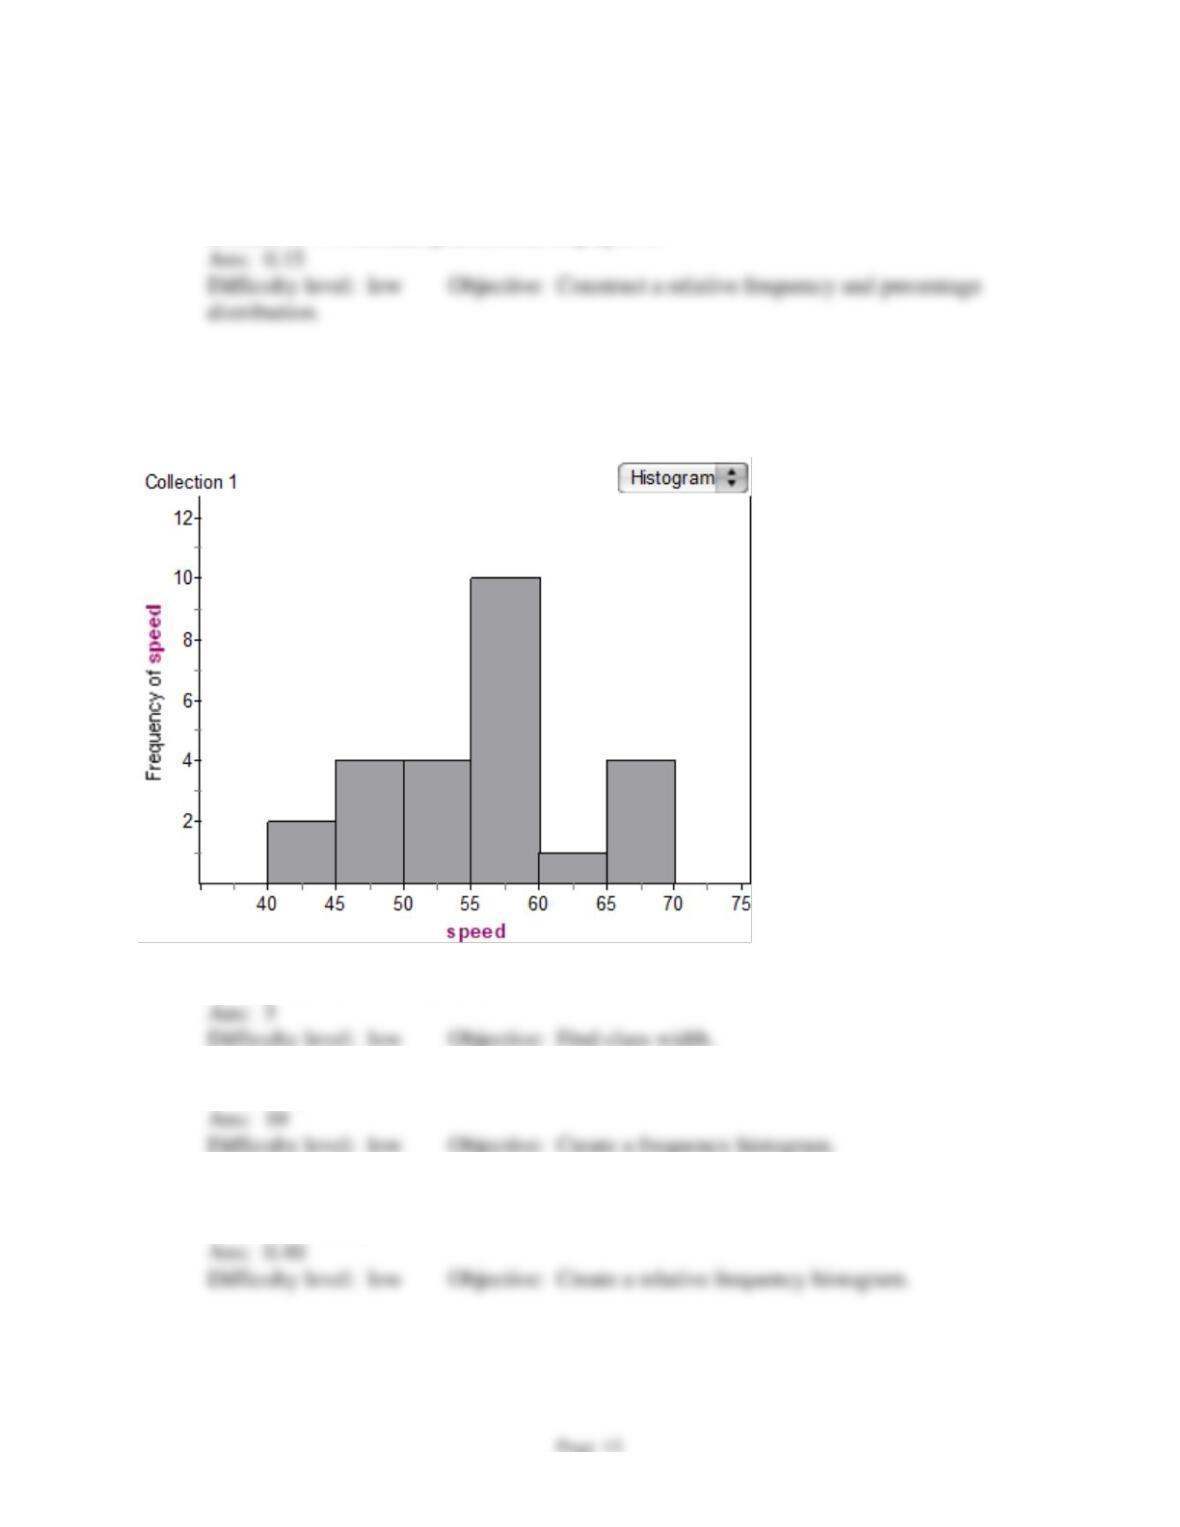
A highway patrolman records the following speeds (in mph) for 25 cars that pass through his
radar within a five-minute interval. Here is the histogram of that data:
78. What is the width of each class?
79. How many observations fall in the fourth interval?
80. The relative frequency of drivers whose speed is less than 55 mph, rounded to two
decimal places, is?
Chapter 2
Page 14
81. The speed limit on this street is 60 mph. What percentage of drivers are traveling at or
above the speed limit?
Use the following to answer questions 82-84:
Suppose you have the following stem-and-leaf display:
1 1 3
2 1 2 8
35
44
Stem: Tens Leaf: Ones
82. What is the value of smallest data point in this data set?
83. How many observations are in this data set?
84. What is the sum of the data values in the bottom two branches in this display?
Use the following to answer questions 85-88:
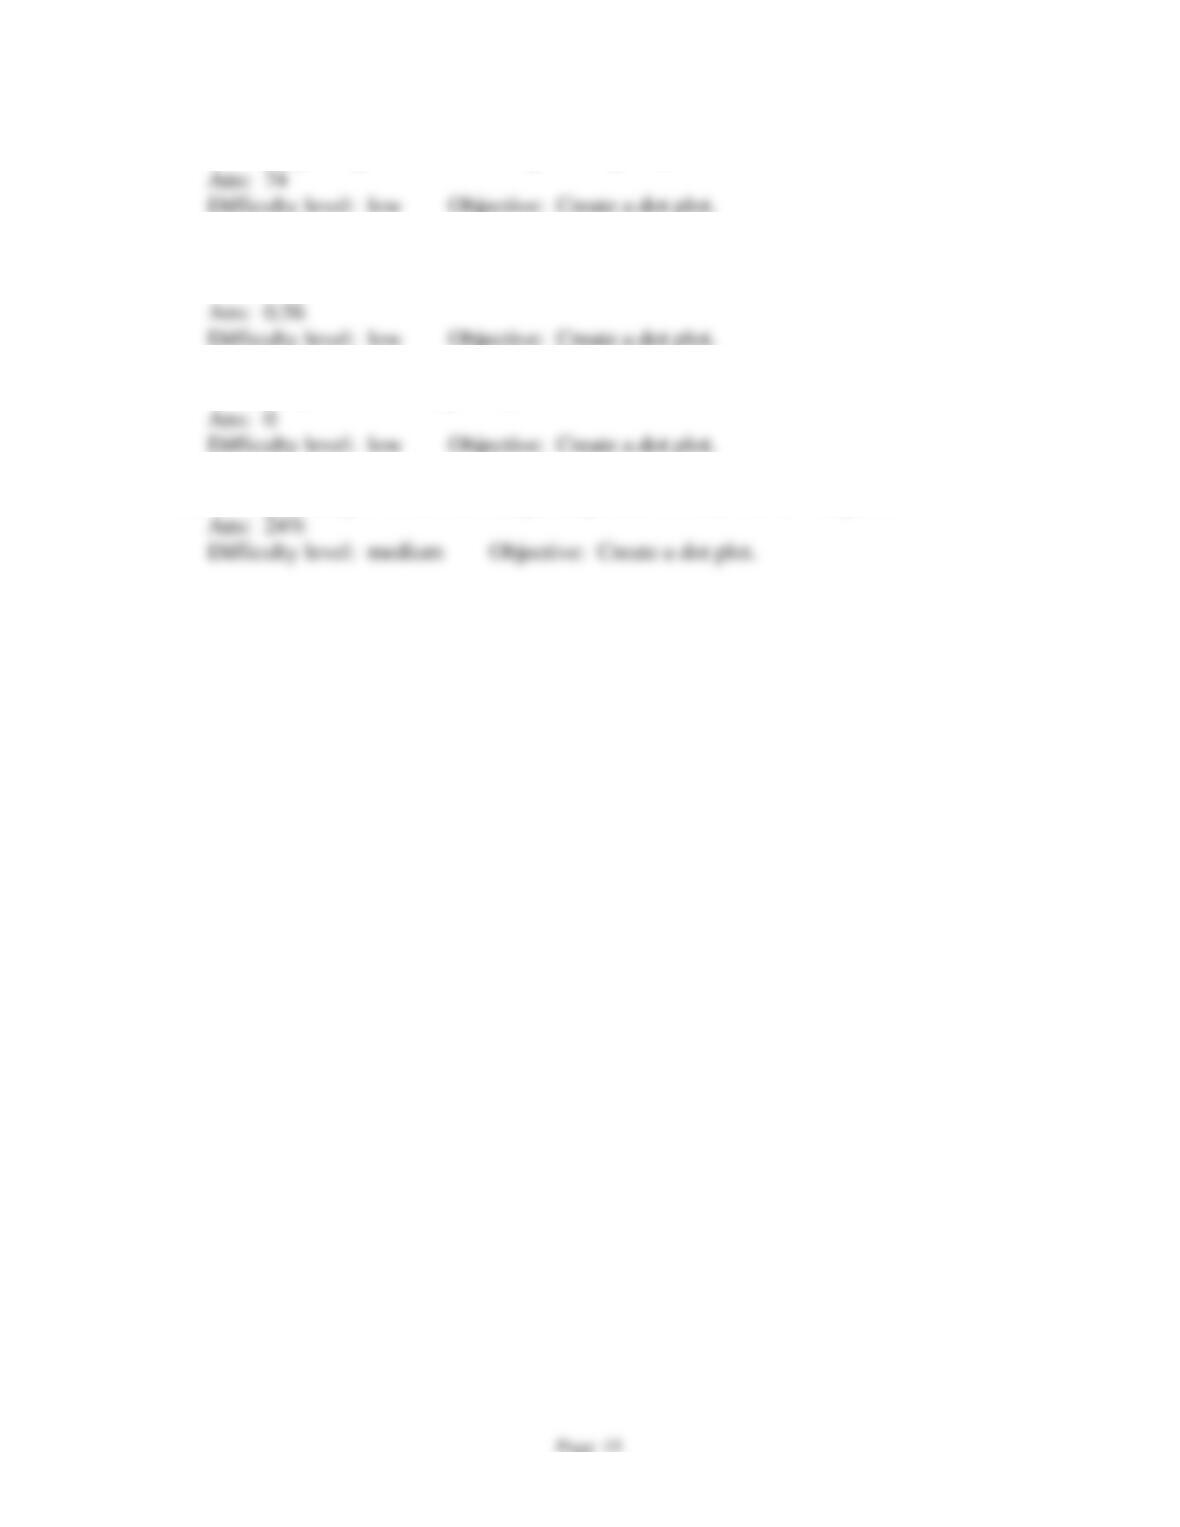
Here is a dot plot of the daily high temperature (in Fahrenheit) from a sample of 25 U.S. cities:
high_temperature
62 64 66 68 70 72 74 76 78
Collection 1 Dot Plot
Chapter 2
85. Which high temperature has the highest frequency?
86. What is the relative frequency of high temperatures, rounded to two decimal places, that
are 71 degrees or lower?
87. How many cities had a high temperature of 72?
88. What percentage of cities had a high temperature of more than 74 degrees?
Chapter 2
Page 16
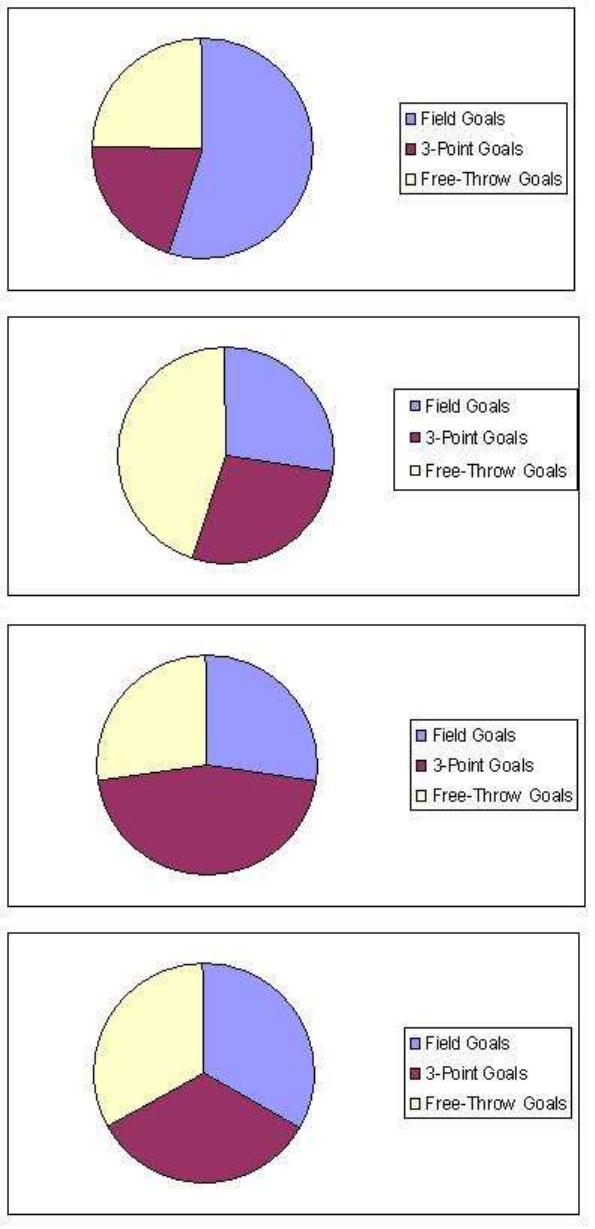
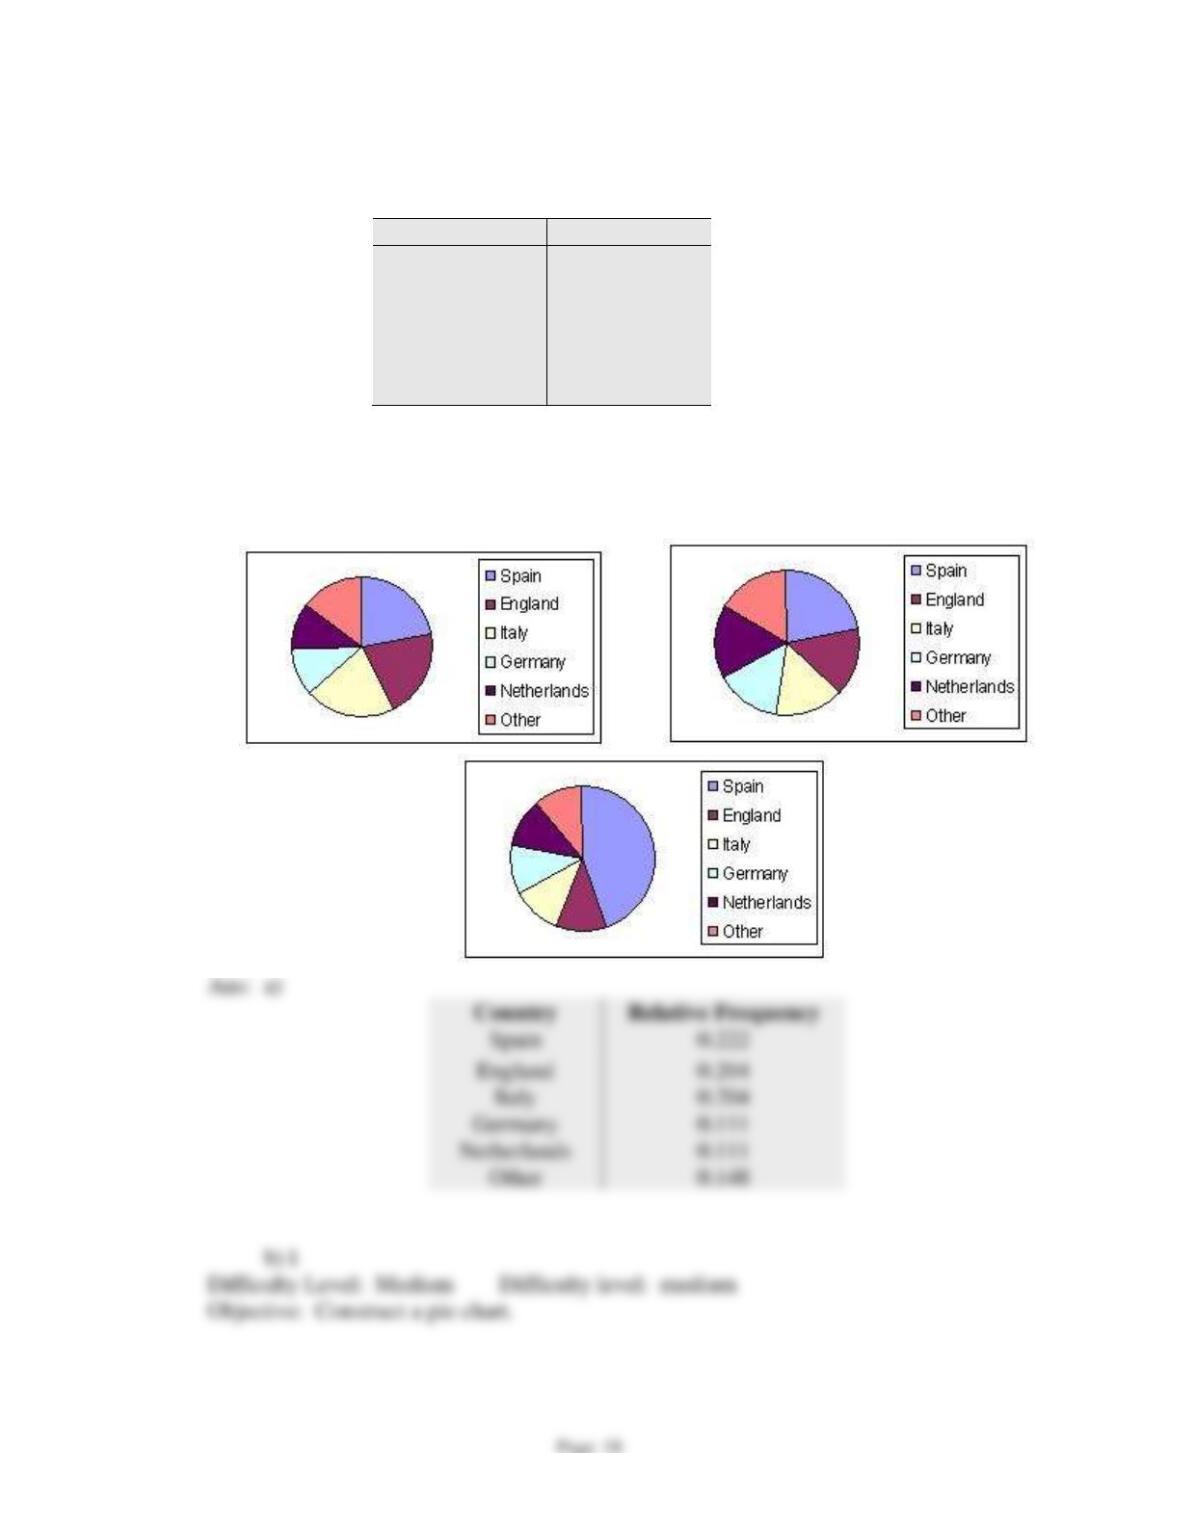
89. In 2007/2008 basketball season, Steve Nash scored 485 field goals, 179 3-point field
goals, and 222 free-throw goals. Find the pie chart that better describes the data.
A)
B)
C)
D)

Chapter 2
Chapter 2
90. The following table shows the countries whose teams have won the UEFA Champions
League.
Country
Frequency
Spain
12
England
11
Italy
11
Germany
6
Netherlands
6
Other
8
a) Calculate the relative frequency of each country. Round your answers to three decimal
places
b) Select the pie chart that better describes the data.
I II
III
Country
England
Italy
Germany
Netherlands
Other
Chapter 2
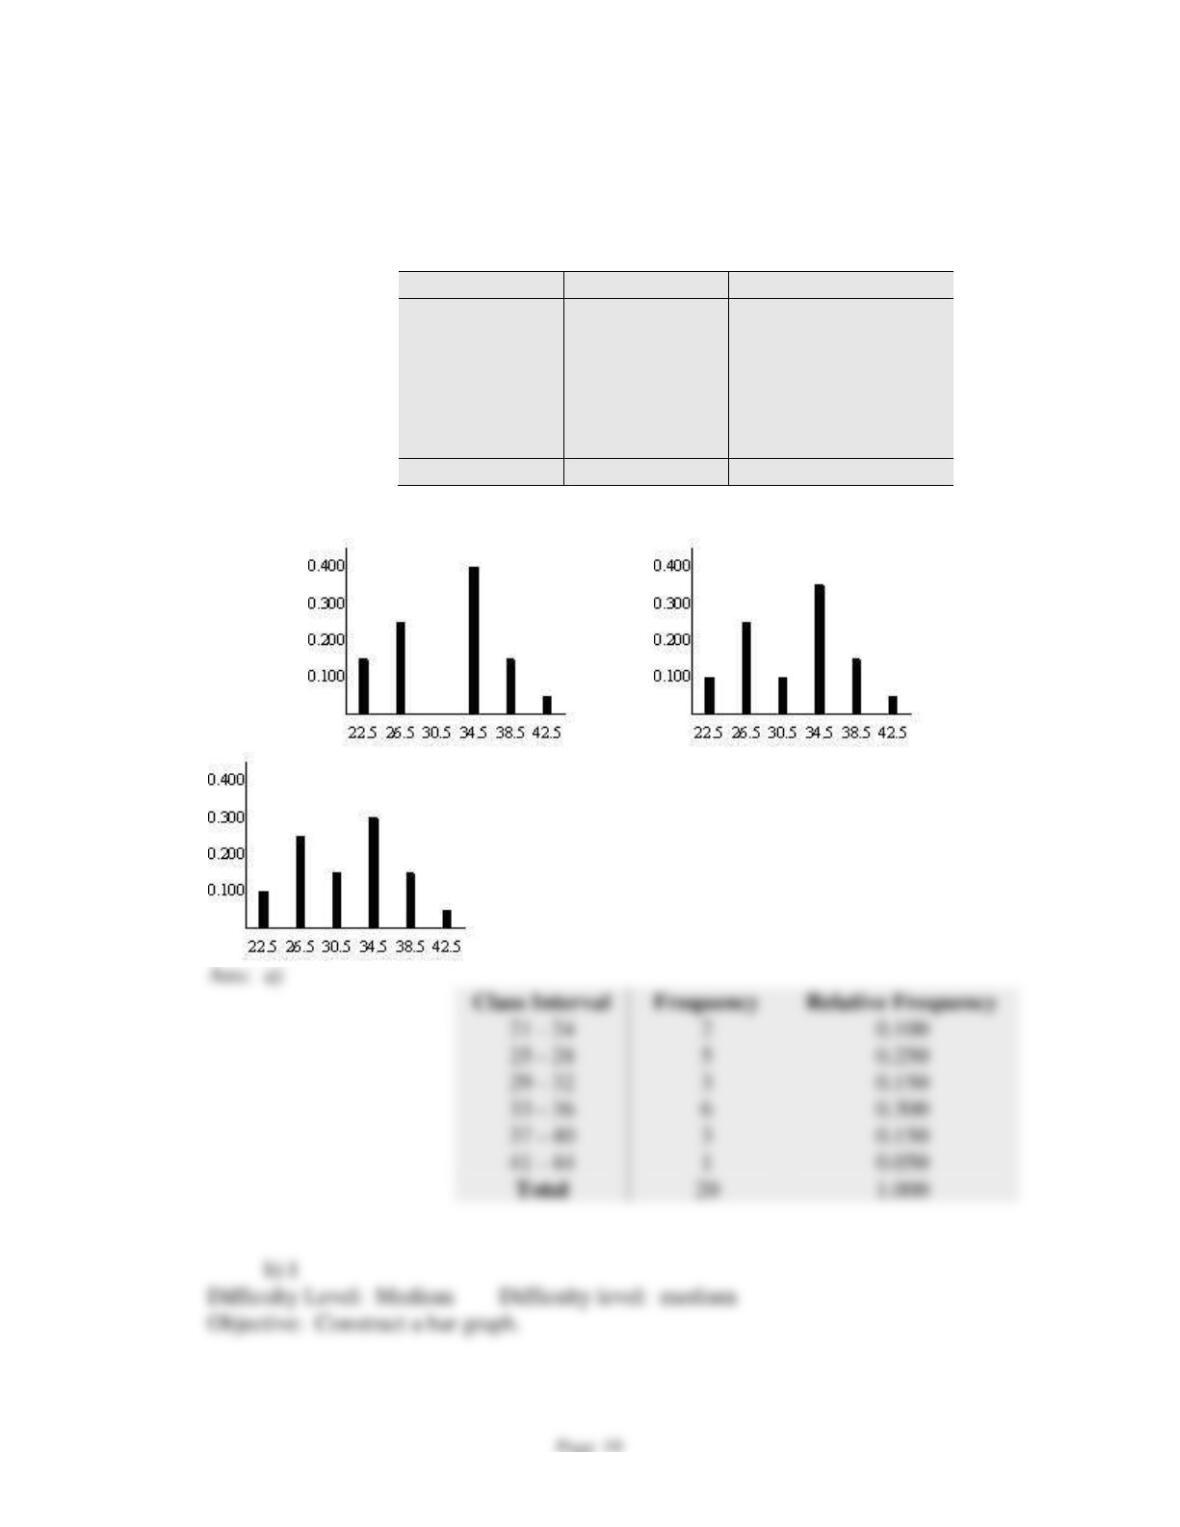
91. The number of touchdowns of a college football team is:
38 36 30 33 37 30 35 34 43 27 36 38 21 26 26 27
31 22 28 36
a) Complete the frequency distribution.
Class Interval
Frequency
Relative Frequency
21 – 24
—-
—-
25 – 28
5
0.250
29 – 32
—-
—-
33 – 36
—-
—-
37 – 40
3
0.150
41 – 44
1
0.050
Total
20
1.000
b) Select the bar graph that matches the data.
I II III
Class Interval
Chapter 2
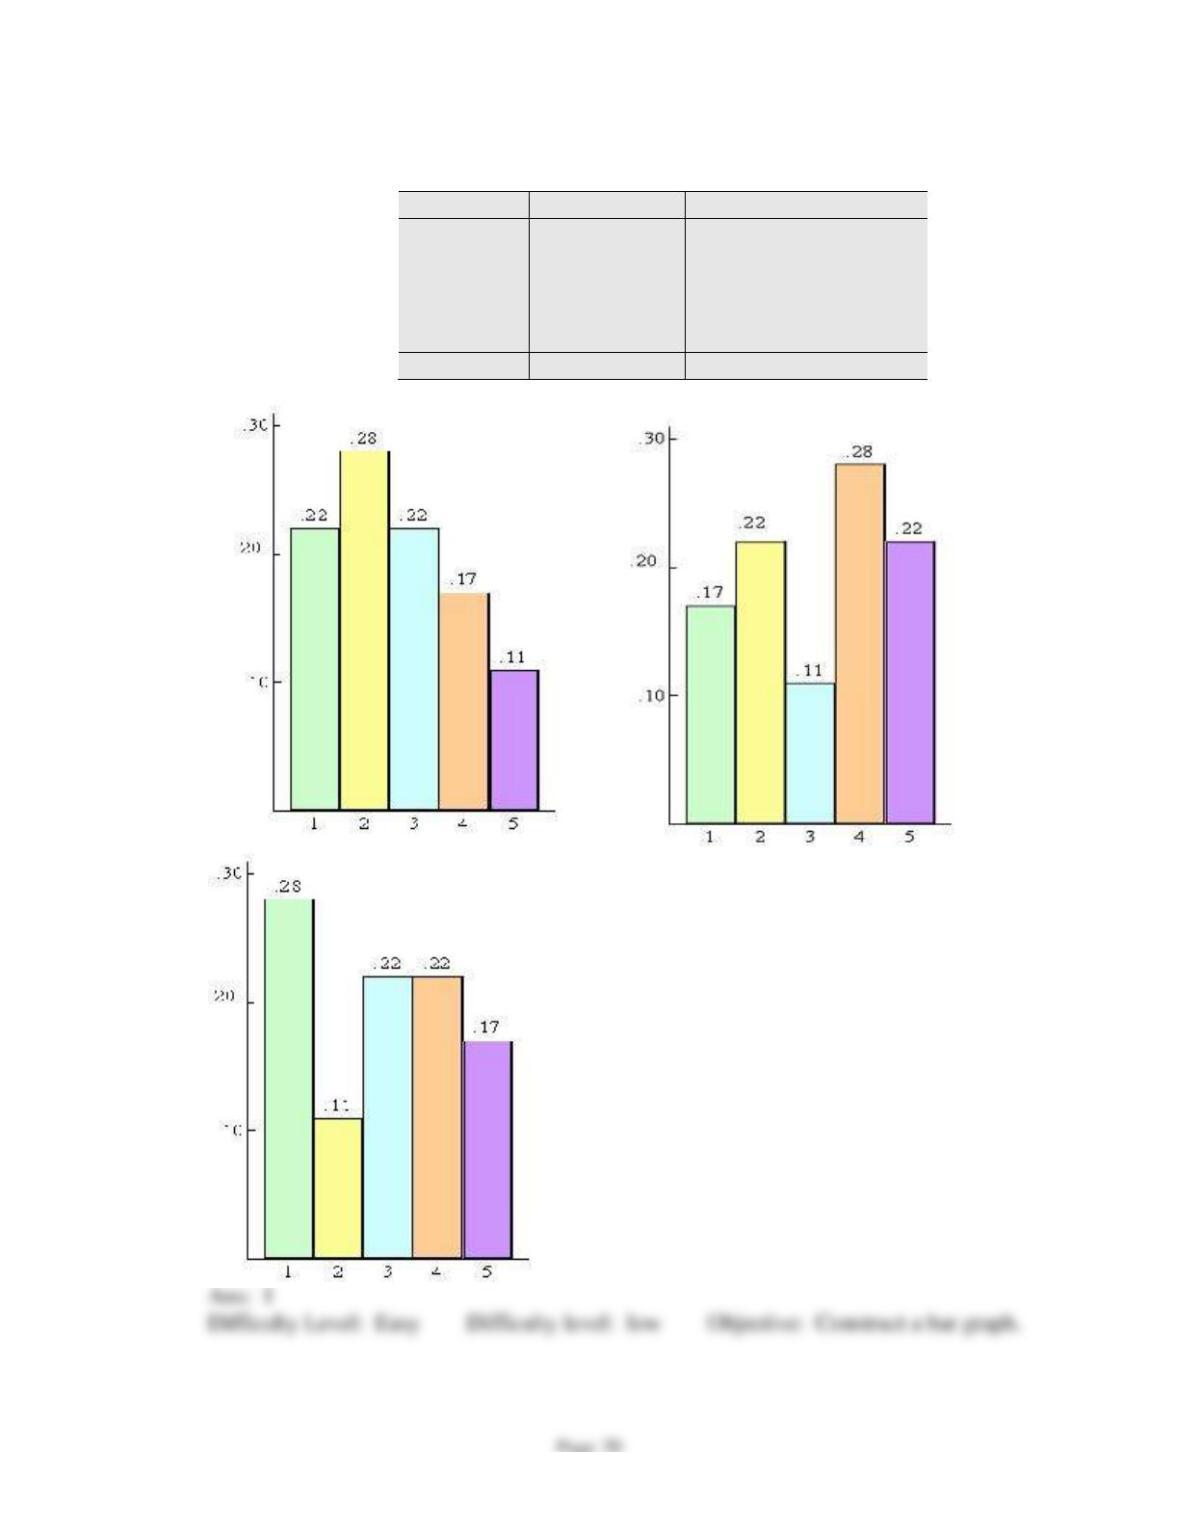
92. Find the histogram that better describes the data.
Value x
Frequency
Relative Frequency
1
4
0.22
2
5
0.28
3
4
0.22
4
3
0.17
5
2
0.11
Total
18
1.000
I II III
Chapter 2
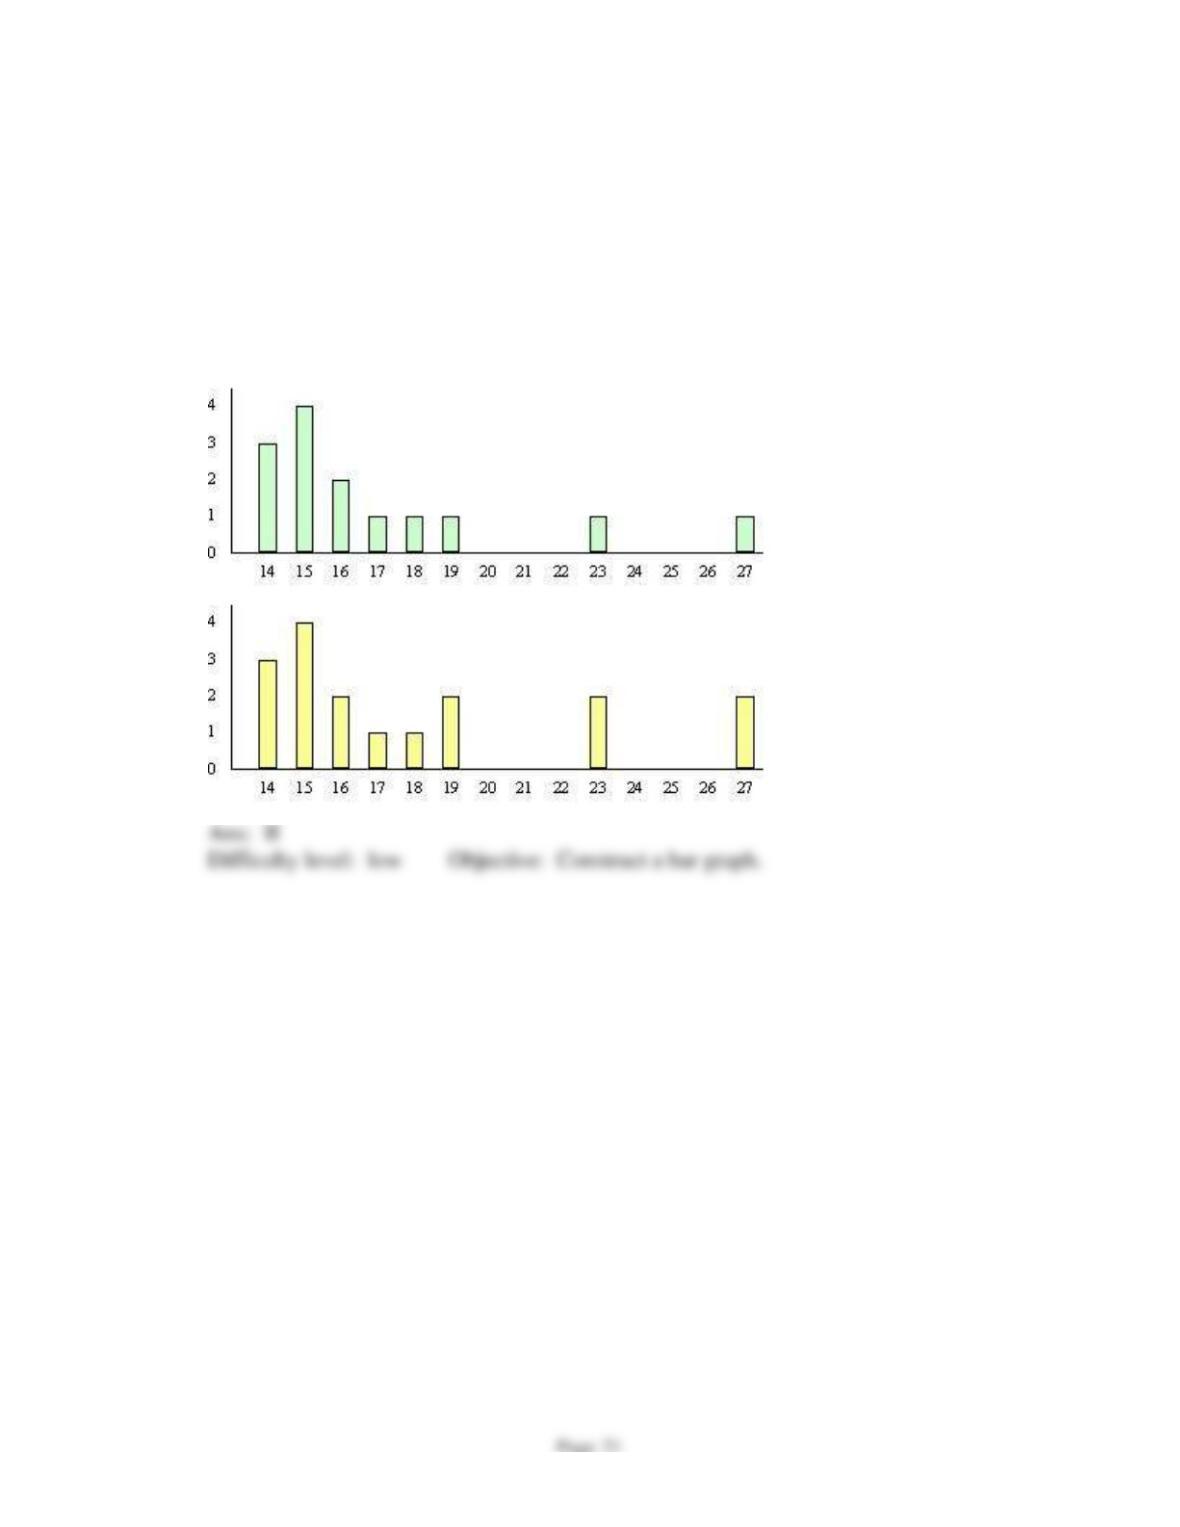
93. The maximum number of goals scored by a national team in the last 14 FIFA’s World
Cups is shown below. Select the bar graph that matches with the data.
14 15 15 16 16 17 23
18 15 14 15 19 14 27
I
II