Archives
Chapter 01 The number observations in a complete data set having 10 elements
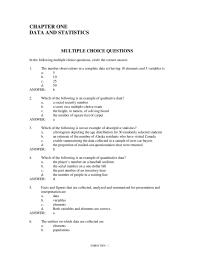
CHAPTER ONE DATA AND STATISTICS MULTIPLE CHOICE QUESTIONS In the following multiple choice questions, circle the correct answer. 1. The number observations in a complete data set having 10 elements and 5 variables is a. 5 b. 10 c. 25 […]
Chapter 02 There are 800 students in the School of Business Administration
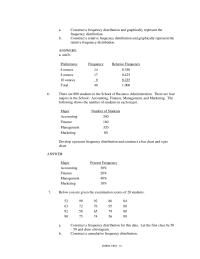
a. Construct a frequency distribution and graphically represent the frequency distribution. b. Construct a relative frequency distribution and graphically represent the relative frequency distribution. ANSWERS: a. and b. Preferences Frequency Relative Frequency 6 ounces 14 0.350 8 ounces 17 0.425 […]
Chapter 02 Which of the following graphical methods is most appropriate for
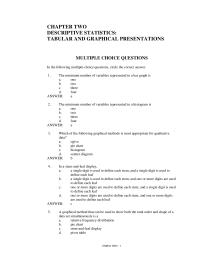
CHAPTER TWO DESCRIPTIVE STATISTICS: TABULAR AND GRAPHICAL PRESENTATIONS MULTIPLE CHOICE QUESTIONS In the following multiple-choice questions, circle the correct answer. 1. The minimum number of variables represented in a bar graph is a. one b. two c. three d. four […]
Chapter 03 The coefficient of determination is equal to the
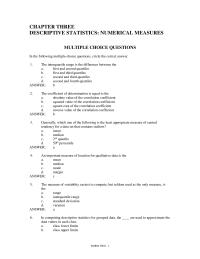
CHAPTER THREE DESCRIPTIVE STATISTICS: NUMERICAL MEASURES MULTIPLE CHOICE QUESTIONS In the following multiple-choice questions, circle the correct answer. 1. The interquartile range is the difference between the a. first and second quartiles b. first and third quartiles c. second and […]
Chapter 03 When should measures of location and dispersion be computed
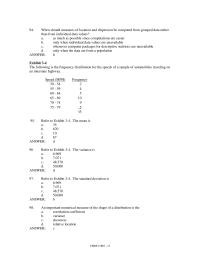
94. When should measures of location and dispersion be computed from grouped data rather than from individual data values? a. as much as possible since computations are easier b. only when individual data values are unavailable c. whenever computer packages […]
Chapter 04 any value between minus infinity to plus infinity
CHAPTER FOUR INTRODUCTION TO PROBABILITY MULTIPLE CHOICE QUESTIONS In the following multiple-choice questions, circle the correct answer. 1. The probability of at least one head in two flips of a coin is a. 0.33 b. 0.50 c. 0.75 d. 1.00 […]
Chapter 04 What The Probability That You Will Receive
b. 0.225 c. 0.75 7. An experiment consists of throwing two six-sided dice and observing the number of spots on the upper faces. Determine the probability that a. the sum of the spots is 3. b. each die shows four […]
Chapter 05 If one wanted to find the probability of ten customer arrivals
CHAPTER FIVE DISCRETE PROBABILITY DISTRIBUTIONS MULTIPLE CHOICE QUESTIONS In the following multiple-choice questions, circle the correct answer. 1. The binomial probability distribution is most symmetric when a. n is 30 or greater b. n equals p c. p approaches 1 […]
Chapter 05 The probability distribution of the daily demand for a product is shown below
c. 10 d. 2.30 ANSWER: b 93. Refer to Exhibit 5-11. The probability that there are 8 occurrences in ten minutes is a. .0241 b. .0771 c. .1126 d. .9107 ANSWER: b 94. Refer to Exhibit 5-11. The probability that […]
Chapter 06 For a continuous random variable x, the probability density function
CHAPTER SIX CONTINUOUS PROBABILITY DISTRIBUTIONS MULTIPLE-CHOICE QUESTIONS In the following multiple-choice questions, circle the correct answer. 1. If arrivals follow a Poisson probability distribution, the time between successive arrivals must follow a. a Poisson probability distribution b. a normal probability […]
Chapter 06 What is the probability that the stock price will be more than
ANSWER: a Exhibit 6-7 f(x) =(1/10) e-x/10 x 0 92. Refer to Exhibit 6-7. The mean of x is a. 0.10 b. 10 c. 100 d. 1,000 ANSWER: b 93. Refer to Exhibit 6-7. The probability that x is […]
Chapter 07 Sample New Models Automobiles Provides The Following
b. the same as convenience sampling c. a probability sampling method d. None of the alternative answers is correct. ANSWER: c 86. Convenience sampling is an example of a. probabilistic sampling b. stratified sampling c. a nonprobability sampling technique d. […]
Chapter 07 The expected value of x equals the mean of the population from which
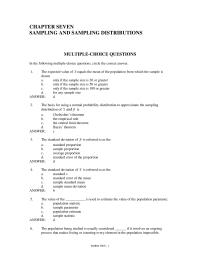
CHAPTER SEVEN SAMPLING AND SAMPLING DISTRIBUTIONS MULTIPLE-CHOICE QUESTIONS In the following multiple-choice questions, circle the correct answer. 1. The expected value of x equals the mean of the population from which the sample is drawn a. only if the sample […]
Chapter 08 A random sample of 81 children with working mothers
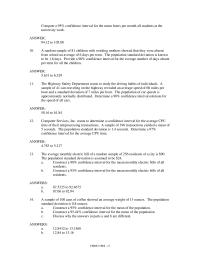
Compute a 95% confidence interval for the mean hours per month all students at the university work. ANSWER: 94.12 to 105.88 10. A random sample of 81 children with working mothers showed that they were absent from school an average […]
Chapter 08 Which Of the Following Statements True a the Standard Normal
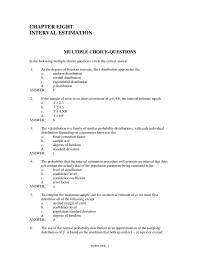
CHAPTER EIGHT INTERVAL ESTIMATION MULTIPLE CHOICE-QUESTIONS In the following multiple-choice questions, circle the correct answer. 1. As the degrees of freedom increase, the t distribution approaches the a. uniform distribution b. normal distribution c. exponential distribution d. p distribution ANSWER: […]
Chapter 09 A Type I error for this situation would be to incorrectly
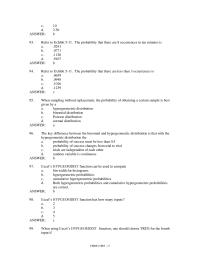
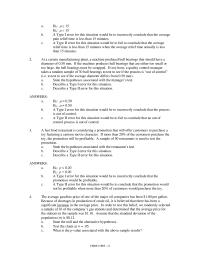
a. H0: 15 Ha: 15 b. A Type I error for this situation would be to incorrectly conclude that the average pain relief time is less than 15 minutes. c. A Type II error for this […]
Chapter 09 Two approaches to drawing a conclusion in a hypothesis test are
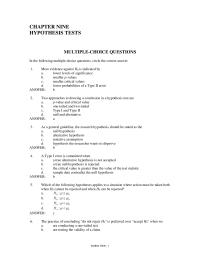
CHAPTER NINE HYPOTHESIS TESTS MULTIPLE-CHOICE QUESTIONS In the following multiple-choice questions, circle the correct answer. 1. More evidence against H0 is indicated by a. lower levels of significance b. smaller p-values c. smaller critical values d. lower probabilities of a […]
Chapter 10 Eighteen People Were Randomly Chosen For The
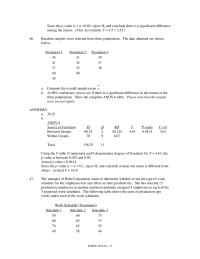
Since the p-value is < =0.05; reject Ho and conclude there is a significant difference among the means. (Also, test statistic F = 4.5 > 3.35.) 46. Random samples were selected from three populations. The data obtained are shown […]
Chapter 10 Samples Were Selected From Three Populations The
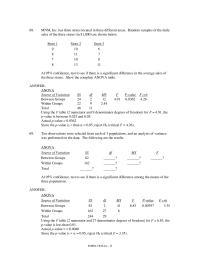
68. MNM, Inc. has three stores located in three different areas. Random samples of the daily sales of the three stores (in $1,000) are shown below. Store 1 Store 2 Store 3 9 10 6 8 11 7 7 10 […]
Chapter 10 The process of using the same or similar experimental units for all
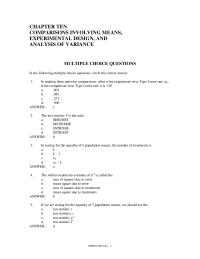
CHAPTER TEN COMPARISONS INVOLVING MEANS, EXPERIMENTAL DESIGN, AND ANALYSIS OF VARIANCE MULTIPLE CHOICE QUESTIONS In the following multiple-choice questions, circle the correct answer. 1. In making three pairwise comparisons, what is the experiment-wise Type I error rate ew if […]
Chapter 10 The null hypothesis is to be tested at the 5% level of significance
b. 500 c. 1,687.5 d. 2,250 ANSWER: b 105. Refer to Exhibit 10-16. The test statistic to test the null hypothesis equals a. 0.22 b. 0.84 c. 4.22 d. 4.5 ANSWER: d 106. Refer to Exhibit 10-16. The null hypothesis […]
Chapter 11 Education College See Whether Not The Proportions
CHAPTER ELEVEN COMPARISONS INVOLVING PROPORTIONS AND A TEST OF INDEPENDENCE MULTIPLE CHOICE QUESTIONS In the following multiple-choice questions, circle the correct answer. 1. The test of independence presented in our textbook requires that there be a. two variables, each having […]
Chapter 11 a random sample of 1200 voters showed that 540 favored the Democratic
EMBS4-TB11.doc – 19 Undecided 10% After the presidential debates, a random sample of 1200 voters showed that 540 favored the Democratic candidate; 480 were in favor of the Republican candidate; 40 were in favor of the Independent candidate, and 140 […]
Chapter 12 Perform an F test and determine whether or
c. Perform an F test and determine whether or not there is a significant relationship between demand and unit price. Let = 0.05. d. Perform a t test to determine whether the slope is significantly different from zero. Let […]
Chapter 12 The proportion of the variation in the dependent variable
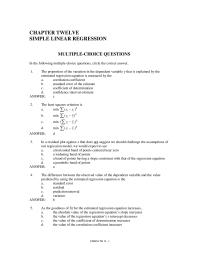
CHAPTER TWELVE SIMPLE LINEAR REGRESSION MULTIPLE-CHOICE QUESTIONS In the following multiple-choice questions, circle the correct answer. 1. The proportion of the variation in the dependent variable y that is explained by the estimated regression equation is measured by the a. […]
Chapter 13 As the goodness of fit for the estimated multiple regression
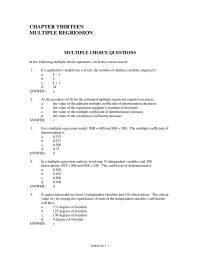
CHAPTER THIRTEEN MULTIPLE REGRESSION MULTIPLE CHOICE QUESTIONS In the following multiple-choice questions, circle the correct answer. 1. If a qualitative variable has k levels, the number of dummy variables required is a. k − 1 b. k c. k + […]
Chapter 13 Perform Test And Determine Whether Not The
e. At = 0.05, test to see if there is a relation between x3 and y. ANSWERS: a. ˆ y = 10 – 2×1 + 6×2 – 4×3 b. 0.4286; 42.86% of variation in dependent variable is explained by […]
Chapter 14 Control charts that are based on data indicating the presence
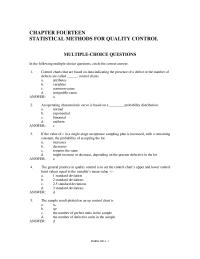
CHAPTER FOURTEEN STATISTICAL METHODS FOR QUALITY CONTROL MULTIPLE-CHOICE QUESTIONS In the following multiple-choice questions, circle the correct answer. 1. Control charts that are based on data indicating the presence of a defect or the number of defects are called ______ […]