
b. 500
c. 1,687.5
d. 2,250
105. Refer to Exhibit 10-16. The test statistic to test the null hypothesis equals
a. 0.22
b. 0.84
c. 4.22
d. 4.5
106. Refer to Exhibit 10-16. The null hypothesis is to be tested at the 5% level of
significance. The p-value is
a. less than .01
b. between .01 and .025
c. between .025 and .05
d. between .05 and .10
107. Refer to Exhibit 10-16. The null hypothesis
a. should be rejected
b. should not be rejected
c. was designed incorrectly
d. None of these alternatives is correct.
PROBLEMS
1. The following sample information is given concerning the ACT scores of high school
seniors form two local schools.
School A
School B
1
n
= 14
2
n
= 15
1
x
= 25
2
x
= 23
2
1
= 16
2
2
= 10
Develop a 95% confidence interval estimate for the difference between the two
populations.
2. Maxforce, Inc. manufactures racquetball racquets by two different manufacturing processes
(A and B). Because the management of this company is interested in estimating the
difference between the average time it takes each process to produce a racquet, they select
independent samples from each process. The results of the samples are shown below.

Process A
Process B
Sample Size
32
35
Sample Mean (in minutes)
43
47
Population Variance (2)
64
70
a. Develop a 95% confidence interval estimate for the difference between the average
times of the two processes.
b. Is there conclusive evidence to prove that one process takes longer than the other? If
yes, which process? Explain.
3. Consider the following results for two samples randomly taken from two normal
populations with equal variances.
Sample I
Sample II
Sample Size
28
35
Sample Mean
48
44
Population Standard Deviation
9
10
a. Develop a 95% confidence interval for the difference between the two population
means.
b. Is there conclusive evidence that one population has a larger mean? Explain.
4. The business manager of a local health clinic is interested in estimating the difference
between the fees for extended office visits in her center and the fees of a newly opened
group practice. She gathered the following information regarding the two offices.
Health Clinic
Group Practice
Sample Size
50 visits
45 visits
Sample Mean
$21
$19
Population Standard Deviation
$2.75
$3.00
Develop a 95% confidence interval estimate for the difference between the average fees
of the two offices.
5. Independent random samples taken on two university campuses revealed the following
information concerning the average amount of money spent on textbooks during the fall
semester.
University A
University B
Sample Size
50
40
Average Purchase
$260
$250
Population Standard Deviation()
$20
$23
We want to determine if, on the average, students at University A spent more on
textbooks then the students at University B.
a. Compute the test statistic.
b. Compute the p-value.
c. What is your conclusion? Let = .05.
6. The management of Recover Fast Hospital (RFH) claims that the average length of stay in
their hospital after a major surgery is less than the average length of stay at General
Hospital (GH). The following data have been accumulated to test their claim.
RFH
GH
Sample size
45
58
Mean (in days)
4.6
4.9
Population Standard Deviation ()
0.5
0.6
a. Formulate the hypotheses.
b. Compute the test statistic.
c. Using the p-value approach, test to see if the average length of stay in RFH is
significantly less than the average length of stay in GH. Let = 0.05.
7. In order to estimate the difference between the average Miles per Gallon of two different
models of automobiles, samples are taken and the following information is collected.
Model A
Model B
Sample Size
60
55
Sample Mean
28
25
Sample Variance
16
9
a. At 95% confidence develop an interval estimate for the difference between the
average Miles per Gallon for the two models.
b. Is there conclusive evidence to indicate that one model gets a higher MPG than the
other? Why or why not? Explain.
8. Consider the following results for two samples randomly taken from two populations.
Sample A
Sample B
Sample Size
31
35
Sample Mean
106
102
Sample Standard Deviation
8
7
a. Determine the degrees of freedom for the t distribution.
b. Develop a 95% confidence interval for the difference between the two population
means.
9. Consider the following results for two samples randomly taken from two populations.
Sample A
Sample B
Sample Size
25
38
Sample Mean
66
60
Sample Standard Deviation
5
7
a. What are the degrees of freedom for the t distribution?
b. At 95% confidence, compute the margin of error.
c. Develop a 95% confidence interval for the difference between the two population
means.
10. Consider the following results for two samples randomly taken from two populations.
Sample A
Sample B
Sample Size
20
25
Sample Mean
28
22
Sample Standard Deviation
5
6

a. Determine the degrees of freedom for the t distribution.
b. At 95% confidence, what is the margin of error?
c. Develop a 95% confidence interval for the difference between the two population
means.
11. Consider the following results for two samples randomly taken from two populations.
Sample A
Sample B
Sample Size
28
30
Sample Mean
24
22
Sample Standard Deviation
8
6
a. Determine the degrees of freedom for the t distribution.
b. Develop a 95% confidence interval for the difference between the two population
means.
c. Is there conclusive evidence that one population has a larger mean? Explain.
12. The following are the test scores of two samples of students from University A and
University B on a national statistics examination. Develop a 95% confidence interval
estimate for the difference between the mean scores of the two populations.
University A
Scores
University B
Scores
x
86
83
n
64
87
6
8
13. In order to estimate the difference between the average mortgages in the southern states
and the northern states, the following information was gathered.
Southern
Northern
Sample Size
40
45
Sample Mean (in $1,000)
$170
$175
Sample Standard Deviation (in $1,000)
$5
$7

a. Compute the degrees of freedom for the t distribution.
b. Develop an interval estimate for the difference between the average of the mortgages
in the South and North. Let alpha = 0.05.
14. A credit company has gathered information regarding the average amount owed by
people under 30 years old and by people over 30 years. Independent random samples
were taken from both age groups. You are given the following information.
Under 30
Over 30
x
600
550
n
200
300
2
361
400
Construct a 95% confidence interval for the difference between the average amounts
owed by the two age groups.
15. Two independent random samples of annual starting salaries for individuals with masters
and bachelors degrees in business were taken and the results are shown below.
Masters
Degree
Bachelors
Degree
Sample Size
33
30
Sample Mean (in $1,000)
58
54
Sample Standard Deviation (in $1,000)
2.4
2.0
a. What are the degrees of freedom for the t distribution?
b. Provide a 95% confidence interval estimate for the difference between the salaries of
the two groups.
16. Samples of employees of Companies A and B provided the following information
regarding the ages of employees.
Company A
Company B
Sample Size
32
36
Average Age
42
47
Variance
16
36
Develop a 97% confidence interval for the difference between the average ages of the

employees of the two companies.
17. Test scores on a standardized test from samples of students from two universities are
given below.
UA
UB
Sample Size
28
41
Average Test Score
84
82
Variance
64
100
Provide a 98% confidence interval estimate for the difference between the test scores of
the two universities.
18. In order to estimate the difference between the average age of male and female
employees at the Young Corporation, the following information was gathered.
Male
Female
Sample Size
32
36
Sample Mean
25
23
Sample Standard Deviation
4
6
Develop a 95% confidence interval estimate for the difference between the average age
of male and female employees at the Young Corporation.
19. In order to estimate the difference between the average yearly salaries of top managers in
private and governmental organizations, the following information was gathered.
Private
Governmental
Sample Size
50
60
Sample Mean (in $1,000s)
190
180
Sample Standard Deviation (in $1,000s)
6
8
Develop an interval estimate for the difference between the average salaries of the two
sectors. Let = .05.
20. The following information regarding the ages of full-time and part-time students are

given. Using the following data, develop an interval estimate for the difference between
the mean ages of the two populations. Use a 5% level of significance. The degrees of
freedom for the t distribution are 106.
Full-Time
Part-Time
x
27
24
s
1.5
2
n
50
60
21. The following information regarding the number of semester hours taken from random
samples of day and evening students is provided.
Day
Evening
x
16
12
s
4
2
n
140
160
Develop a 95% confidence interval estimate for the difference between the mean
semester hours taken by the two groups of students.
22. A random sample of 89 tourists in the Grand Bahamas showed that they spent an average
of $2,860 (in a week) with a standard deviation of $126; and a sample of 64 tourists in
New Province showed that they spent an average of $2,935 (in a week) with a standard
deviation of $138. We are interested in determining if there is any significant difference
between the average expenditures of those who visited the two islands?
a. Determine the degrees of freedom for this test.
b. Compute the test statistic.
c. Compute the p-value.
d. What is your conclusion? Let = .05.
23. Consider the following hypothesis test:
H0:
1 −
2 0
Ha:
1 −
2 > 0
The following results are for two independent samples taken from two populations.

Sample 1
Sample 2
Sample Size
35
34
Sample Mean
43
37
Sample Variance
140
170
a. Determine the degrees of freedom for the t distribution.
b. Compute the test statistic.
c. Determine the p-value and test the above hypotheses.
24. Recently, a local newspaper reported that part time students are older than full time
students. In order to test the validity of its statement, two independent samples of
students were selected.
Full Time
Part Time
x
26
24
s
2
3
n
42
31
a. Give the hypotheses for the above.
b. Determine the degrees of freedom.
c. Compute the test statistic.
d. At 95% confidence, test to determine whether or not the average age of part time
students is significantly more than full time students.
25. Independent random samples of managers’ yearly salaries (in $1000) taken from
governmental and private organizations provided the following information. At 95%
confidence, test to determine if there is a significant difference between the average
salaries of the managers in the two sectors.
Government
Private
x
80
75
s
9
10
n
28
31
26. Independent random samples taken at two local malls provided the following information
regarding purchases by patrons of the two malls.
Hamilton Place
Eastgate
Sample Size
85
93
Average Purchase
$143
$150
Standard Deviation
$22
$18
We want to determine whether or not there is a significant difference between the average
purchases by the patrons of the two malls.
a. Give the hypotheses for the above.
b. Compute the test statistic.
c. At 95% confidence, test the hypotheses.
27. The Dean of Students at UTC has said that the average grade of UTC students is higher
than that of the students at GSU. Random samples of grades from the two schools are
selected, and the results are shown below.
UTC
GSU
Sample Size
14
12
Sample Mean
2.85
2.61
Sample Standard Deviation
0.40
0.35
Sample Mode
2.5
3.0
a. Give the hypotheses.
b. Compute the test statistic.
c. At a 0.1 level of significance, test the Dean of Students’ statement.
28. Zip, Inc. manufactures Zip drives on two different manufacturing processes. Because the
management of this company is interested in determining if process 1 takes less
manufacturing time, they selected independent samples from each process. The results of
the samples are shown below.
Process 1
Process 2
Sample Size
27
22
Sample Mean (in minutes)
10
14
Sample Variance
16
25
a. State the null and alternative hypotheses.
b. Determine the degrees of freedom for the t test.
c. Compute the test statistic
d. At 95% confidence, test to determine if there is sufficient evidence to indicate that
process 1 takes a significantly shorter time to manufacture the Zip drives.
29. A recent Time magazine reported the following information about a sample of workers in
Germany and the United States.
United States
Germany
Average length of workweek (hours)
42
38
Sample Standard Deviation
5
6
Sample Size
600
700
We want to determine whether or not there is a significant difference between the average
workweek in the United States and the average workweek in Germany.
a. State the null and the alternative hypotheses.
b. Compute the test statistic.
c. Compute the p-value. What is your conclusion?
30. Independent random samples taken at two companies provided the following information
regarding annual salaries of the employees.
Marissa, Inc
Jason, Inc.
Sample Size
72
50
Sample Mean (in $1,000)
48
43
Sample Standard Deviation (in $1,000)
12
10
a. We want to determine whether or not there is a significant difference between the

average salaries of the employees at the two companies. Compute the test statistic.
b. Compute the p-value; and at 95% confidence, test the hypotheses.
31. Two independent samples are drawn from two populations, and the following
information is provided.
Population 1
Population 2
n
34
52
x
55
65
s
14
18
We want to test the following hypotheses.
Ho:
1 −
2 0
Ha:
1 −
2 < 0
a. Determine the degrees of freedom.
b. Compute the test statistic.
c. At 95% confidence, test the hypotheses. Assume the two populations are normally
distributed and have equal variances.
32. In order to determine whether or not a driver’s education course improves the scores on a
driving exam, a sample of 6 students were given the exam before and after taking the
course. The results are shown below.
Let d = Score After – Score Before.
Score
Score
Student
Before the Course
After the Course
1
83
87
2
89
88
3
93
91
4
77
77
5
86
93
6
79
83
a. Compute the test statistic.
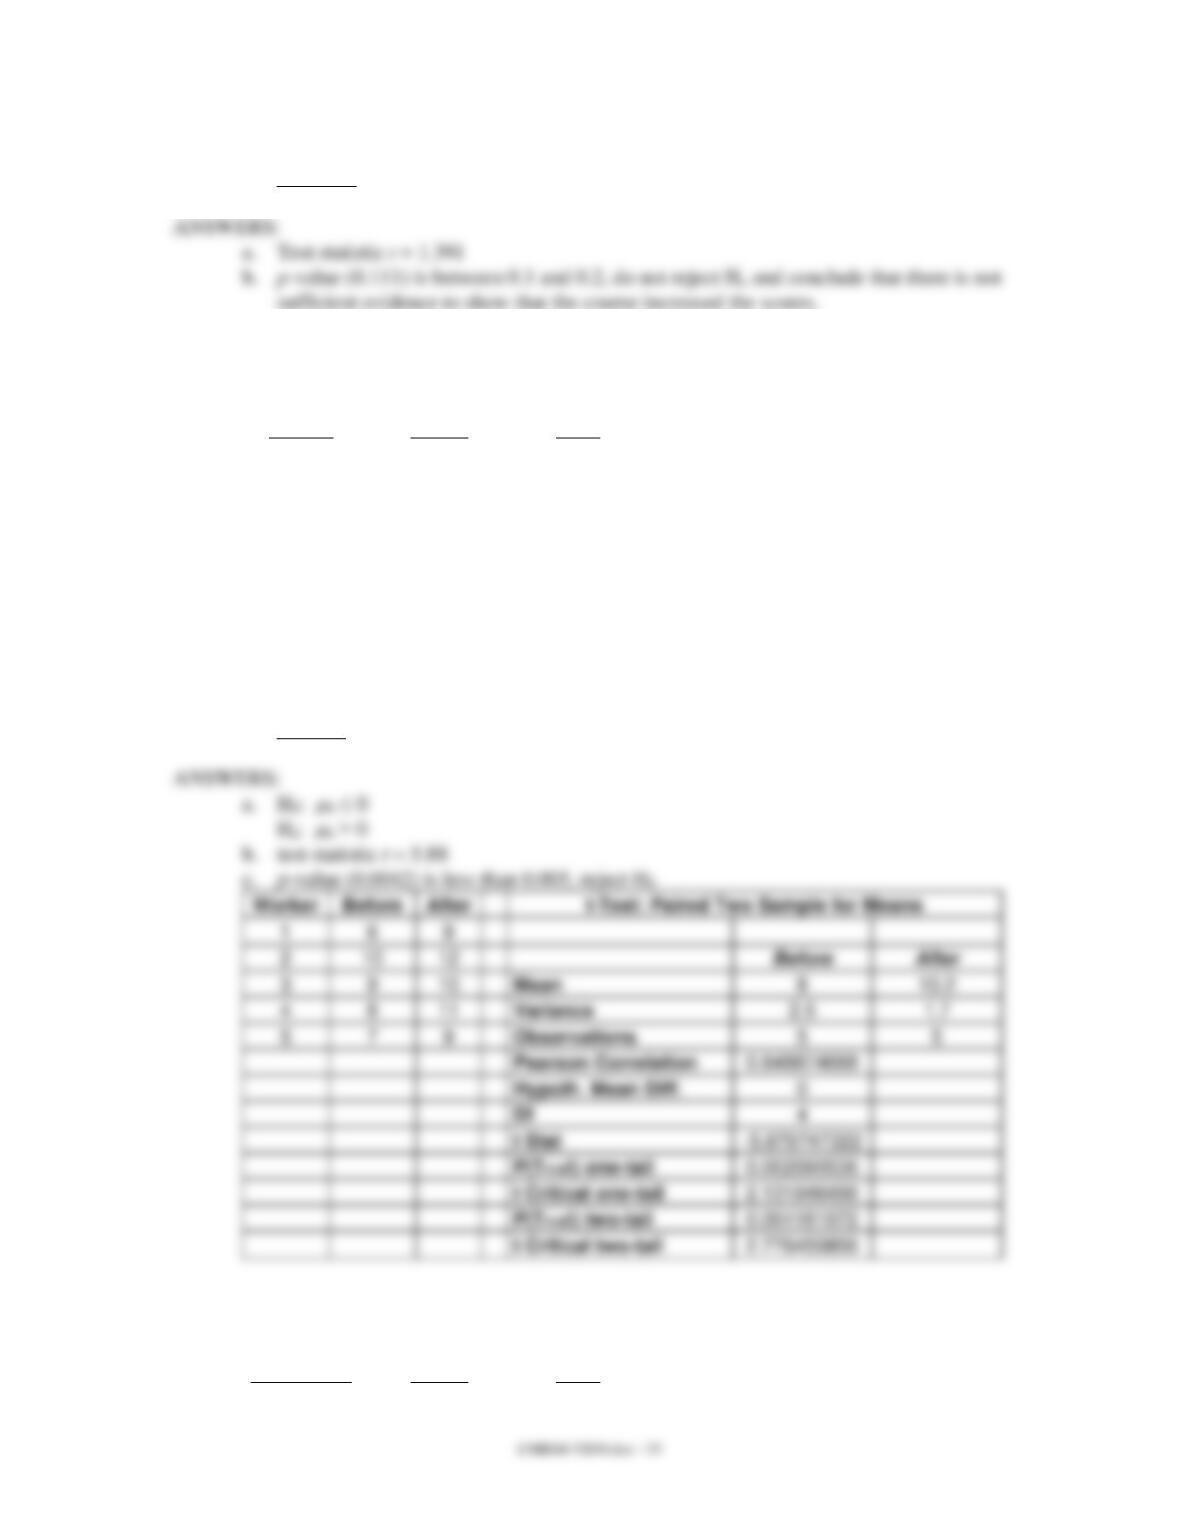
b. At 95% confidence using the p-value approach, test to see if taking the course actually
increased scores on the driving exam.
33. The daily production rates for a sample of factory workers before and after a training
program are shown below. Let d = After – Before.
Worker
Before
After
1
6
9
2
10
12
3
9
10
4
8
11
5
7
9
We want to determine if the training program was effective.
a. Give the hypotheses for this problem.
b. Compute the test statistic.
c. At 95% confidence, test the hypotheses. That is, did the training program actually
increase the production rates?
34. The following data present the number of computer units sold per day by a sample of 6
salespersons before and after a bonus plan was implemented. Let d = before – after.
Salesperson
Before
After
1
3
6
2
7
5
3
6
6
4
8
7
5
7
8
6
9
8
At 95% confidence, test to see if the bonus plan was effective. That is, did the bonus
plan actually increase sales?
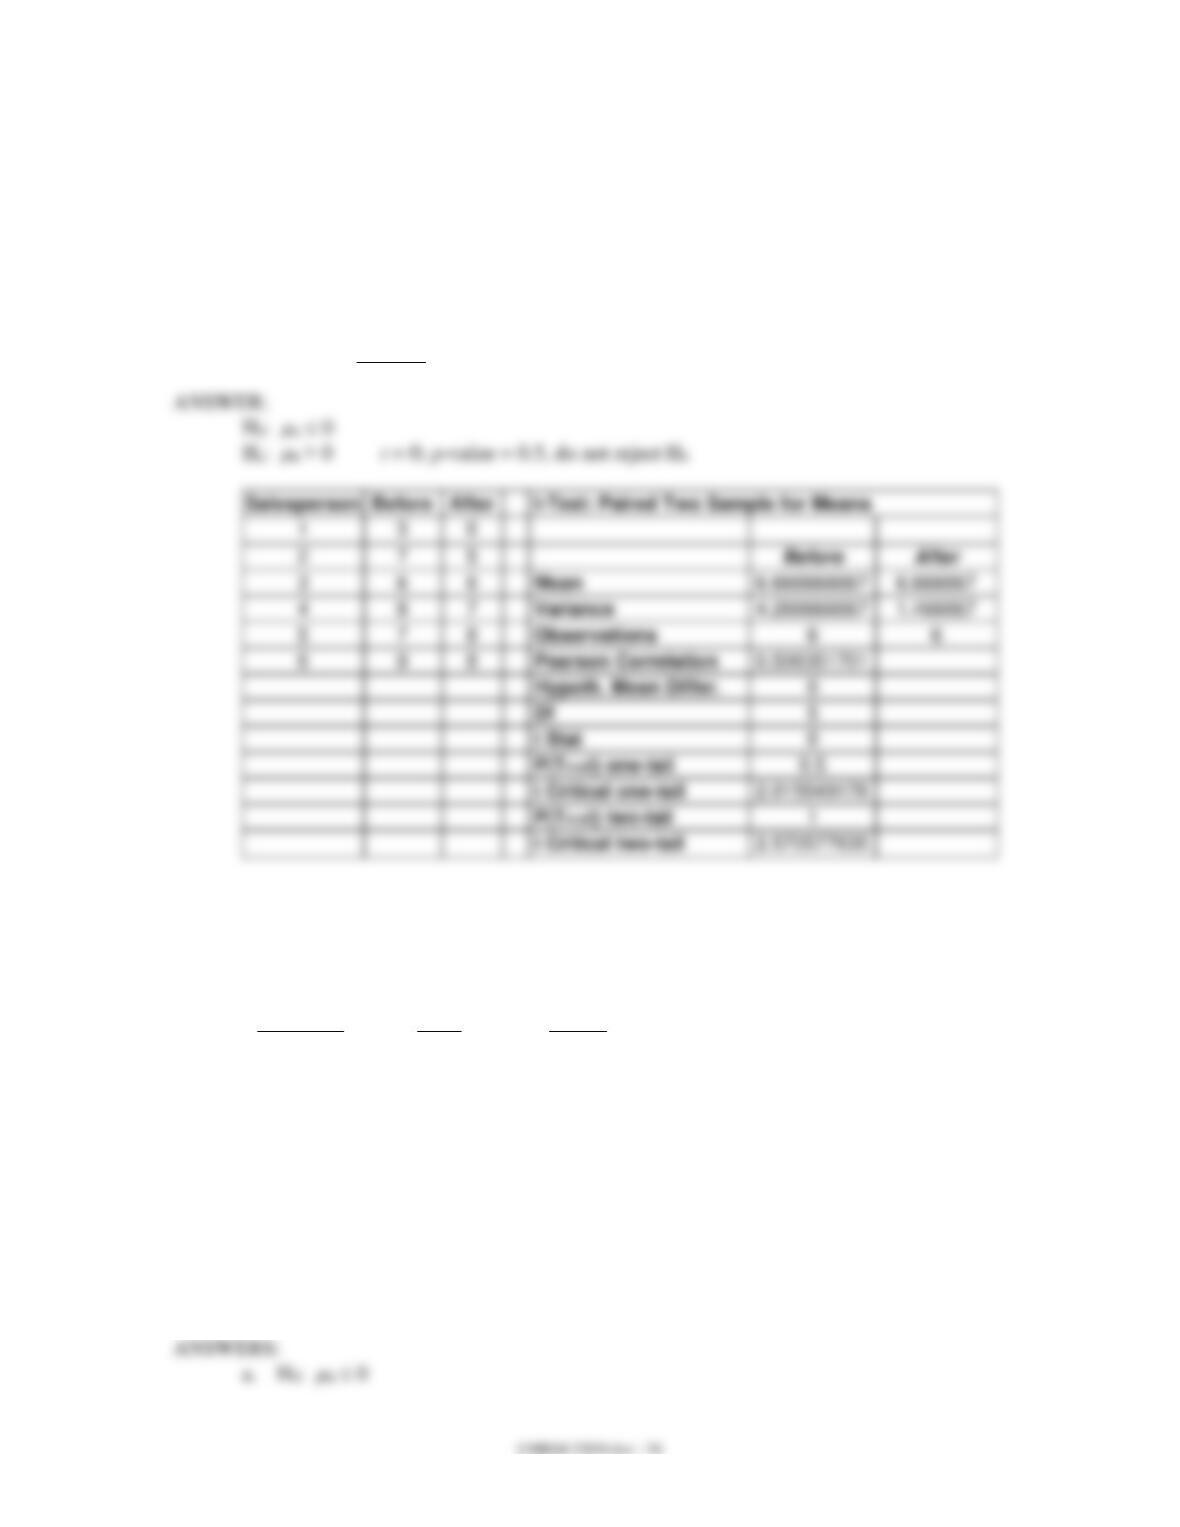
35. A test on world history was given to a group of individuals before and also after a film on
the history of the world was presented. The results are given below. We want to
determine if the film significantly increased the test scores. (For the following matched
samples, let the d = after − before.)
Individual
After
Before
1
92
86
2
86
88
3
89
84
4
90
90
5
93
85
6
88
90
7
97
91
a. Give the hypotheses for this problem.
b. Compute the test statistic.
c. At 95% confidence, test the hypotheses.

36. The following shows the monthly sales in units of six salespersons before and after a
bonus plan was introduced. At 95% confidence, determine whether the bonus plan has
increased sales significantly. (For the following matched samples, let the difference “d”
be: d = after − before.)
Monthly Sales
Salesperson
After
Before
1
94
90
2
82
84
3
90
84
4
76
70
5
79
80
6
85
80
37. Allied Corporation is trying to determine whether to purchase Machine A or B. It has
leased the two machines for a month. A random sample of 5 employees has been taken.
These employees have gone through a training session on both machines. Below you are
given information on their productivity rate on both machines. (Let d = Machine A –
Machine B.)
Productivity Rate
Person
Machine A
Machine B
1
47
52
2
53
58
3
50
47
4
55
60
5
45
53
a. State the null and alternative hypotheses for a two-tailed test.
b. Find the mean and standard deviation for the difference.
c. Compute the test statistic.
d. Test the null hypothesis stated in Part a at the 10% level.
38. A company attempts to evaluate the potential for a new bonus plan by selecting a sample

of 4 salespersons to use the bonus plan for a trial period. The weekly sales volume before
and after implementing the bonus plan is shown below. (For the following matched
samples, let the difference “d” be d = after − before.)
Weekly Sales
Salesperson
Before
After
1
44
48
2
40
48
3
36
38
4
50
44
a. State the hypotheses.
b. Compute the test statistic.
c. Use Alpha = .05 and test to see if the bonus plan will result in an increase in the mean
weekly sales.
39. The following information was obtained from matched samples regarding the
productivity of four individuals using two different methods of production.
Individual
Method 1
Method 2
1
6
8
2
9
5
3
7
6
4
7
5
5
8
6
6
9
5
7
6
3
Let d = Method 1 − Method 2. Is there a significant difference between the productivity
of the two methods? Let = 0.05.
40. Information regarding the ACT scores of samples of students in three different majors is
given below.
Major
Management
Finance
Accounting
28
22
29
26
23
27
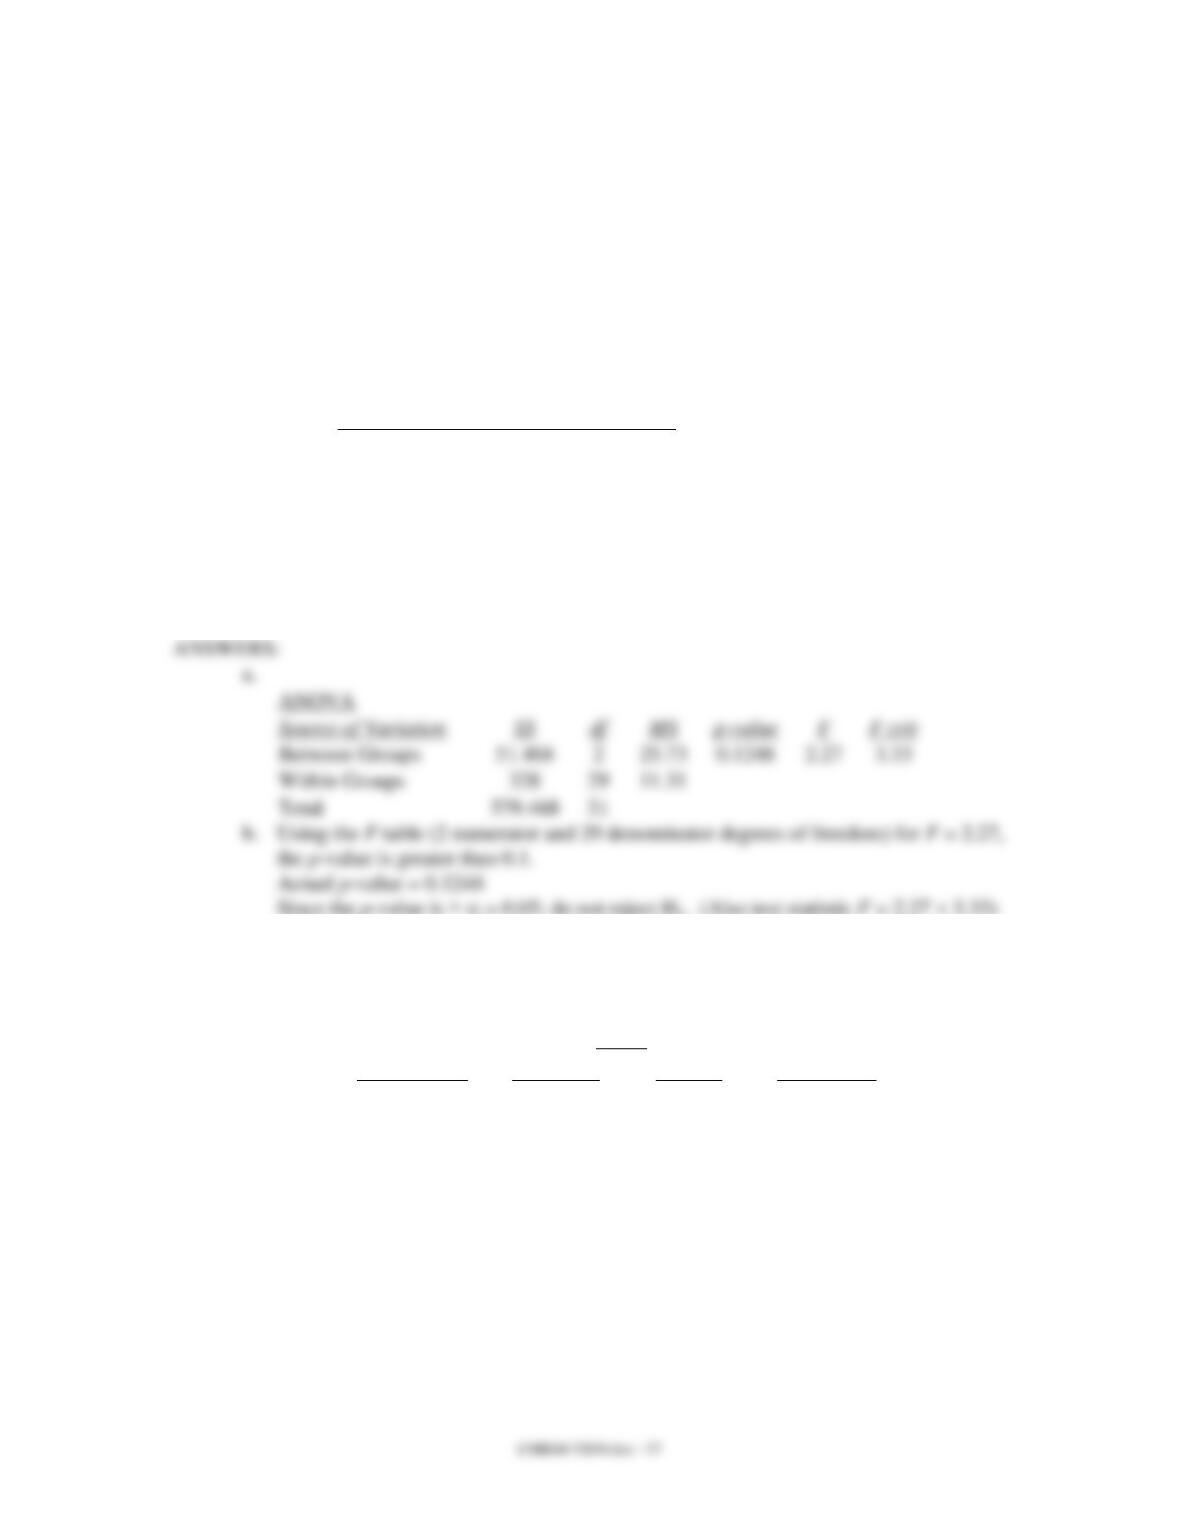
25
24
26
27
22
28
21
24
25
19
26
26
27
27
28
17
29
20
17
28
20
23
24
28
28
29
Sums
230
225
338
Means
23
25
26
Variances
18
6.75
9.33
a. Set up the ANOVA table for this problem.
b. At 95% confidence test to determine whether there is a significant difference in the
means of the three populations.
Between Groups
Within Groups
Total
41. Information regarding the ACT scores of samples of students in four different majors is
given below.
Major
Management
Marketing
Finance
Accounting
29
22
29
28
27
22
27
26
21
25
27
25
28
26
28
20
22
27
24
21
28
20
20
19
28
23
20
27
23
25
30
24
28
27
29
21
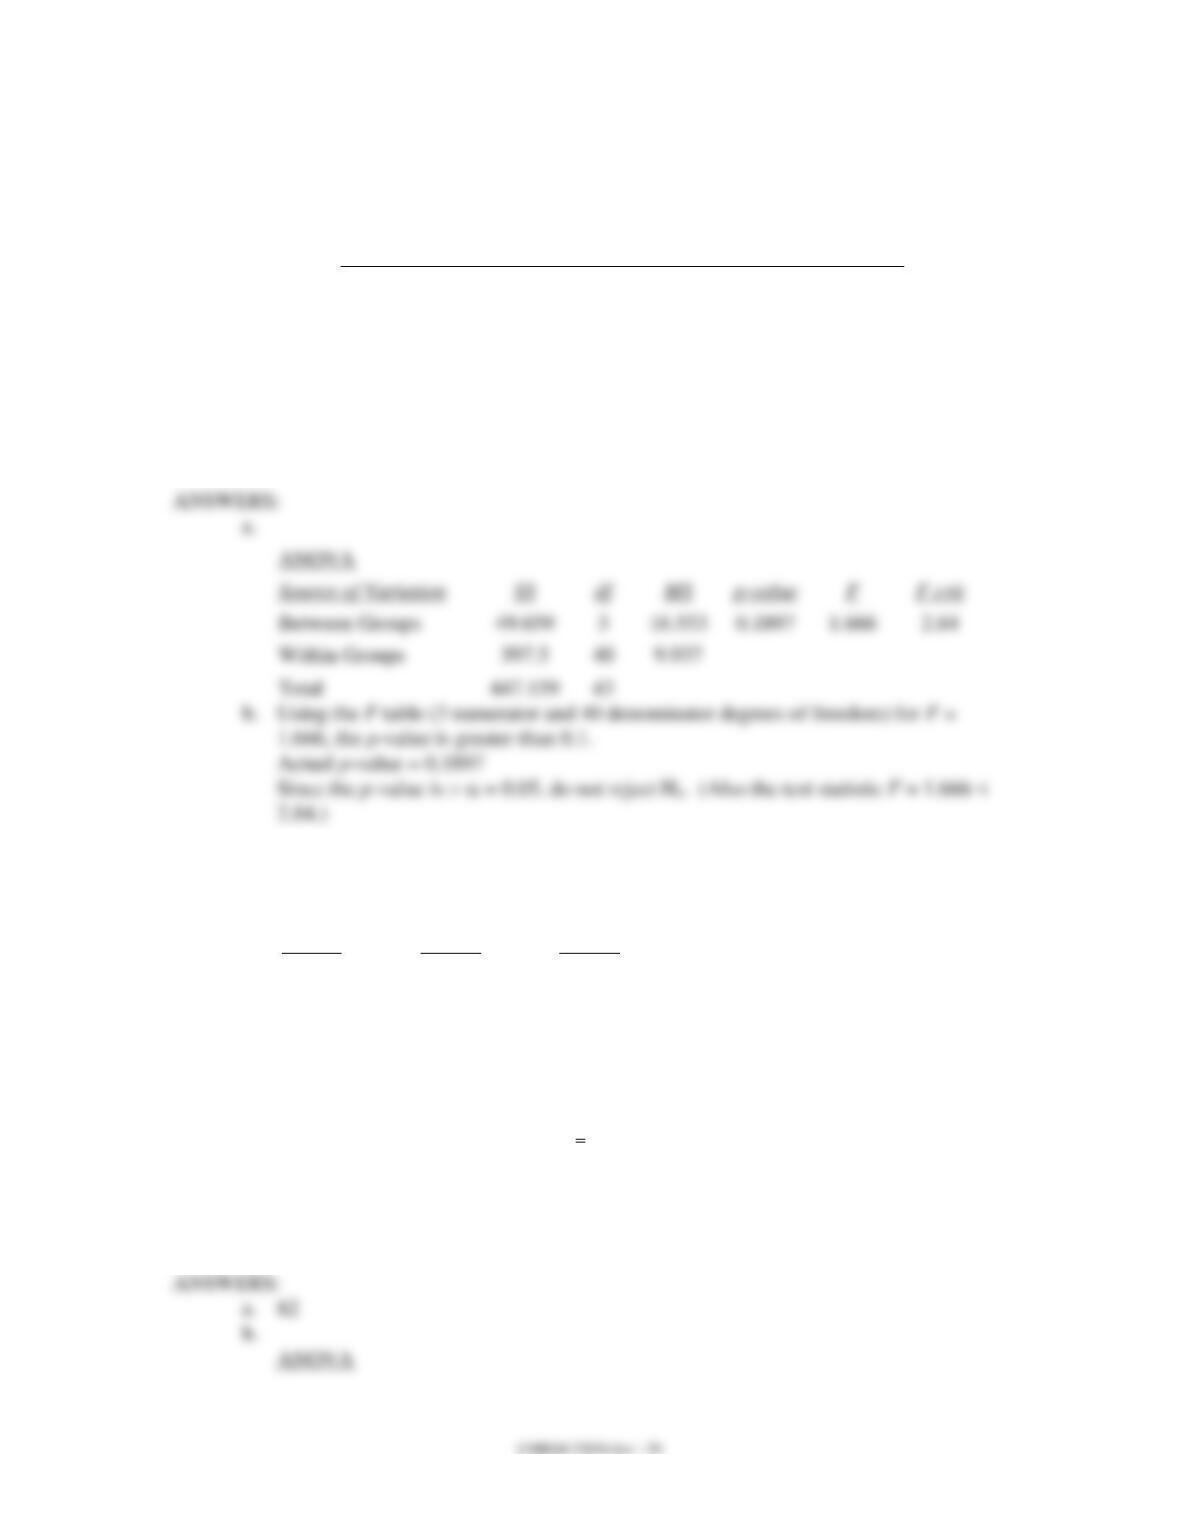
24
28
23
29
27
31
27
24
Sum
318
245
234
312
Mean
26.50
24.50
26.00
24.00
Variance
10.09
6.94
14.50
9.00
a. Set up the ANOVA table for this problem.
b. At 95% confidence, test to determine whether there is a significant difference in the
means of the three populations.
Between Groups
Within Groups
Total
42. Guitars R. US has three stores located in three different areas. Random samples of the
sales of the three stores (in $1000) are shown below.
Store 1
Store 2
Store 3
80
85
79
75
86
85
76
81
88
89
80
80
a. Compute the overall sample mean
x
.
b. At 95% confidence, test to see if there is a significant difference in the average sales
of the three stores. Set up the complete ANOVA table. Please note that the sample
sizes are not equal.
Between Groups
Within Groups
Total
43. In a completely randomized experimental design, 18 experimental units were used for the
first treatment, 10 experimental units for the second treatment, and 15 experimental units
for the third treatment. Part of the ANOVA table for this experiment is shown below.
ANOVA
Source of Variation
SS
df
MS
F
Between Groups
?
?
?
3
Within Groups
?
?
6
Total
?
?
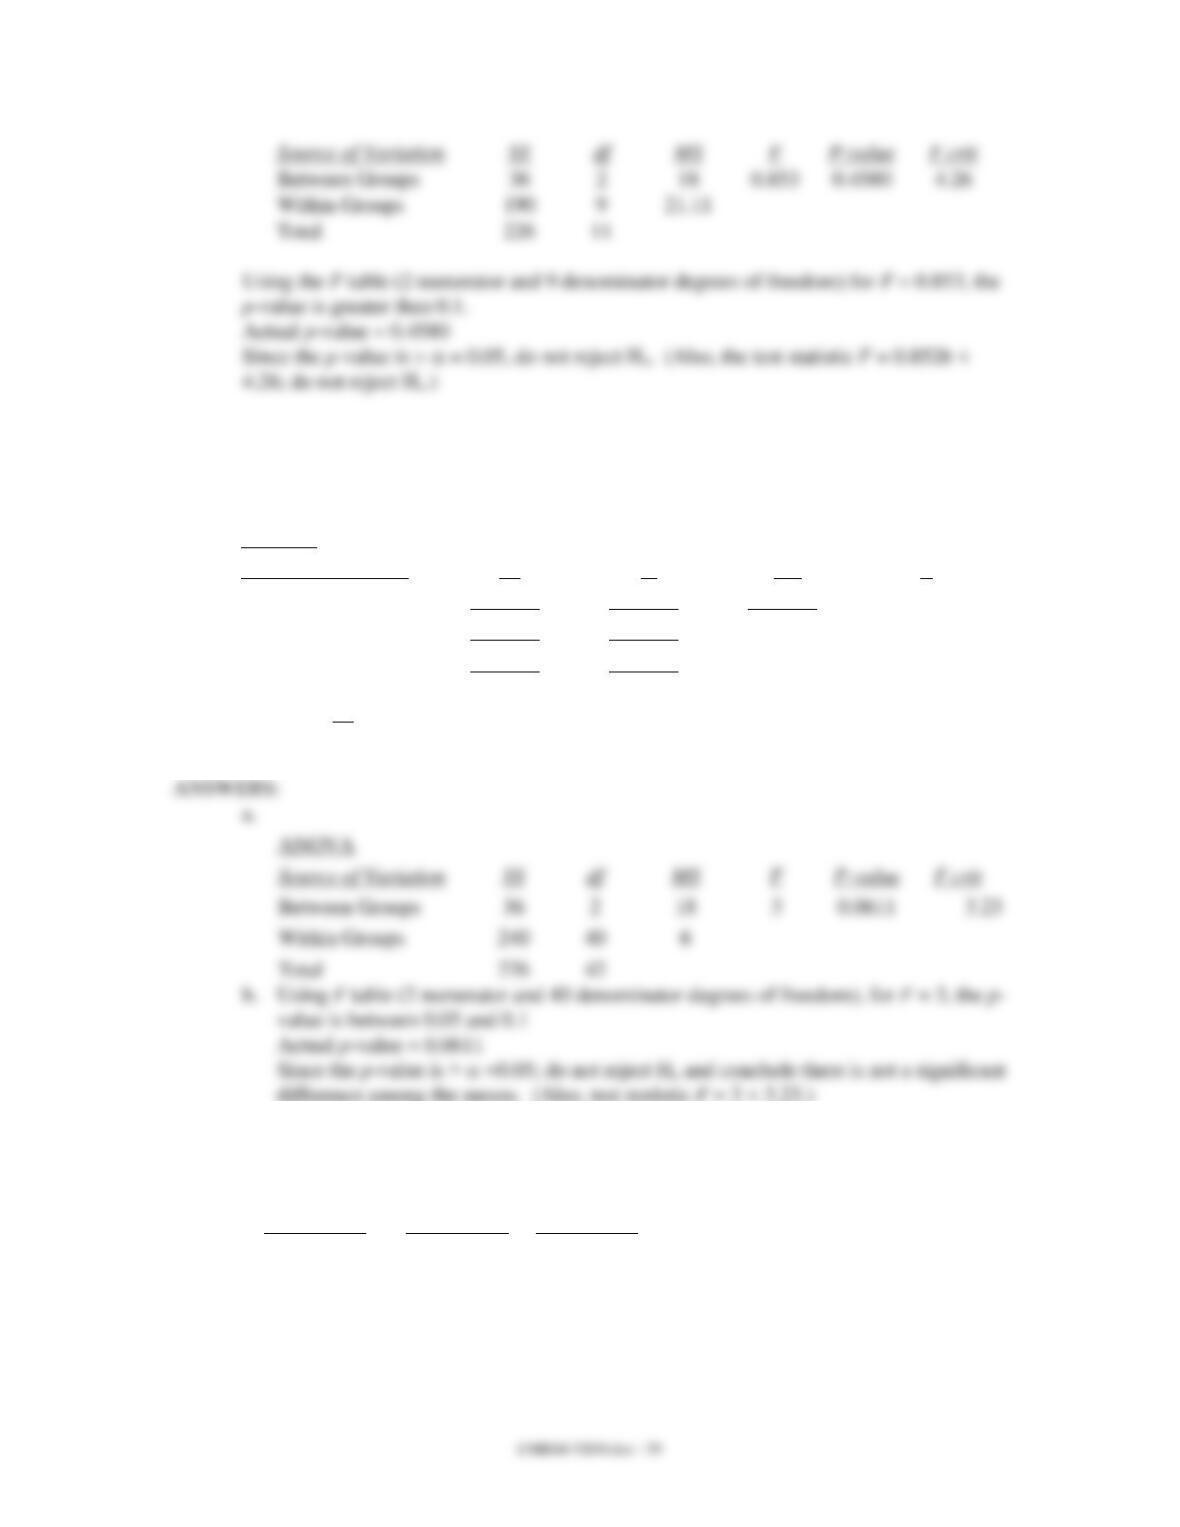
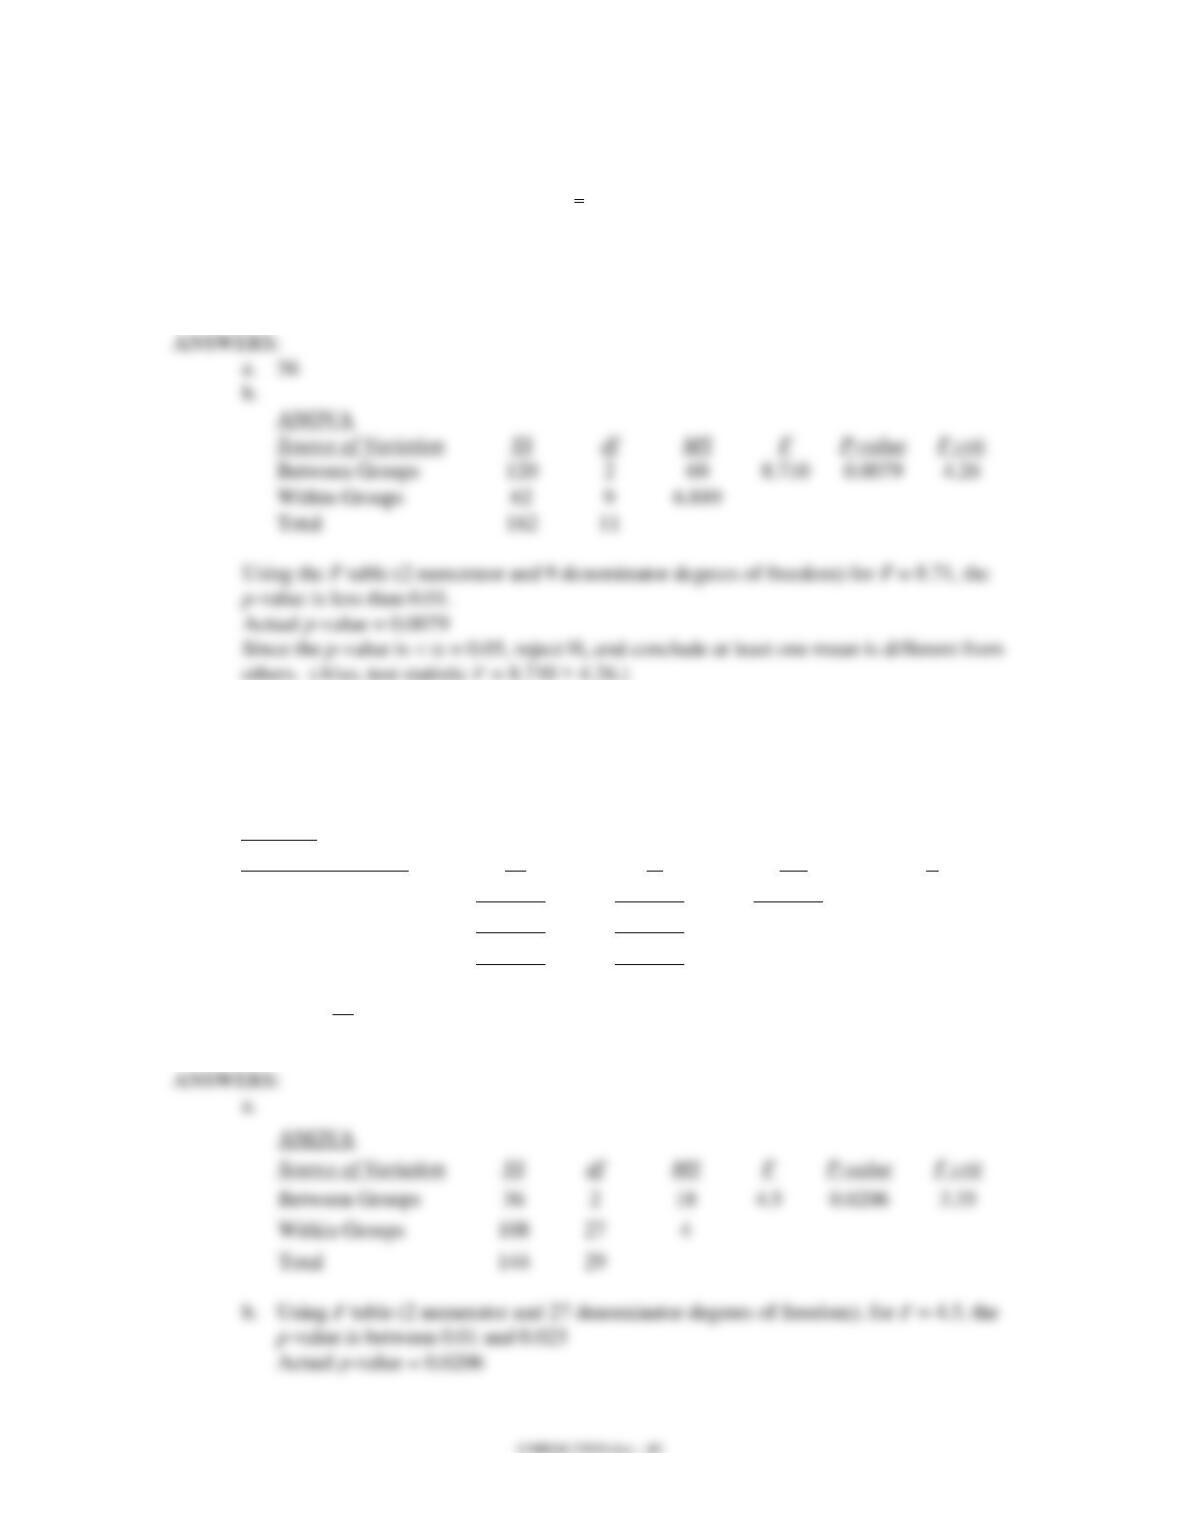
a. Fill in all the blanks in the above ANOVA table.
b. At 95% confidence, test to see if there is a significant difference among the means.
ANOVA
Source of Variation
Between Groups
3.23
Within Groups
Total
44. Random samples were selected from three populations. The data obtained are shown
below.
Treatment 1
Treatment 2
Treatment 3
37
43
28
33
39
32
36
35
33
38
38
40
a. Compute the overall sample mean
x
.
b. At 95% confidence, test to see if there is a significant difference in the means of the
three populations. Show the complete ANOVA table. Please note that the sample
sizes are not equal.
Source of Variation
Between Groups
Within Groups
Total
45. In a completely randomized experimental design, 7 experimental units were used for the
first treatment, 9 experimental units for the second treatment, and 14 experimental units
for the third treatment. Part of the ANOVA table for this experiment is shown below.
ANOVA
Source of Variation
SS
df
MS
F
Between Groups
?
?
?
4.5
Within Groups
?
?
4
Total
?
?
a. Fill in all the blanks in the above ANOVA table.
b. At 95% confidence, test to see if there is a significant difference among the means.
ANOVA
Source of Variation
Between Groups
Within Groups
Total