46. Random samples were selected from three populations. The data obtained are shown
below.
Treatment 1
Treatment 2
Treatment 3
45
31
39
41
34
37
37
35
38
40
40
42
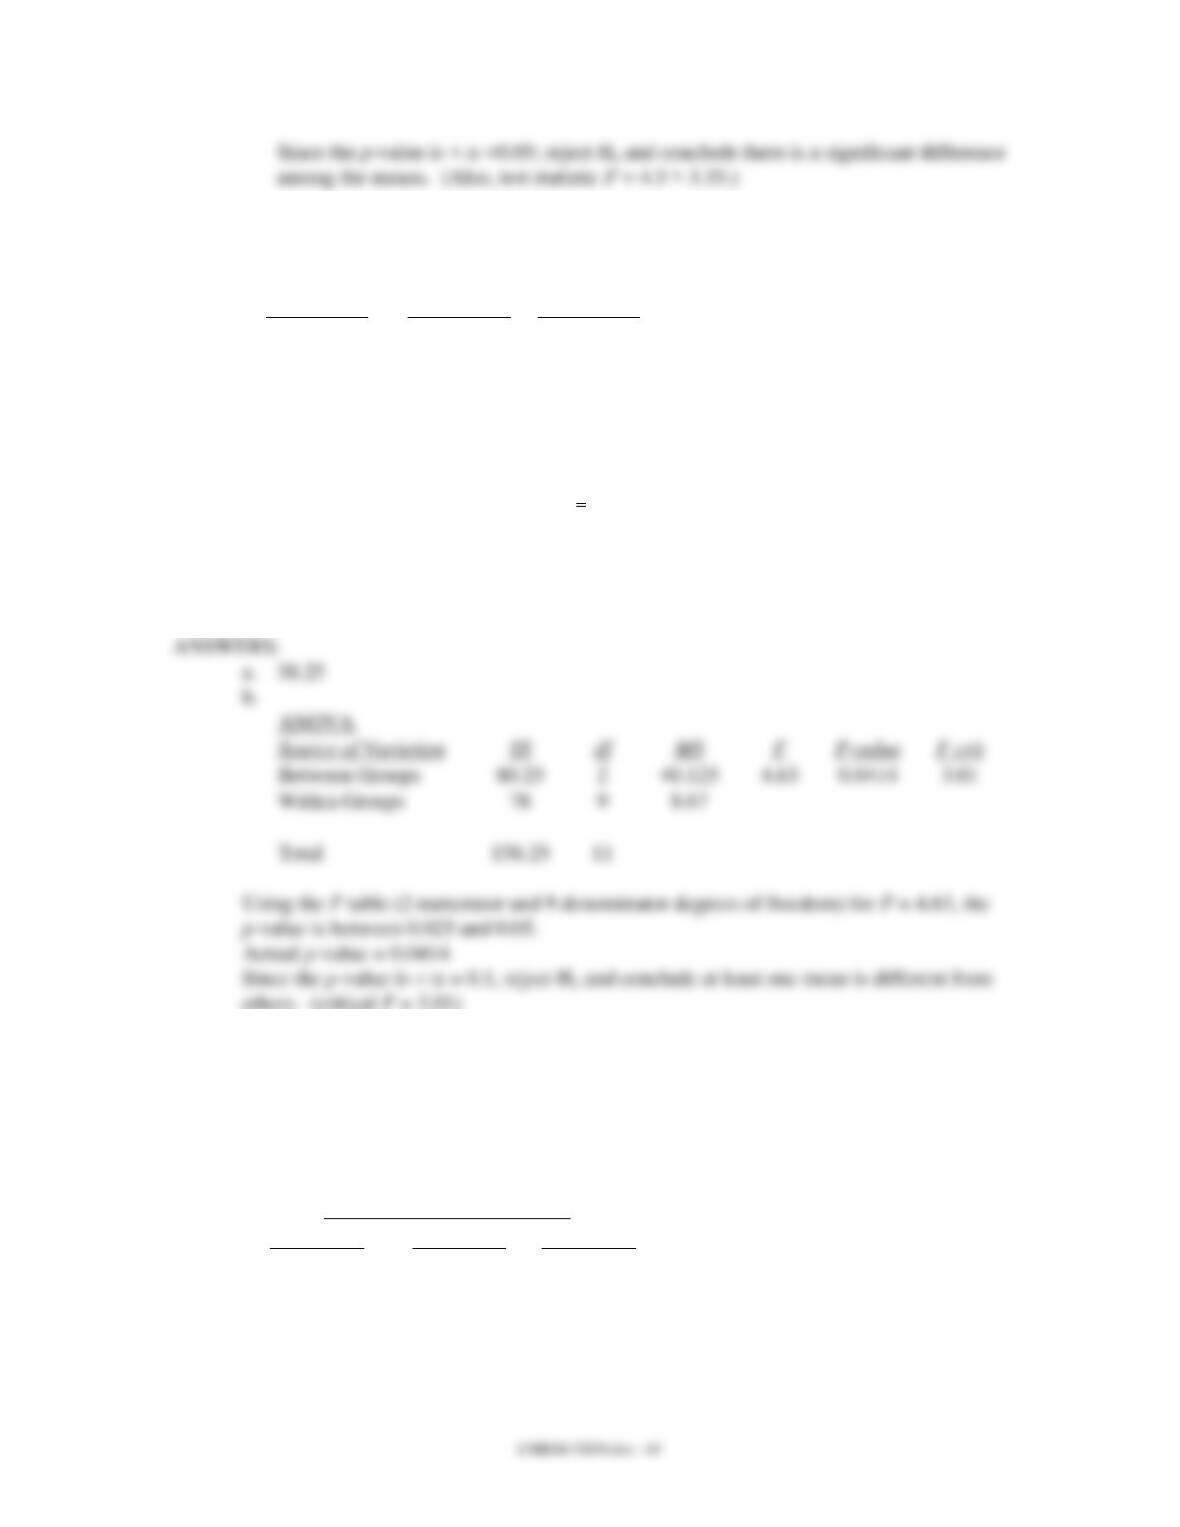
a. Compute the overall sample mean
x
.
b. At 90% confidence, test to see if there is a significant difference in the means of the
three populations. Show the complete ANOVA table. Please note that the sample
sizes are not equal.
4.63
11
47. The manager of Roth Corporation wants to determine whether or not the type of work
schedule for her employees has any effect on their productivity. She has selected 15
production employees at random and then randomly assigned 5 employees to each of the
3 proposed work schedules. The following table shows the units of production (per
week) under each of the work schedules.
Work Schedule (Treatments)
Schedule 1
Schedule 2
Schedule 3
50
60
75
60
65
75
70
65
55
40
58
40
45
57
55
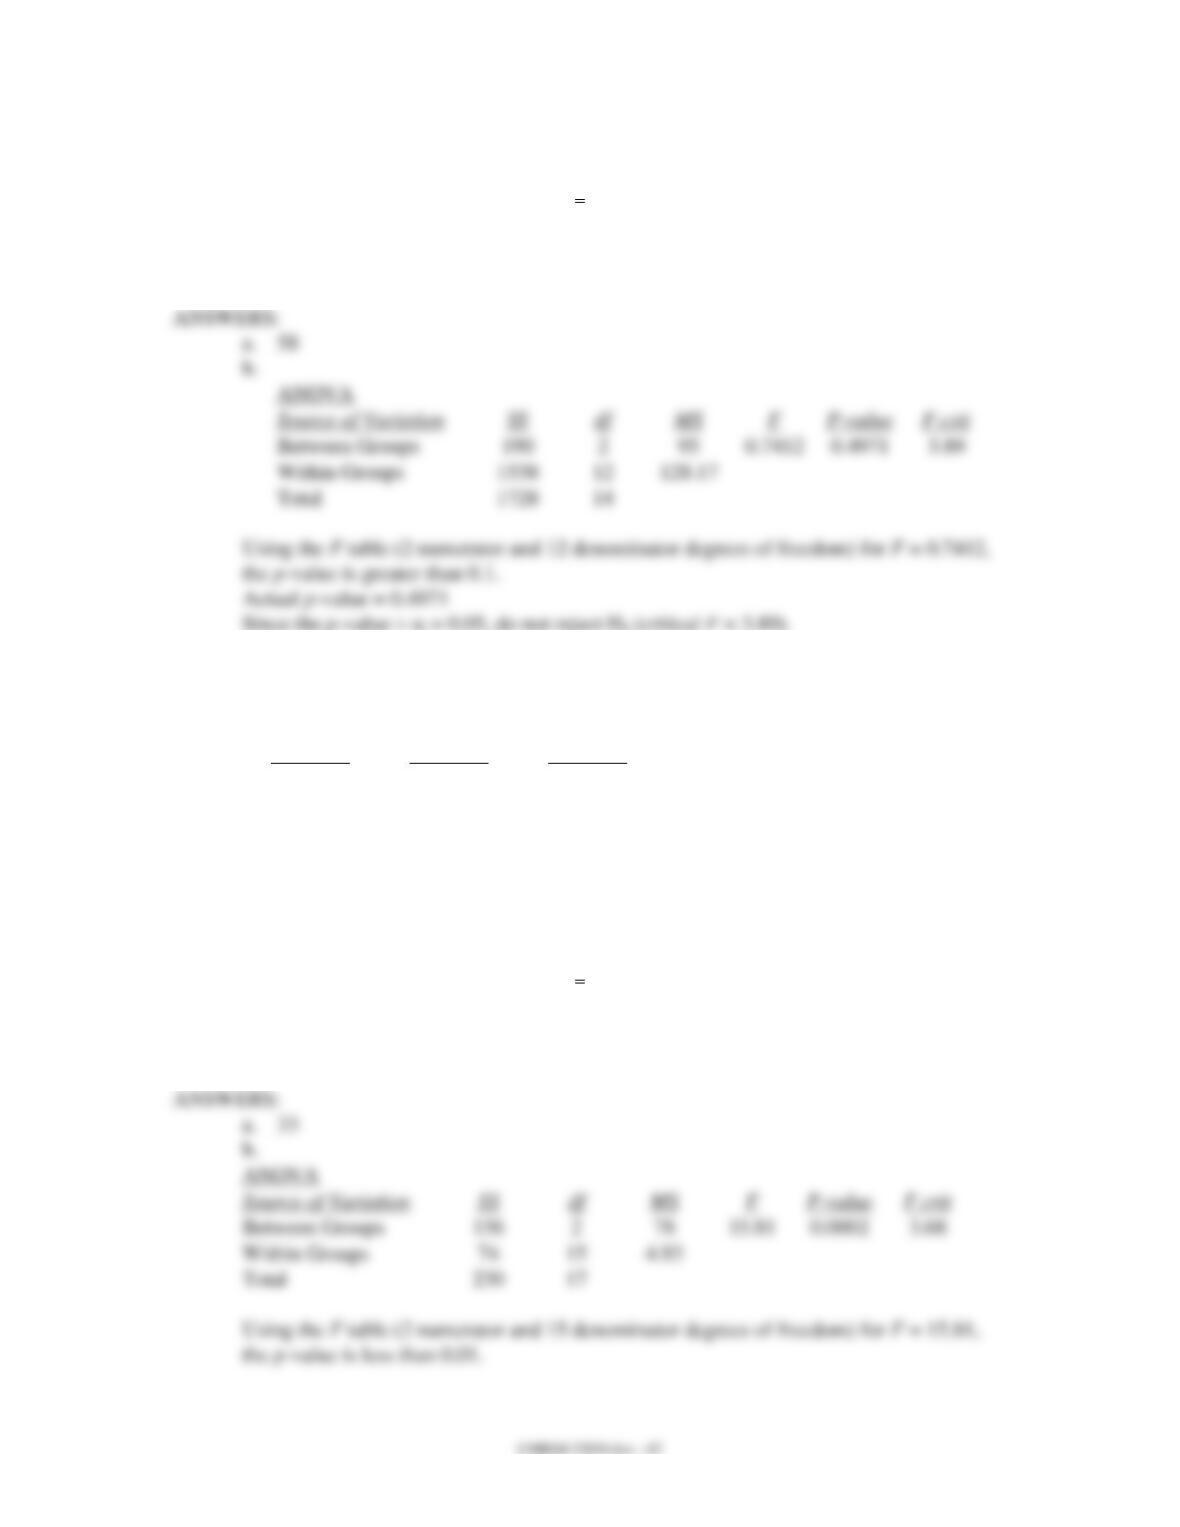
a. Compute the overall sample mean
x
.
b. At 95% confidence, determine if there is a significant difference in the mean weekly
units of production for the three types of work schedules.
48. Six observations were selected from each of three populations. The data obtained is
shown below.
Sample 1
Sample 2
Sample 3
31
31
37
28
32
36
34
33
39
32
30
40
26
32
35
29
34
35
a. Compute the overall sample mean
x
.
b. Test at the = 0.05 level to determine if there is a significant difference in the means
of the three populations.
49. The test scores for selected samples of statistics students who took the course from three
different instructors are shown below.
Instructor A
Instructor B
Instructor C
81
90
85
62
55
90
82
84
90
87
91
95
73
85
80
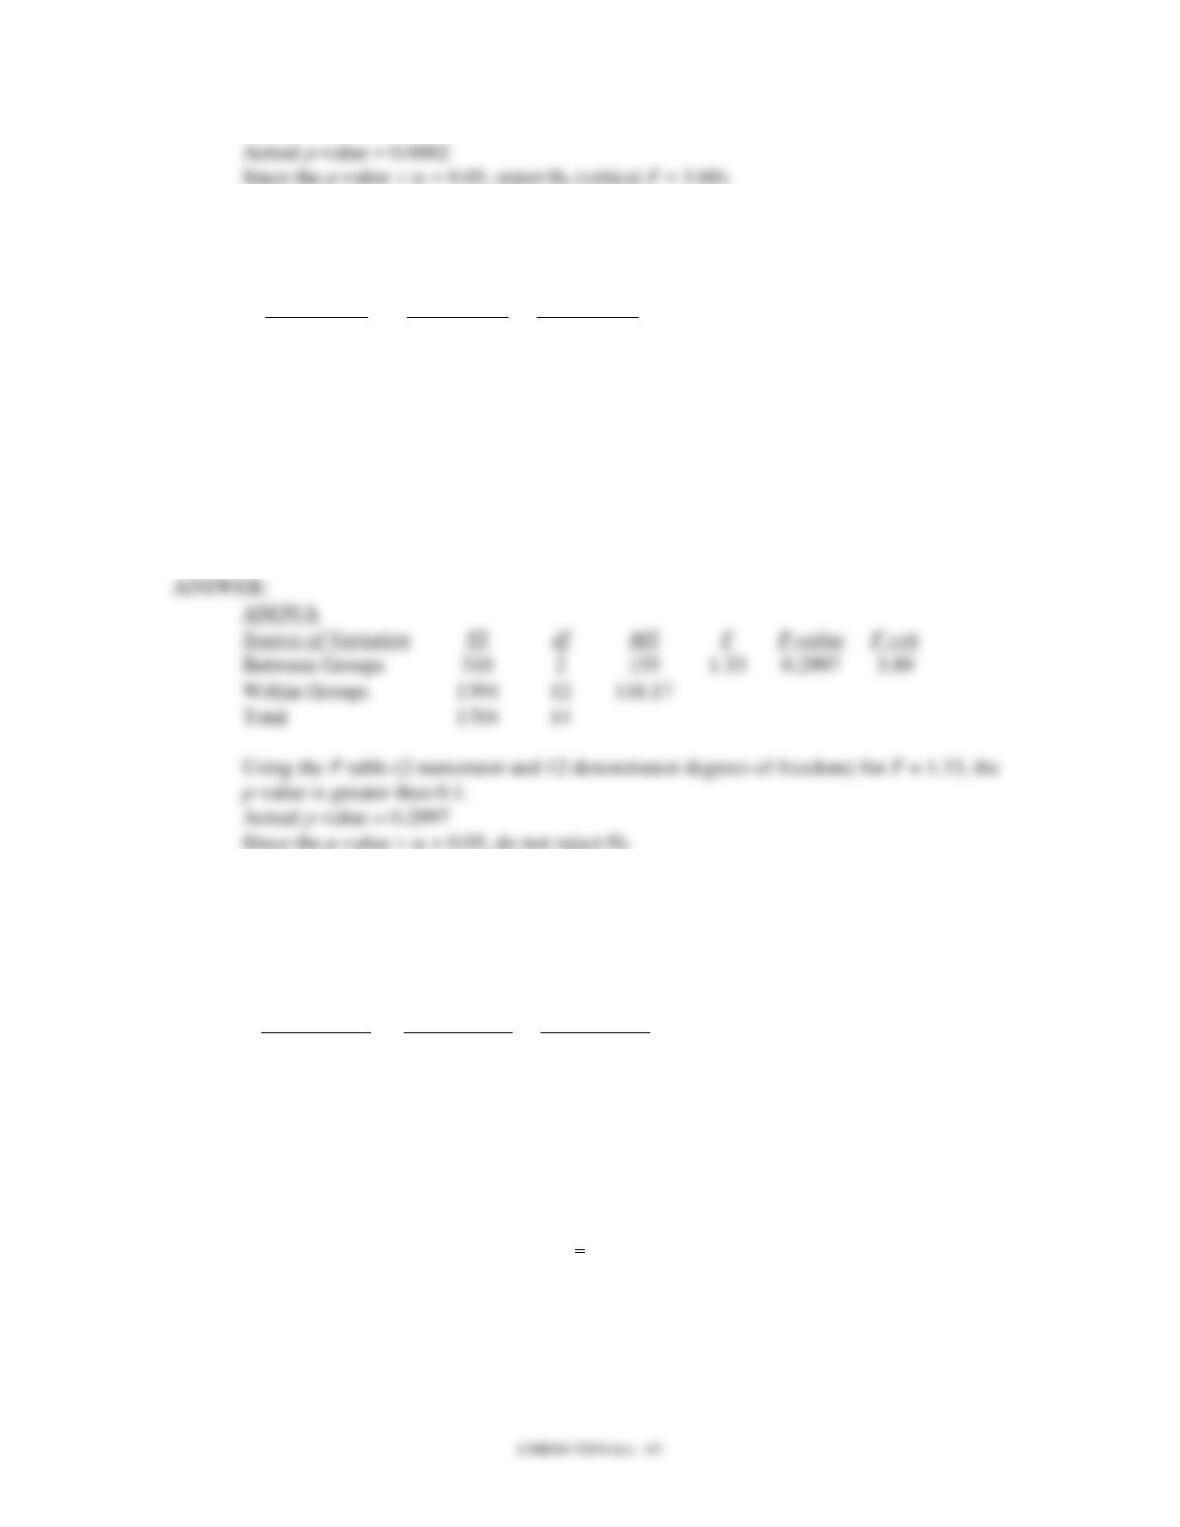
At = 0.05, test to see if there is a significant difference among the averages of the three
groups. Show the complete ANOVA table.
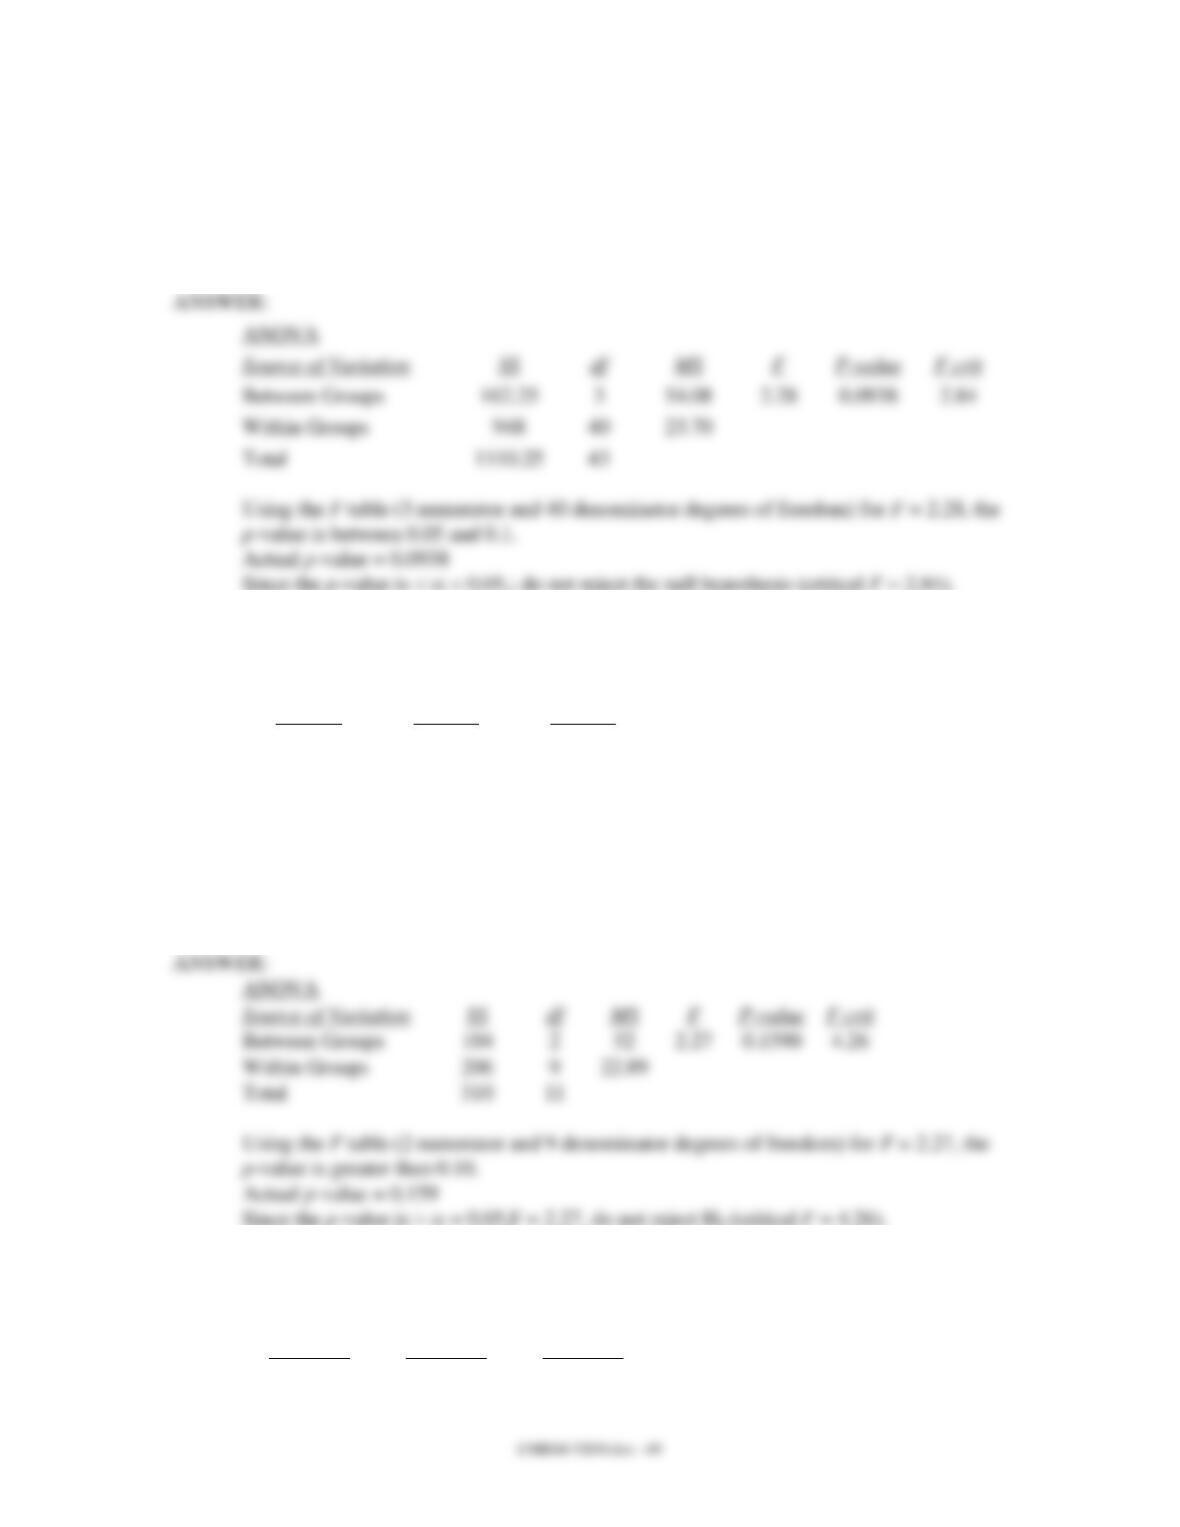
1.33
0.2997
3.89
116.17
50. Three universities administer the same comprehensive examination to the recipients of
MS degrees in psychology. From each institution, a random sample of MS recipients was
selected, and these recipients were then given the exam. The following table shows the
scores of the students from each university.
University A
University B
University C
89
60
75
95
95
70
75
89
90
92
80
78
99
66
77
a. Compute the overall sample mean
x
.
b. At = 0.05, test to see if there is any significant difference in the average scores of
the students from the three universities. Set up the complete ANOVA table (Note
that the sample sizes are not equal.)
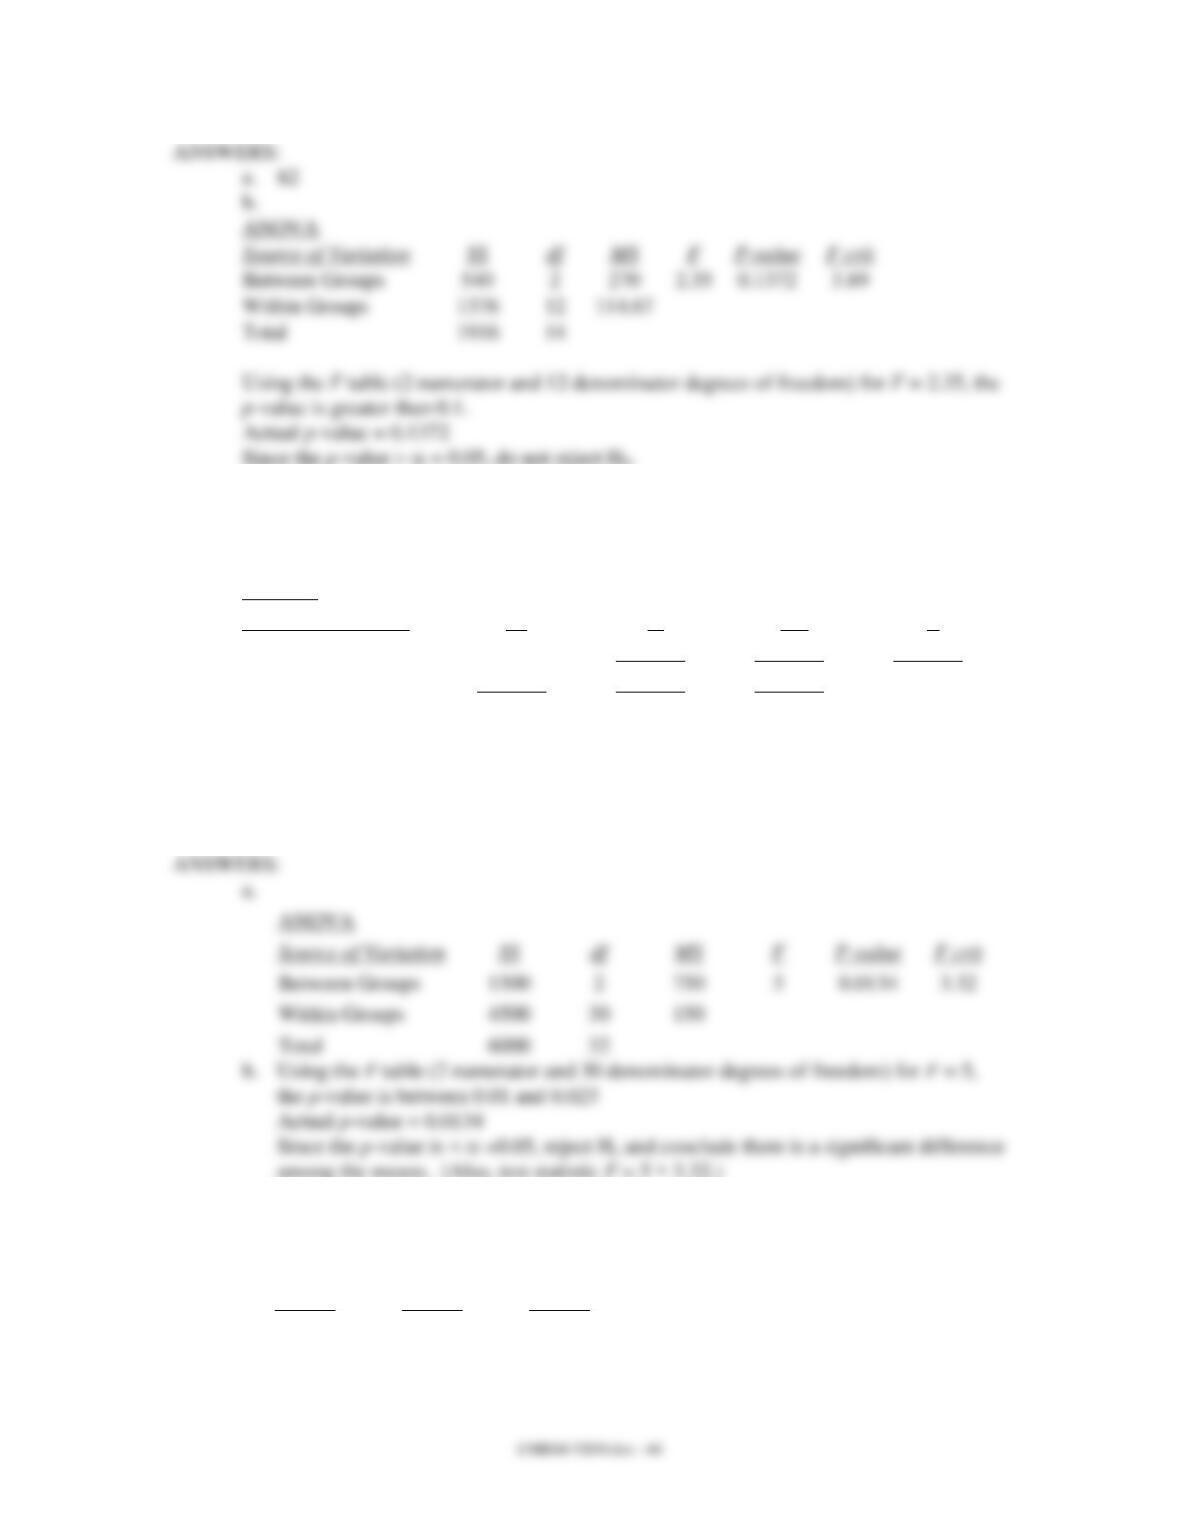
Within Groups
51. In a completely randomized experimental design, 11 experimental units were used for
each of the 3 treatments. Part of the ANOVA table is shown below.
ANOVA
Source of Variation
SS
df
MS
F
Between Groups
1500
?
?
?
Within Groups
?
?
?
Total
6000
32
a. Fill in the blanks in the above ANOVA table.
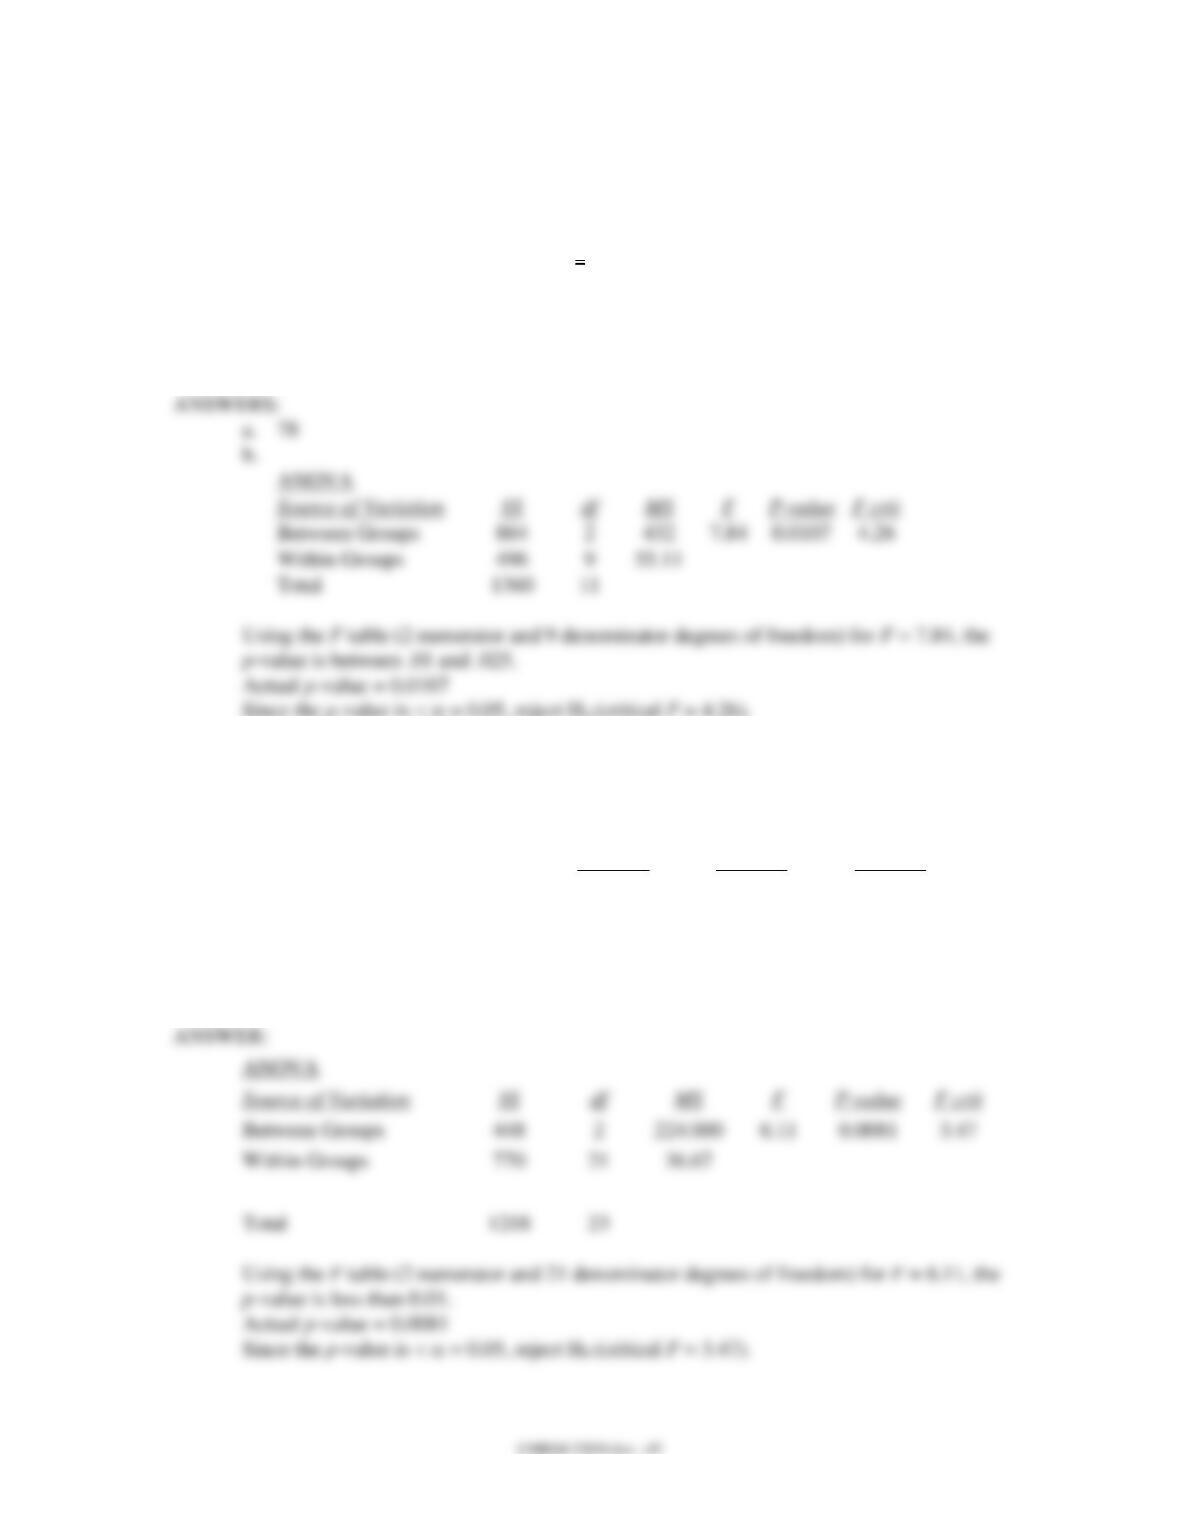
b. At 95% confidence, test to determine whether or not the means of the 3 populations
are equal.
Between Groups
750
Total
52. Wendy, Inc. has three stores located in three different areas. Random samples of the
sales of the three stores (in $1,000) are shown below.
Store 1
Store 2
Store 3
93
76
85
85
74
67
88
60
64
82
70
92
a. Compute the overall sample mean
x
.
b. At 95% confidence, test to see if there is a significant difference in the average sales
of the three stores. Note that the sample sizes are not equal. Show your complete
work and the ANOVA table.
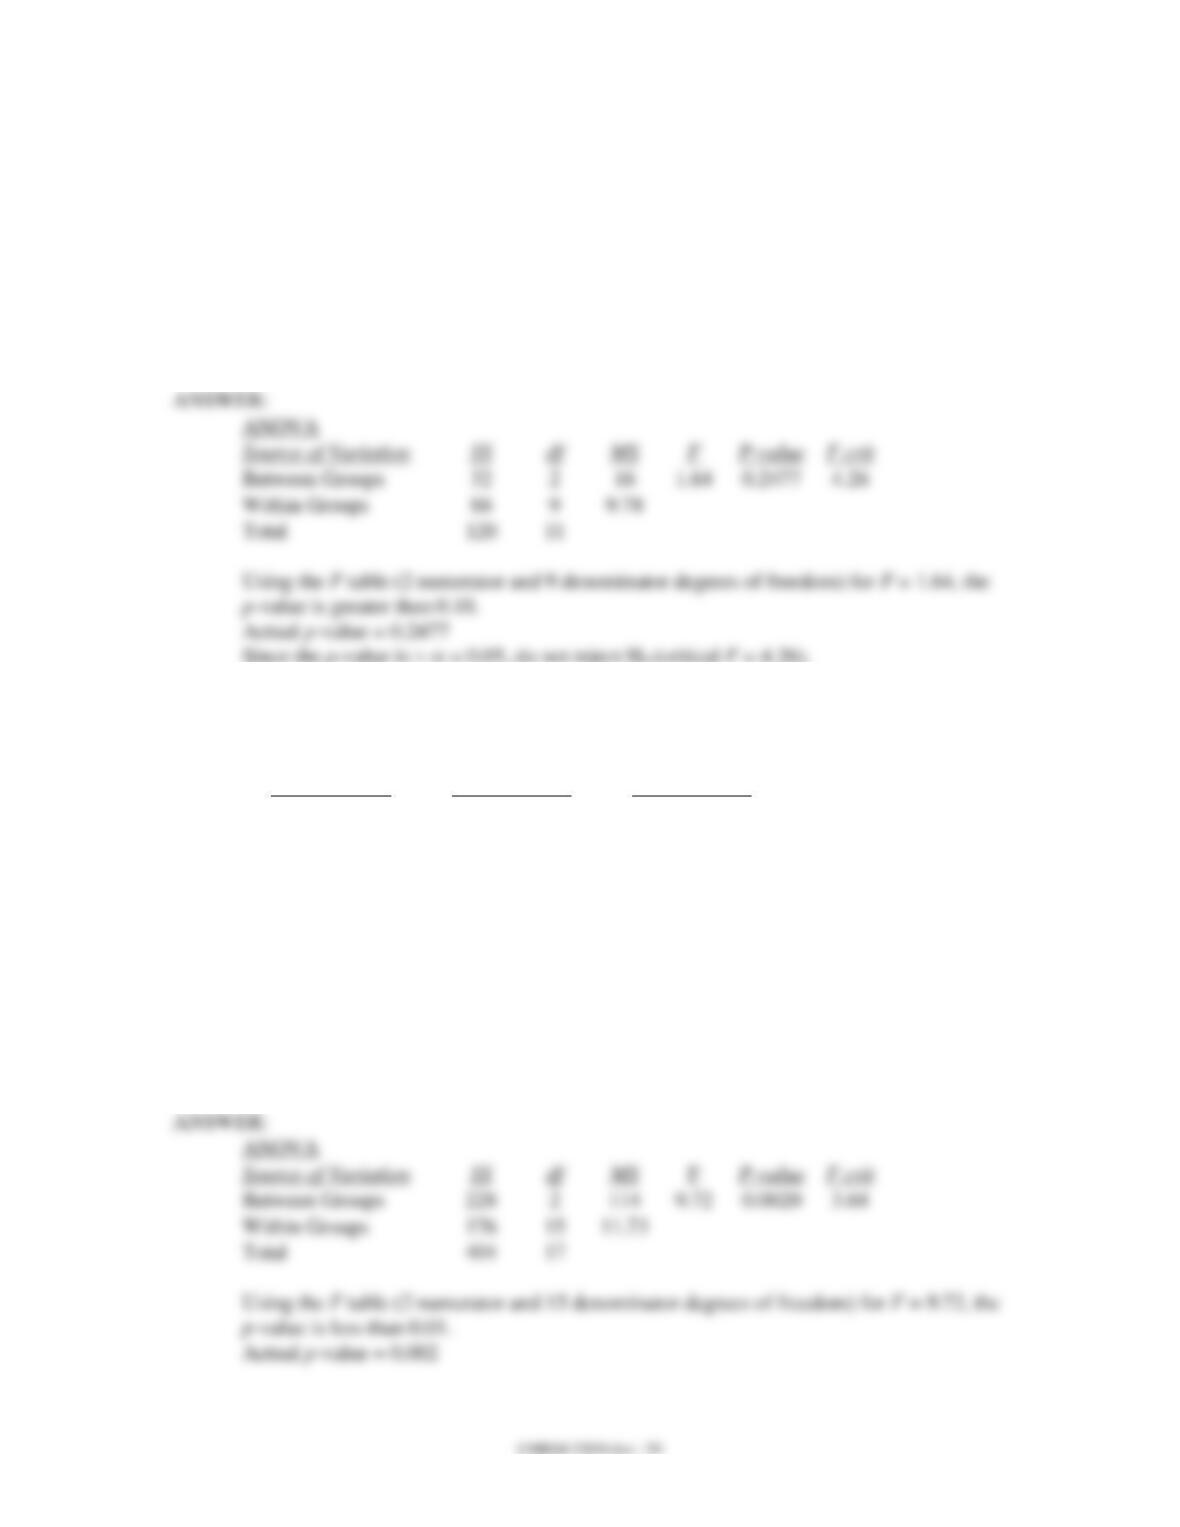
0.0107
53. In order to compare the life expectancies of three different brands of printers, eight
printers of each brand were randomly selected. Information regarding the three brands is
shown below.
Brand A
Brand B
Brand C
Average life (in months)
62
52
60
Sample variance
36
25
49
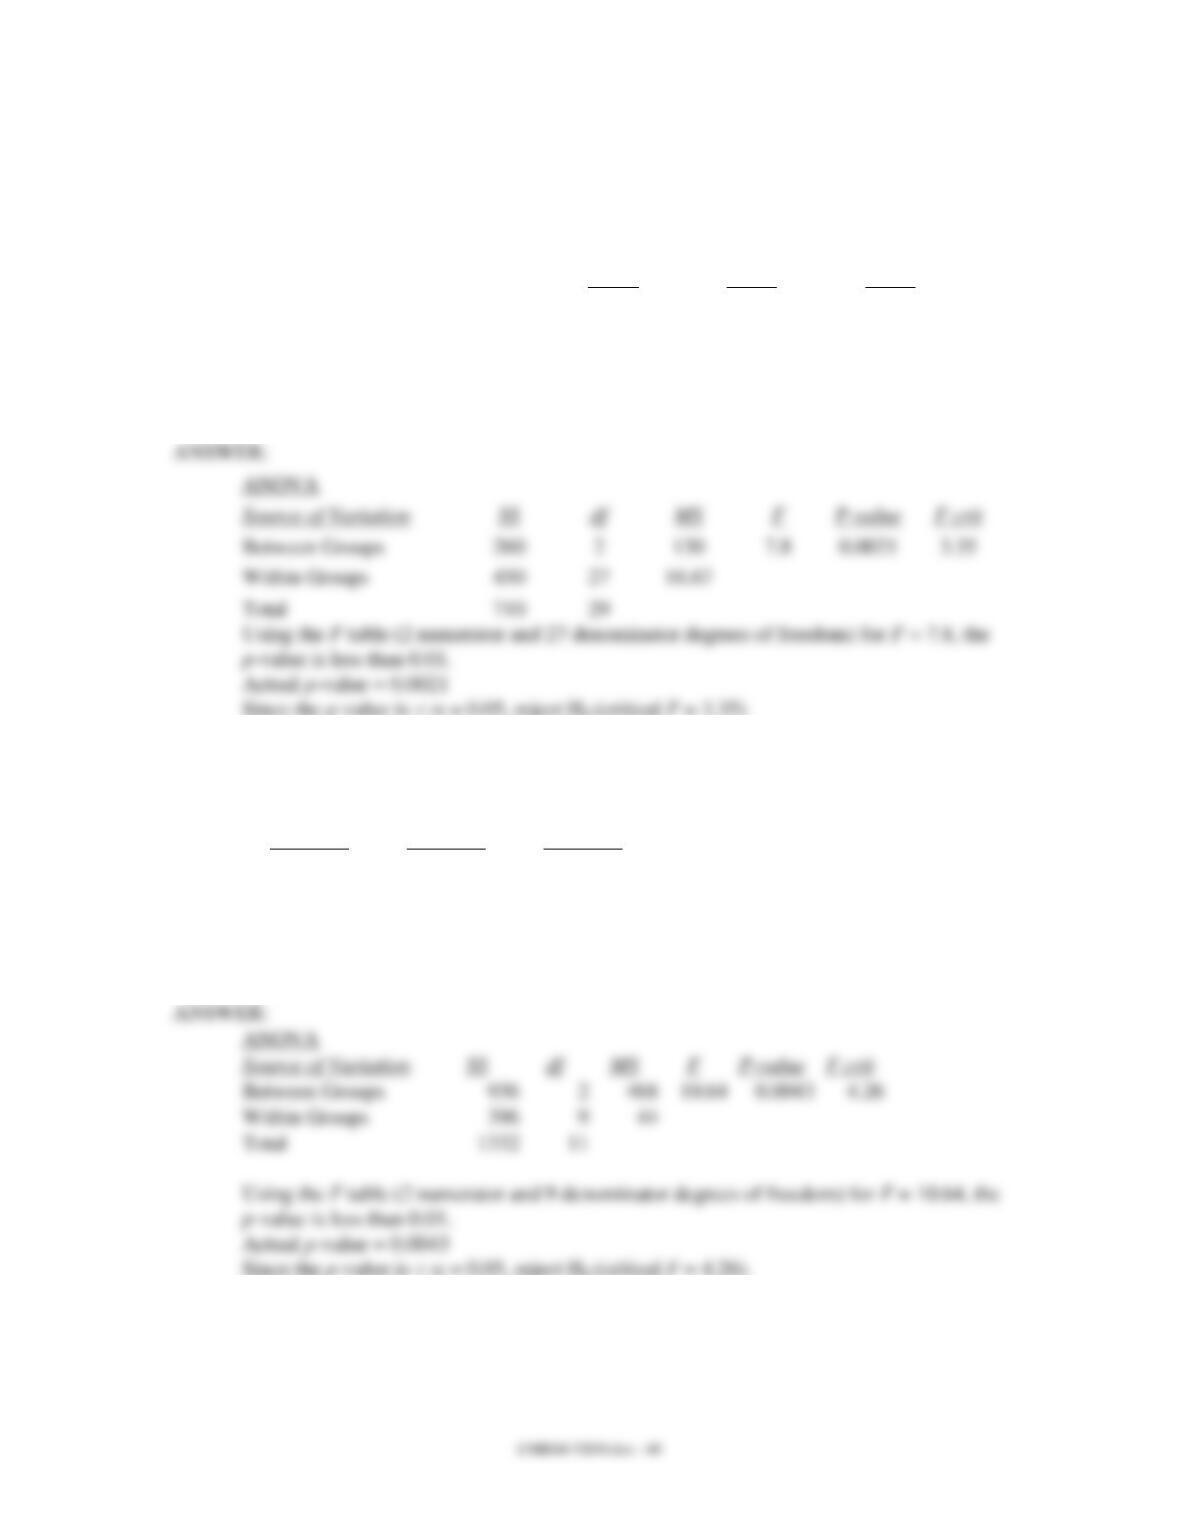
Use the above data and test to see if the mean life expectancies of the three brands are the
same. Let = 0.05. Show the complete ANOVA table.
224.000
21
23
54. Three different models of automobiles (A, B, and C) were compared for gasoline
consumption. For each model of car, ten cars were randomly selected and subjected to
standard driving procedures. The average miles/gallon obtained for each model of car
and sample standard deviations are shown below.
Car A
Car B
Car C
Average Mile/Gallon
42
49
44
Sample Standard Deviation
4
5
3
Use the above data and test to see if the mean gasoline consumption for all three models
of cars is the same. Let = 0.05. Show the complete ANOVA table.
260
130
450
55. At = 0.05, test to determine if the means of the three populations (from which the
following samples are selected) are equal. Show the complete ANOVA table.
Sample 1
Sample 2
Sample 3
60
84
60
78
78
57
72
93
69
66
81
66
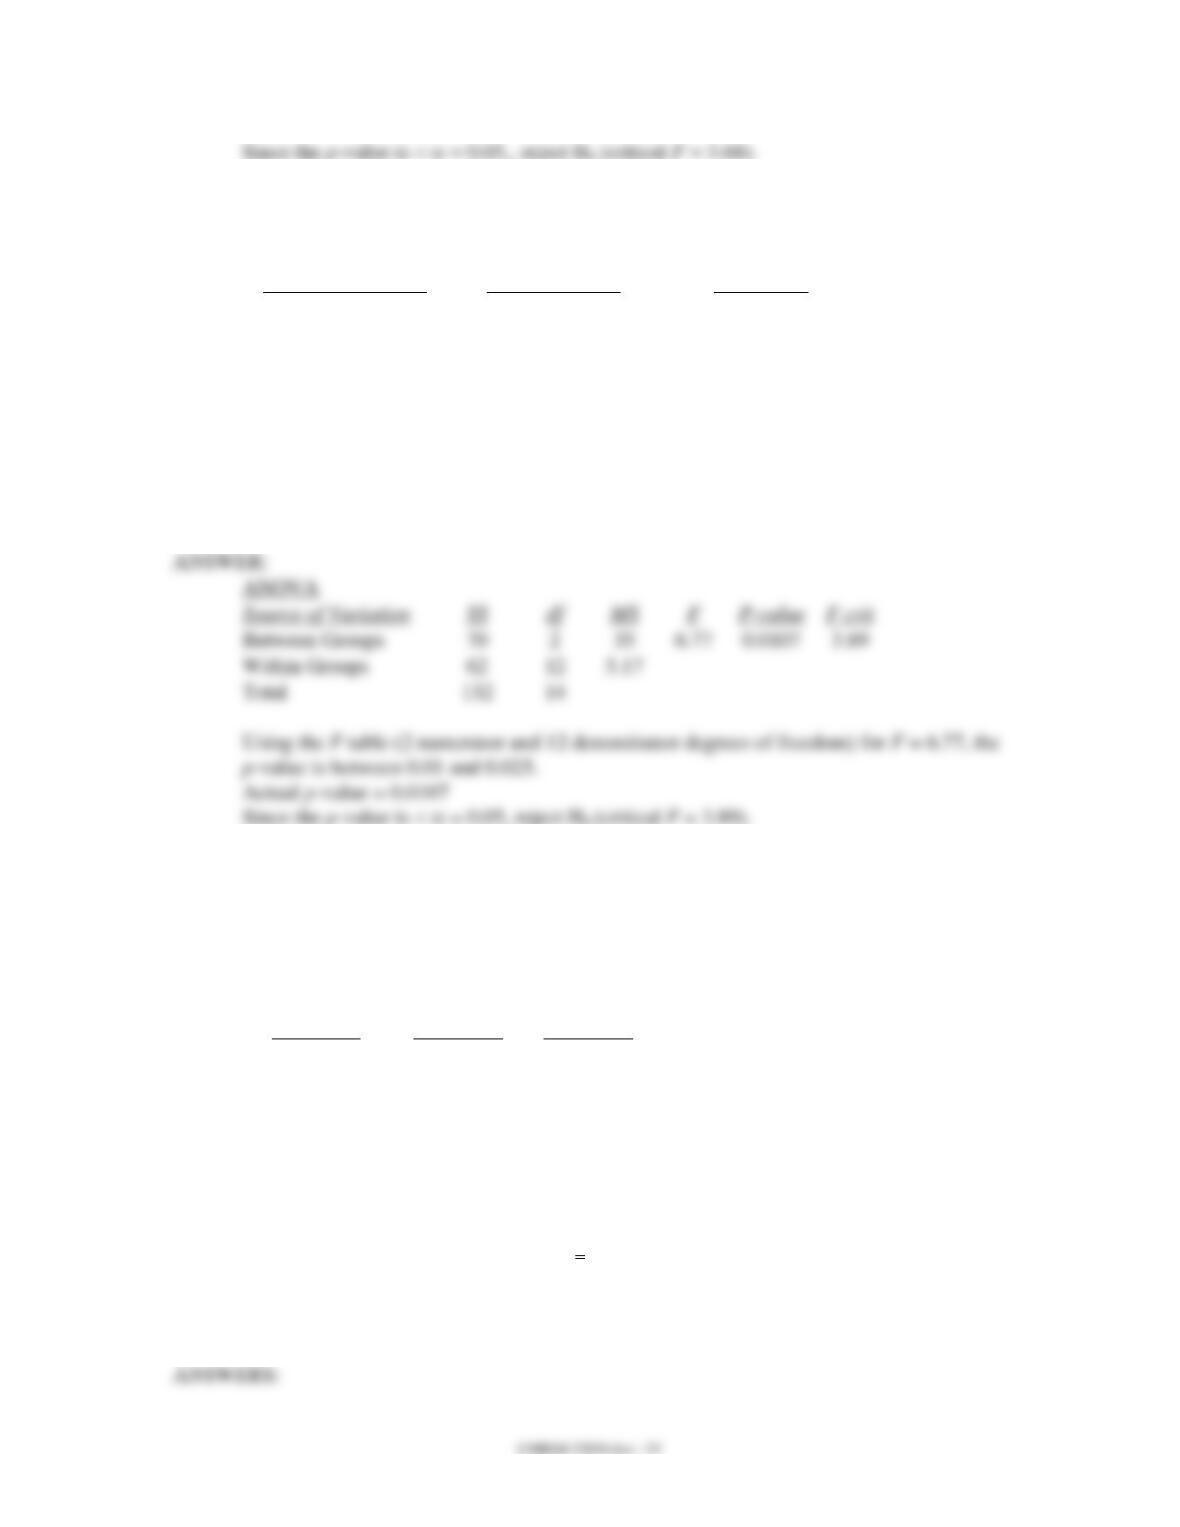
936
396
9
56. In order to test to see if there is any significant difference in the mean number of units
produced per week by each of three production methods, the following data were
collected:
Method I
Method II
Method III
182
170
160
170
192
156
185
190
179
a. Compute the overall sample mean
x
.
b. At the = 0.05 level of significance, is there any difference in the mean number of
units produced per week by each method? Show the complete ANOVA table. Note
that the sample sizes are not equal.
2
8
57. A dietician wants to see if there is any difference in the effectiveness of three diets.
Eighteen people were randomly chosen for the test. Then each individual was randomly
assigned to one of the three diets. Below you are given the total amount of weight lost in
a six-month period by each person.
Diet A
Diet B
Diet C
14
12
25
18
10
32
20
22
18
12
12
14
20
16
17
18
12
14
a. State the null and alternative hypotheses.
b. Prepare an ANOVA.
c. At 95% confidence test to determine if there is a significant difference in the means
of the three populations.
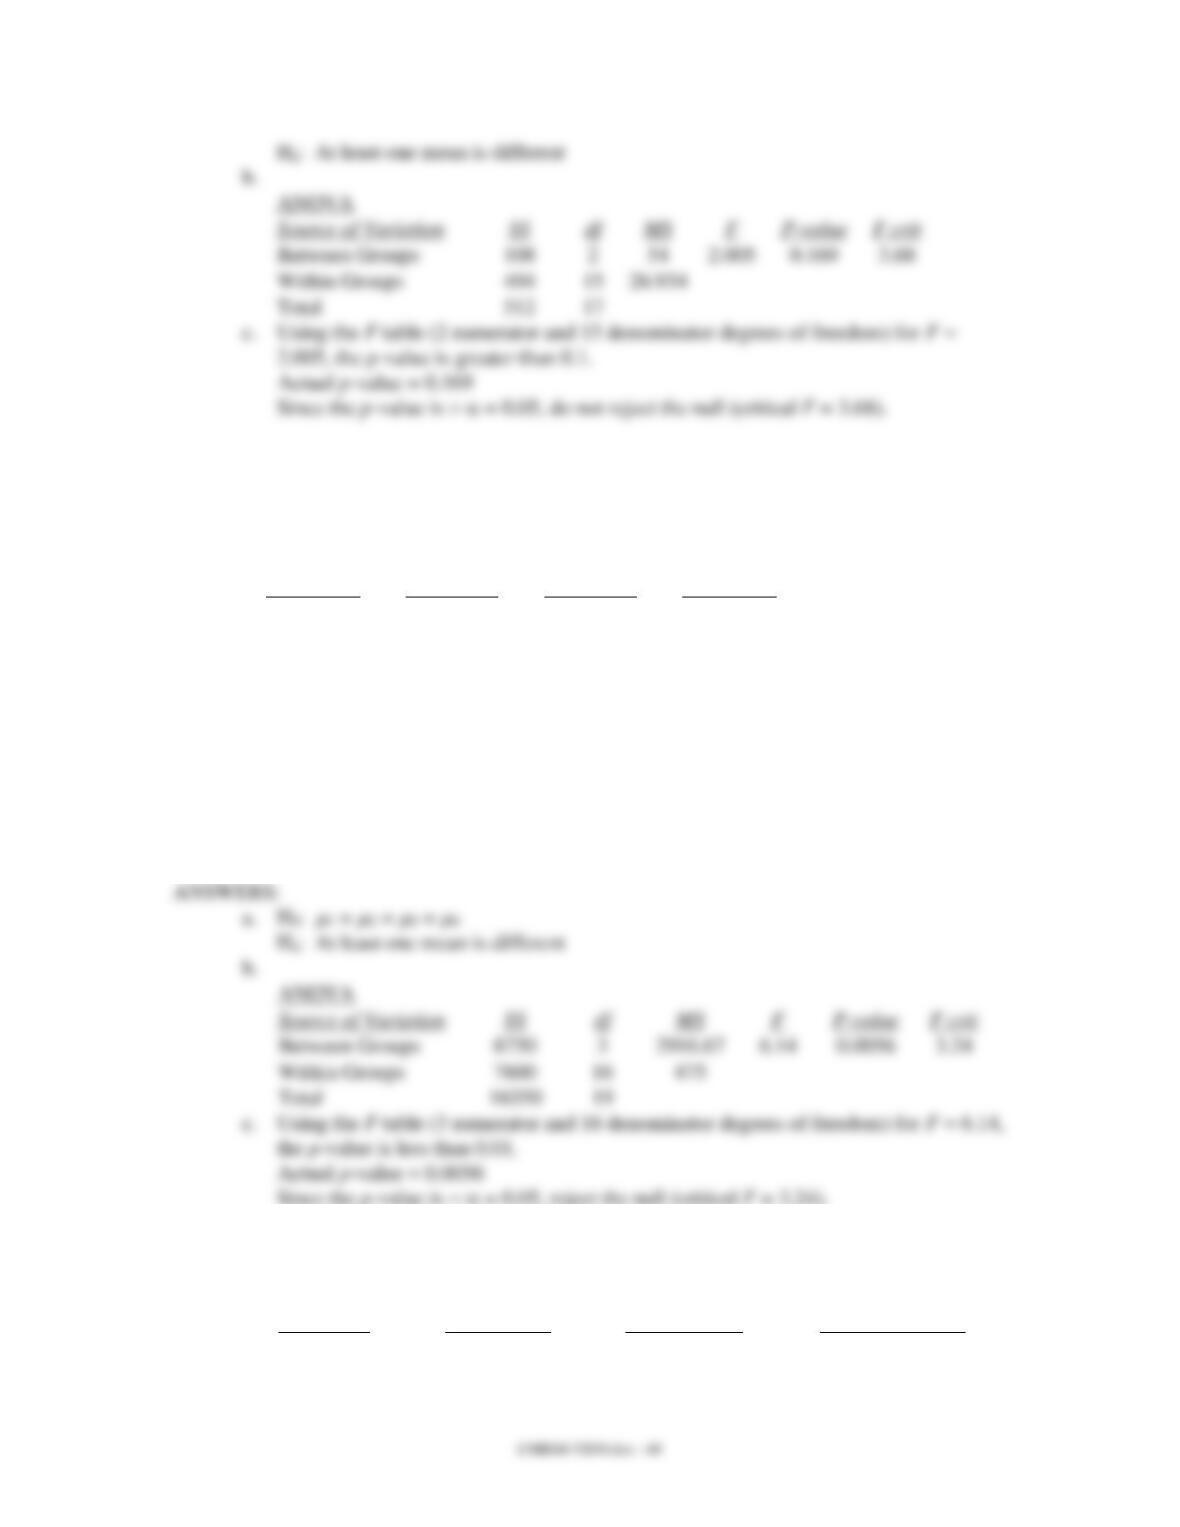
54
58. Ziba Corporation wants to increase the productivity of its line workers. Four different
programs have been suggested to help increase productivity. Twenty employees, making
up a sample, have been randomly assigned to one of the four programs and their output
for a day’s work has been recorded. You are given the results below.
Program A
Program B
Program C
Program D
150
150
185
175
130
120
220
150
120
135
190
120
180
160
180
130
145
110
175
175
a. State the null and alternative hypotheses.
b. Construct an ANOVA table.
c. At 95% confidence, test to determine if the means of the three populations are equal.
7600
59. For four populations, the population variances are assumed to be equal. Random samples
from each population provide the following data.
Population
Sample Size
Sample Mean
Sample Variance
1
11
40
23.4
2
11
35
21.6
3
11
39
25.2
4
11
37
24.6
Using a .05 level of significance, test to see if the means for all four populations are the
same. Show the complete ANOVA table.
40
43
60. The final examination grades of random samples of students from three different classes
are shown below.
Class A
Class B
Class C
92
91
85
85
85
93
96
90
82
99
86
84
At the = .05 level of significance, is there any difference in the mean grades of the
three classes? Show the complete ANOVA table.
206
61. Individuals were randomly assigned to three different production processes. The hourly
units of production for the three processes are shown below.
Process 1
Process 2
Process 3
33
33
28
30
35
36
28
30
30
29
38
34
Use the analysis of variance procedure with = 0.05 to determine if there is a significant
difference in the mean hourly units of production for the three types of production
processes. Show the complete ANOVA table.
9
62. Random samples of employees from three different departments of MNM Corporation
showed the following yearly incomes (in $1,000).
Department A
Department B
Department C
45
46
50
40
41
48
43
43
48
39
33
50
35
41
47
38
42
45
At = .05, test to determine if there is a significant difference among the average
incomes of the employees from the three departments. Show the complete ANOVA
table.
2
63. The heating bills for a selected sample of houses using various forms of heating are given
below (values are in dollars).
Gas Heated Homes
Central Electric
Heat Pump
83
90
81
80
88
83
82
87
80
83
82
82
82
83
79
At = 0.05, test to see if there is a significant difference among the average bills of the
homes. Show the complete ANOVA table.
64. Three universities in your state decided to administer the same comprehensive
examination to the recipients of MBA degrees from the three institutions. From each
institution, MBA recipients were randomly selected and were given the test. The
following table shows the scores of the students from each university.
Northern
University
Central
University
Southern
University
74
85
79
76
85
80
84
86
83
85
88
78
81
82
84
a. Compute the overall sample mean
x
.
b. At = 0.05, test to see if there is any significant difference in the average scores of
the students from the three universities. (Note that the sample sizes are not equal.)
ANOVA
Source of Variation
Between Groups
4.22
3.89
Total
65. The three major automobile manufacturers have entered their cars in the Indianapolis 500
race. The speeds of the tested cars are given below.
Manufacturer A
Manufacturer B
Manufacturer C
180
177
175
175
180
176
179
167
177
176
172
190
a. Compute the overall sample mean
x
.
b. At = .05, test to see if there is a significant difference in the average speeds of the
cars of the auto manufacturers. Show the complete ANOVA table.
ANOVA
Between Groups
1.56
4.26
Within Groups
Total
66. Part of an ANOVA table is shown below.
ANOVA
Source of Variation
SS
df
MS
F
Between Groups
90
3
?
?
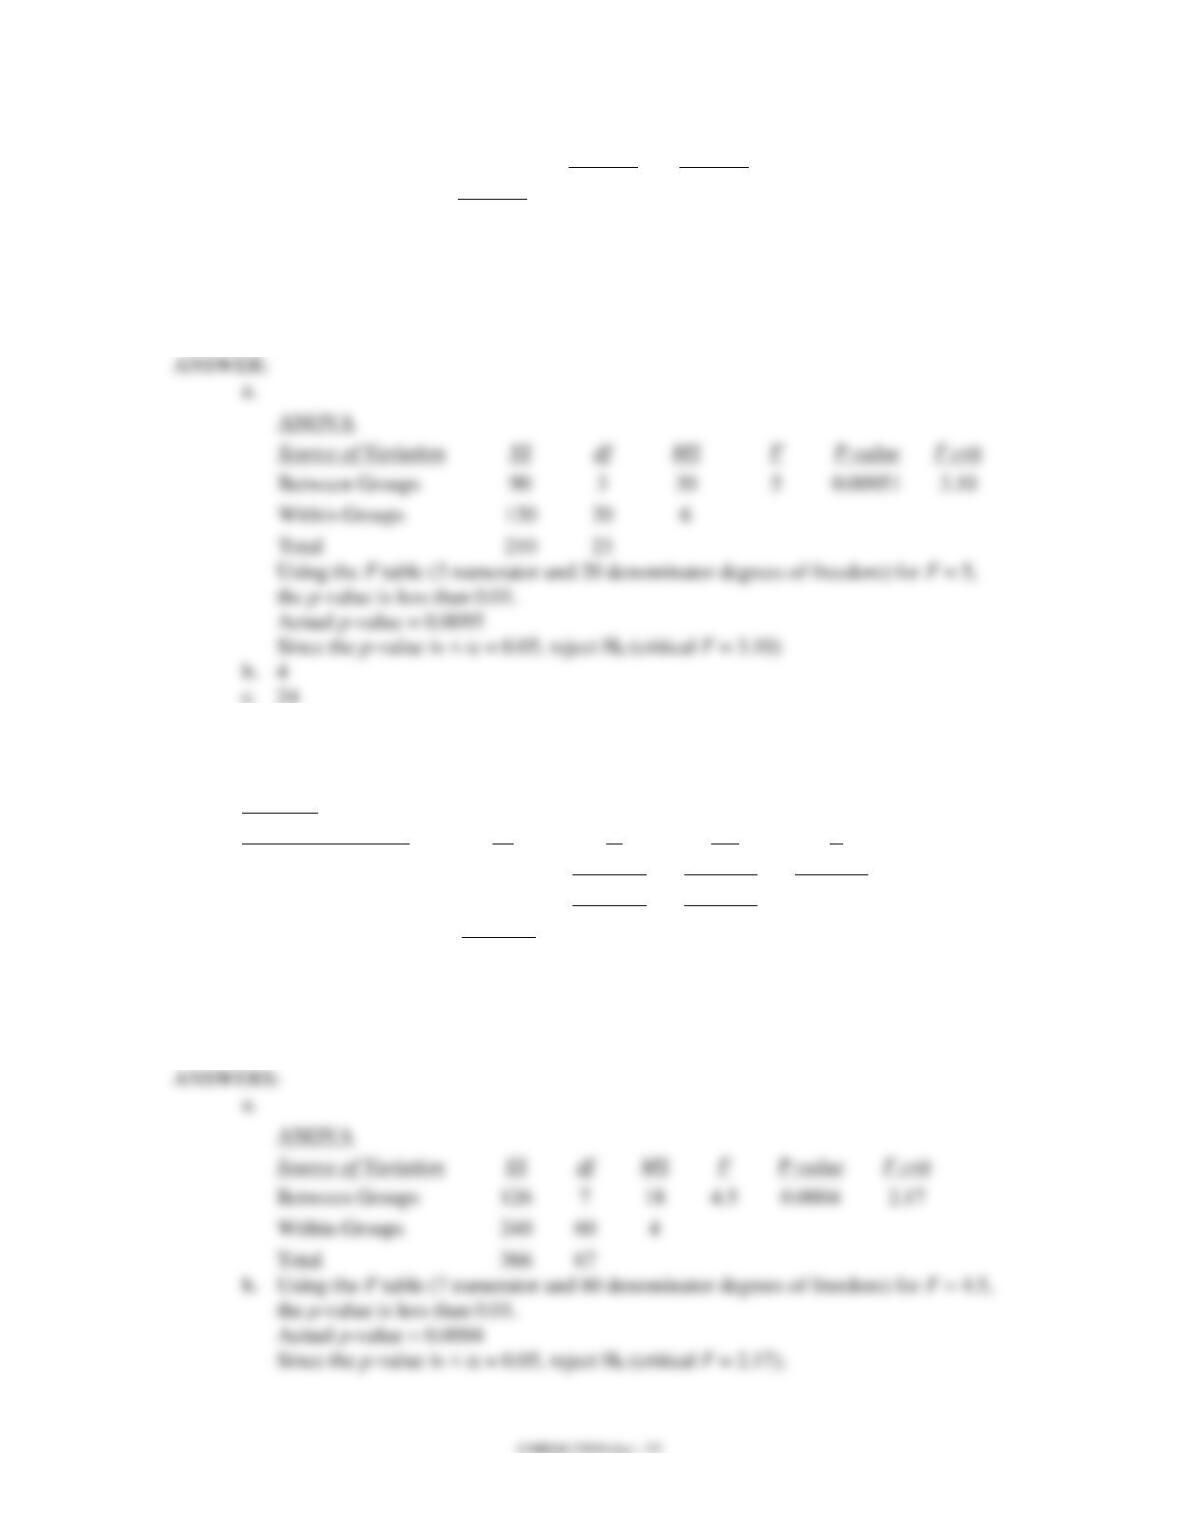
Within Groups
120
?
?
Total
?
23
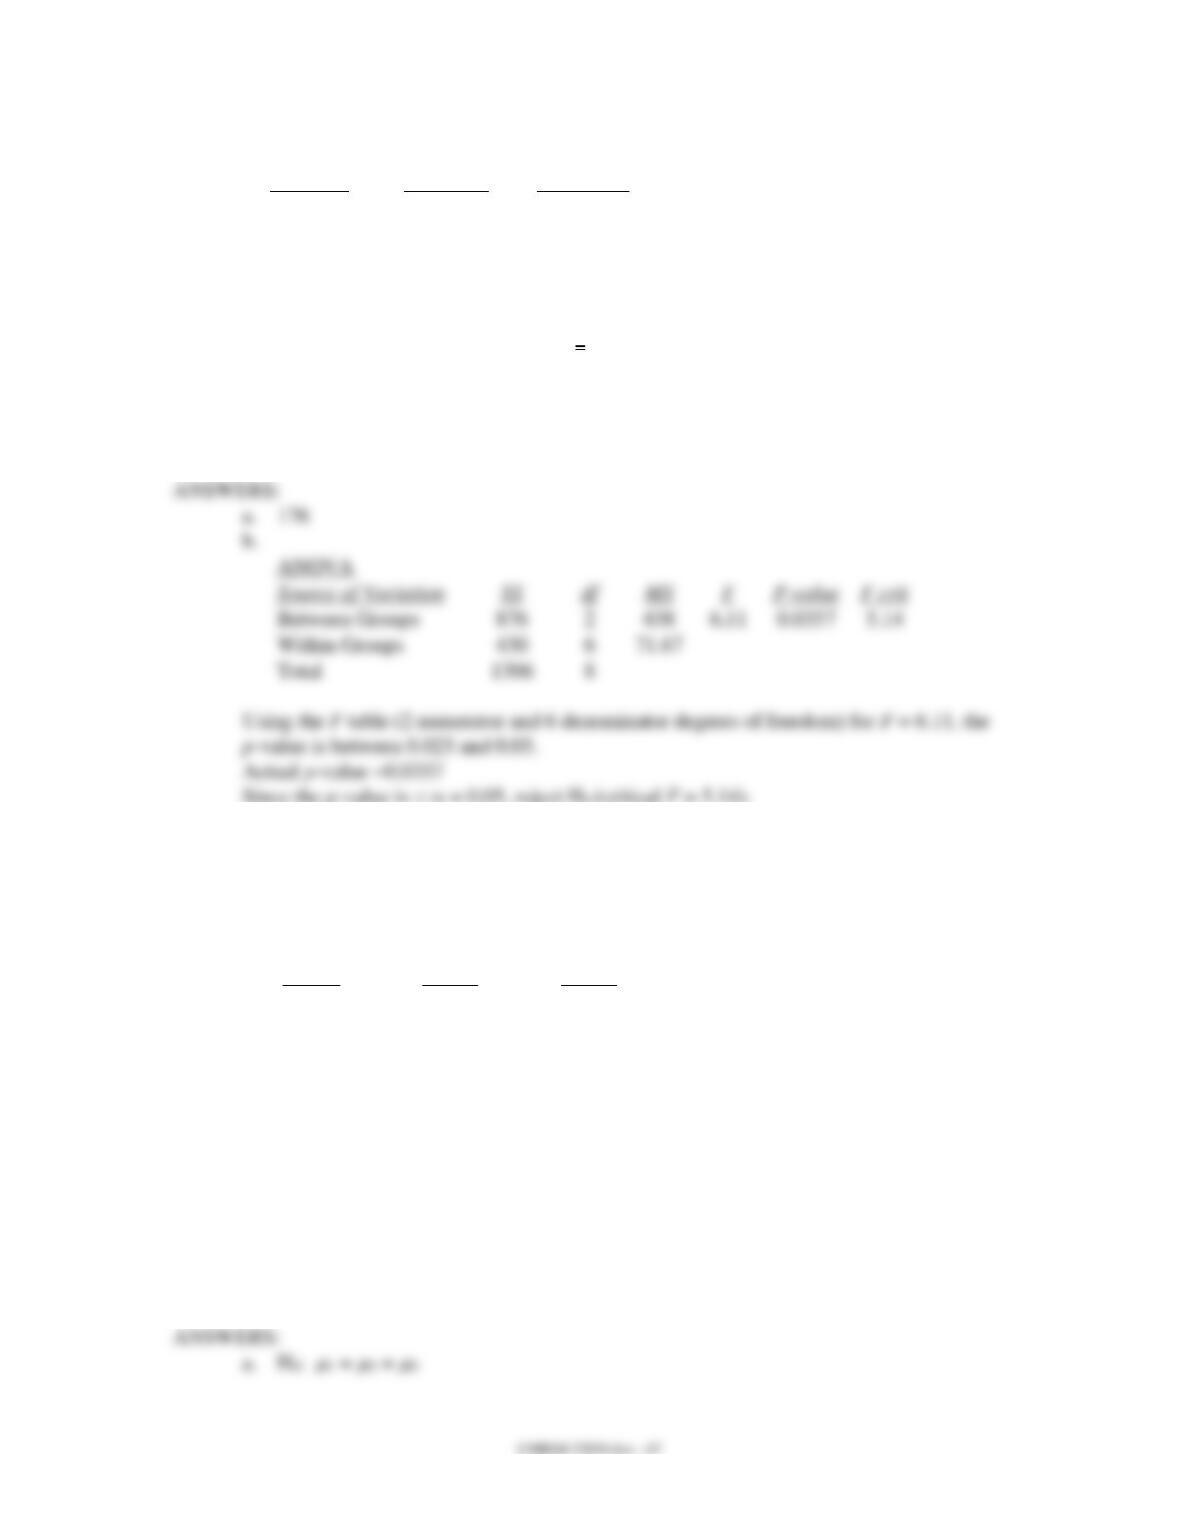
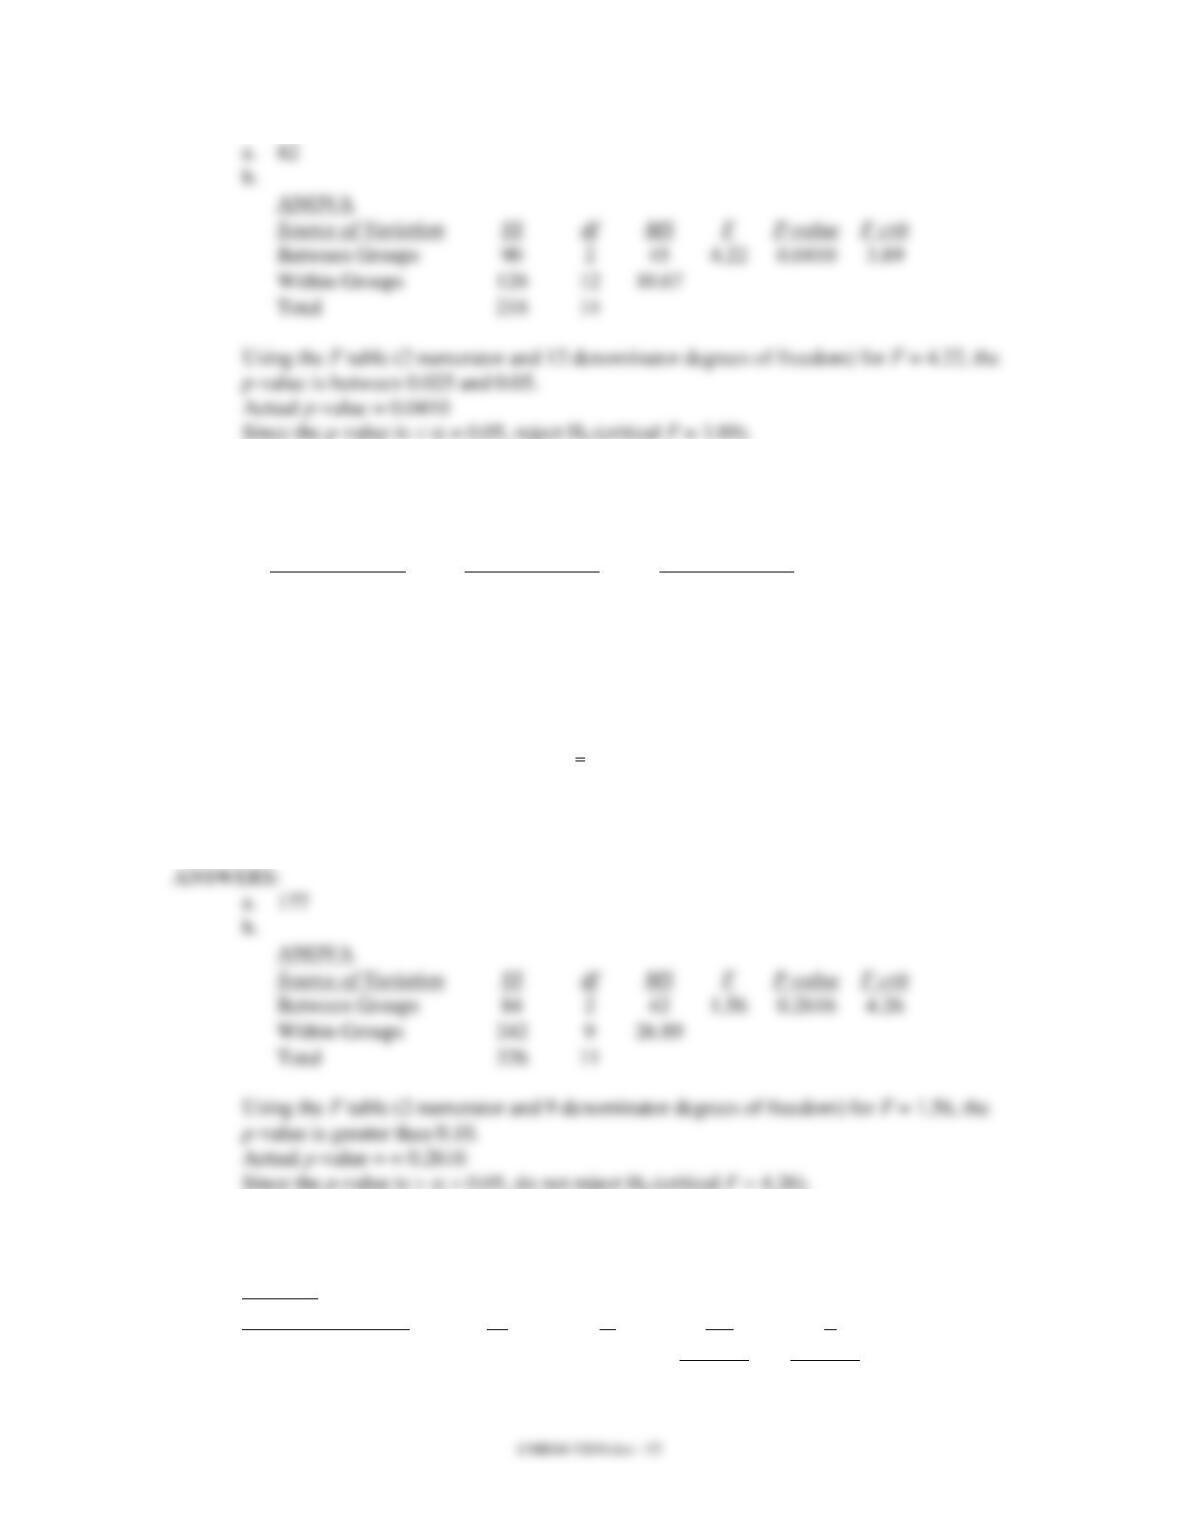
a. Determine the missing values and fill in the blanks in the above table. At 95%
confidence, test to determine if there is a significant difference among the means.
b. How many groups have there been in this problem?
c. What has been the total number of observations?
ANOVA
Within Groups
6
67. Part of an ANOVA table involving 8 groups for a study is shown below.
ANOVA
Source of Variation
SS
df
MS
F
Between Groups
126
?
?
?
Within Groups
240
?
?
Total
?
67
a. Determine all the missing values in the above table and fill in the blanks.
b. Use = 0.05 to determine if there is any significant difference among the means of
the eight groups.
ANOVA
Within Groups