
Compute a 95% confidence interval for the mean hours per month all students at the
university work.
94.12 to 105.88
10. A random sample of 81 children with working mothers showed that they were absent
from school an average of 6 days per term. The population standard deviation is known
to be 1.8 days. Provide a 90% confidence interval for the average number of days absent
per term for all the children.
5.631 to 6.329
11. The Highway Safety Department wants to study the driving habits of individuals. A
sample of 41 cars traveling on the highway revealed an average speed of 60 miles per
hour and a standard deviation of 7 miles per hour. The population of car speeds is
approximately normally distributed. Determine a 90% confidence interval estimate for
the speed of all cars.
58.16 to 61.84
12. Computer Services, Inc. wants to determine a confidence interval for the average CPU
time of their teleprocessing transactions. A sample of 196 transactions yielded a mean of
5 seconds. The population standard deviation is 1.4 seconds. Determine a 97%
confidence interval for the average CPU time.
4.783 to 5.217
13. The average monthly electric bill of a random sample of 256 residents of a city is $90.
The population standard deviation is assumed to be $24.
a. Construct a 90% confidence interval for the mean monthly electric bills of all
residents.
b. Construct a 95% confidence interval for the mean monthly electric bills of all
residents.
14. A sample of 100 cans of coffee showed an average weight of 13 ounces. The population
standard deviation is 0.8 ounces.
a. Construct a 95% confidence interval for the mean of the population.
b. Construct a 95.44% confidence interval for the mean of the population.
c. Discuss why the answers in parts a and b are different.
15. In order to determine how many hours per week freshmen college students watch
television, a random sample of 256 students was selected. It was determined that the
students in the sample spent an average of 14 hours. The standard deviation is 3.2 hours
per week for all freshman college students.
a. Provide a 95% confidence interval estimate for the average number of hours that
all college freshmen spend watching TV per week.
b. Suppose the sample mean came from a sample of 25 students. Provide a 95%
confidence interval estimate for the average number of hours that all college
freshmen spend watching TV per week. Assume that the hours are normally
distributed.
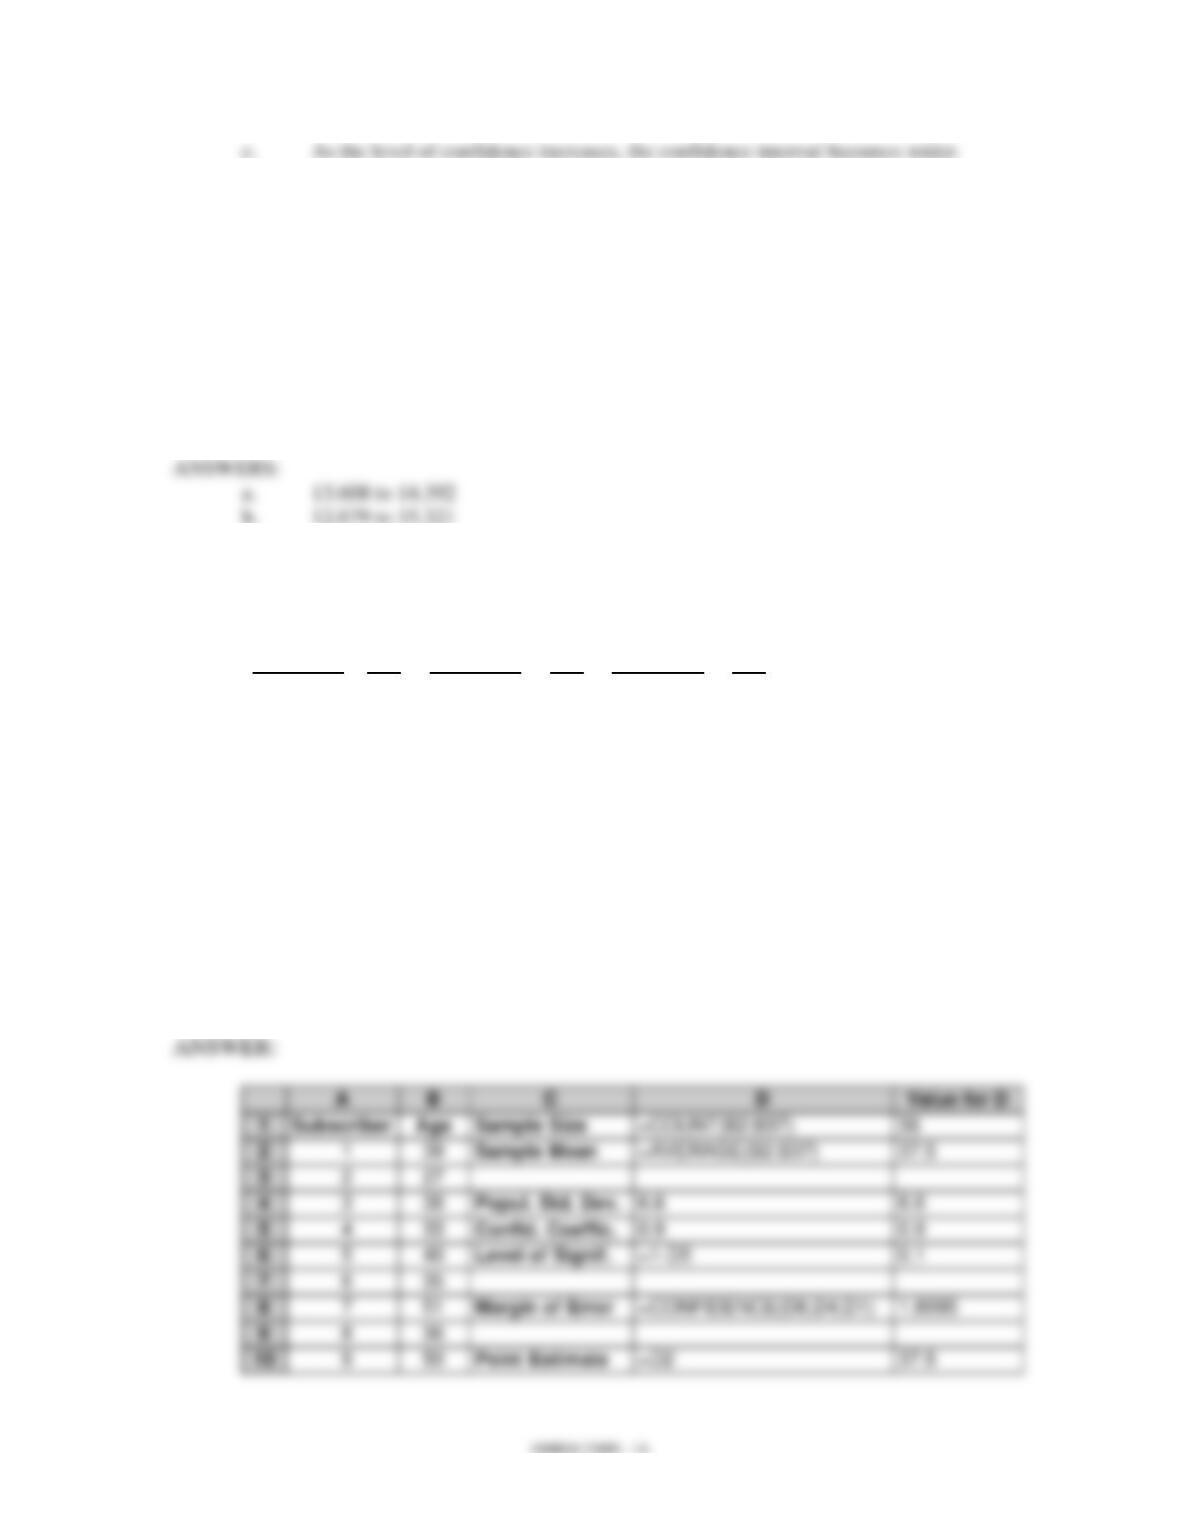
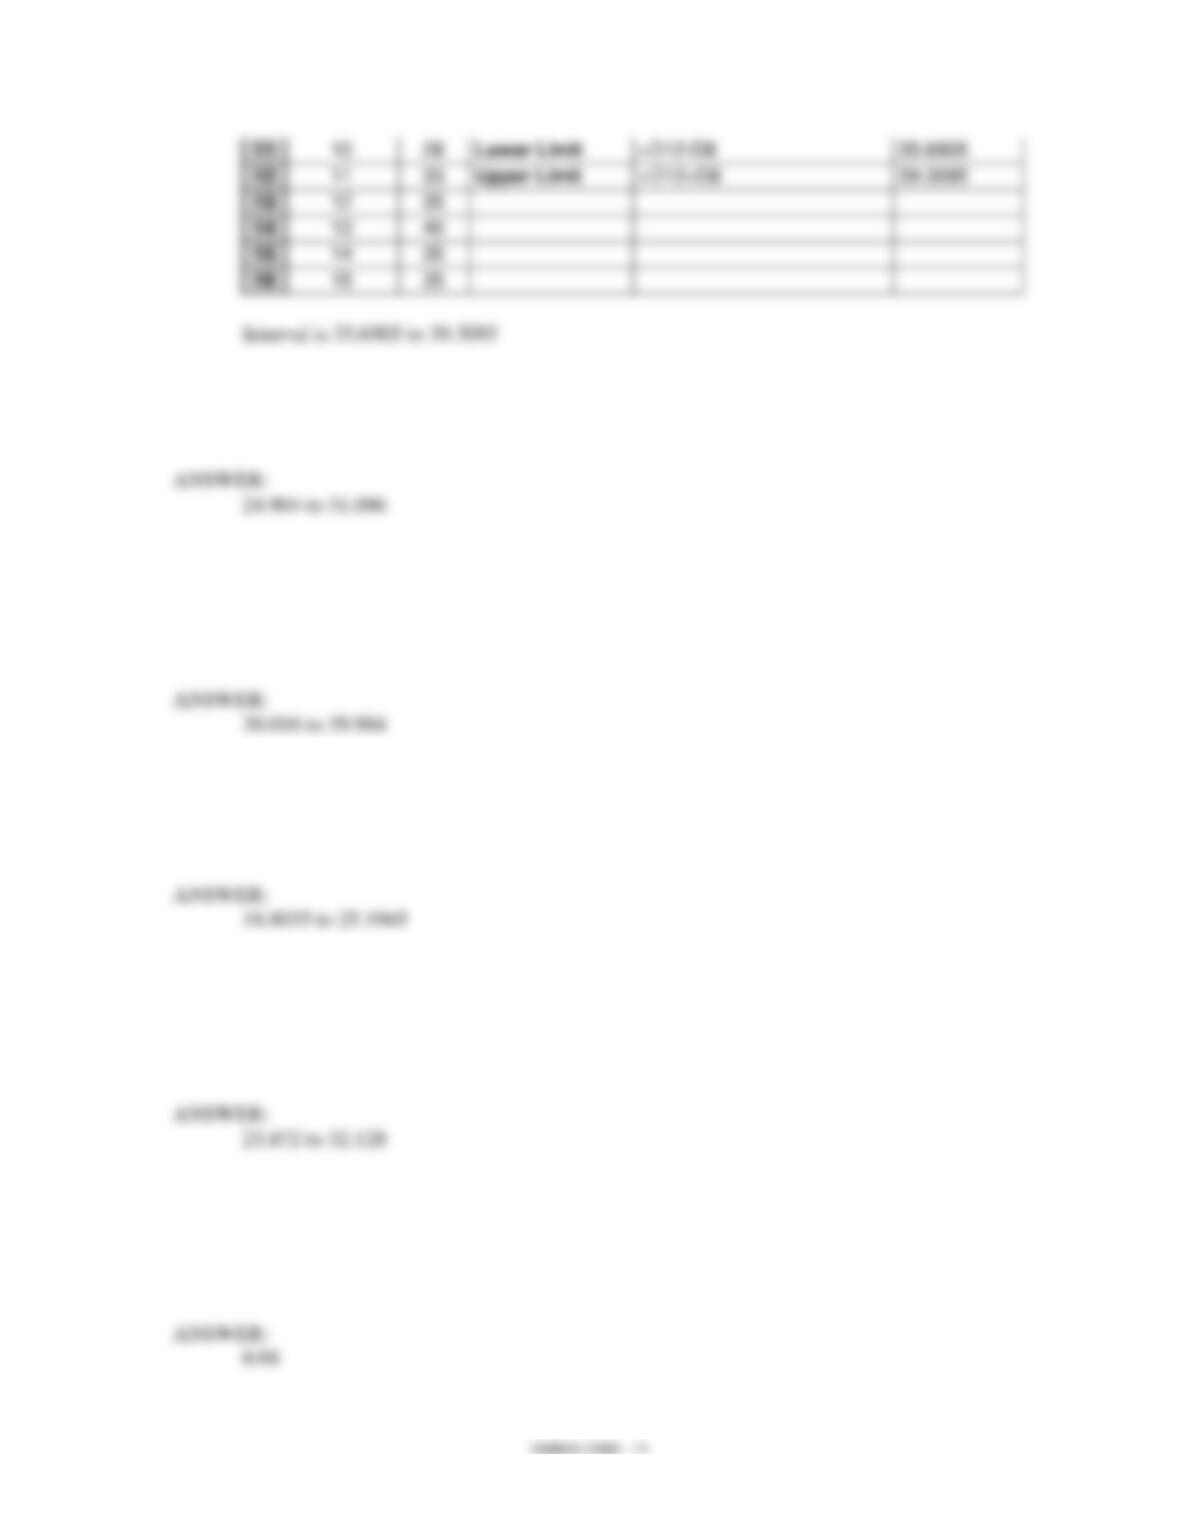
16. A random sample of 36 magazine subscribers is taken to estimate the mean age of all
subscribers. The data follow. Use Excel to construct a 90% confidence interval estimate
of the mean age of all of this magazine’s subscribers.
Subscriber
Age
Subscriber
Age
Subscriber
Age
1
39
13
40
25
38
2
27
14
35
26
51
3
38
15
35
27
26
4
33
16
41
28
39
5
40
17
34
29
35
6
35
18
46
30
37
7
51
19
44
31
33
8
36
20
44
32
41
9
47
21
43
33
36
10
28
22
32
34
33
11
33
23
29
35
46
12
35
24
33
36
37
17. A simple random sample of 25 items from a normally distributed population resulted in a
sample mean of 28 and a standard deviation of 7.5. Construct a 95% confidence interval
for the population mean.
18. A sample of 25 patients in a doctor’s office showed that they had to wait an average of 35
minutes with a standard deviation of 10 minutes before they could see the doctor.
Provide a 98% confidence interval estimate for the average waiting time of all the
patients who visit this doctor. Assume the population of waiting times is normally
distributed.
19. A sample of 16 students from a large university is taken. The average age in the sample
was 22 years with a standard deviation of 6 years. Construct a 95% confidence interval
for the average age of the population. Assume the population of student ages is normally
distributed.
20. The proprietor of a boutique in New York wanted to determine the average age of his
customers. A random sample of 25 customers revealed an average age of 28 years with a
standard deviation of 10 years. Determine a 95% confidence interval estimate for the
average age of all his customers. Assume the population of customer ages is normally
distributed.
21. A statistician selected a sample of 16 accounts receivable and determined the mean of the
sample to be $5,000 with a standard deviation of $400. She reported that the sample
information indicated the mean of the population ranges from $4,739.80 to $5,260.20.
She did not report what confidence coefficient she had used. Based on the above
information, determine the confidence coefficient that was used.
22. The makers of a soft drink want to identify the average age of its consumers. A sample
of 16 consumers is taken. The average age in the sample was 22.5 years with a standard
deviation of 5 years. Assume the population of consumer ages is normally distributed.
a. Construct a 95% confidence interval for the average age of all the consumers.
b. Construct an 80% confidence interval for the average age of all the consumers.
c. Discuss why the 95% and 80% confidence intervals are different.
23. A random sample of 25 observations was taken from a normally distributed population.
The average in the sample was 84.6 with a variance of 400.
a. Construct a 90% confidence interval for
.
b. Construct a 99% confidence interval for
.
c. Discuss why the 90% and 99% confidence intervals are different.
d. What would you expect to happen to the confidence interval in part a if the
sample size was increased? Be sure to explain your answer.
24. You are given the following information obtained from a random sample of 4
observations taken from a large, normally distributed population.
25
47
32
56
Construct a 95% confidence interval for the mean of the population.
25. You are given the following information obtained from a random sample of 4
observations from a large, normally distributed population.
25
47
32
56
a. What is the point estimate of
?
b. Construct a 95% confidence interval for
.
c. Construct a 90% confidence interval for
.
d. Discuss why the 90% and 95% confidence intervals are different.
26. The monthly incomes from a random sample of faculty at a university are shown below.
Monthly Income ($1000s)
3.0
4.0
6.0
3.0
5.0
5.0
6.0
8.0
Compute a 90% confidence interval for the mean of the population. The population of all
faculty incomes is known to be normally distributed. Give your answer in dollars.
27. Fifty students are enrolled in an Economics class. After the first examination, a random
sample of 5 papers was selected. The grades were 60, 75, 80, 70, and 90.
a. Calculate the estimate of the standard error of the mean.
b. What assumption must be made before we can determine an interval for the mean
grade of all the students in the class? Explain why.
c. Assume the assumption of Part b is met. Provide a 90% confidence interval for
the mean grade of all the students in the class.
d. If there were 200 students in the class, what would be the 90% confidence
interval for the mean grade of all the students in the class?
28. A local university administers a comprehensive examination to the recipients of a B.S.
degree in Business Administration. A sample of 5 examinations is selected at random
and scored. The scores are shown below.
Grade
56
85
65
86
93
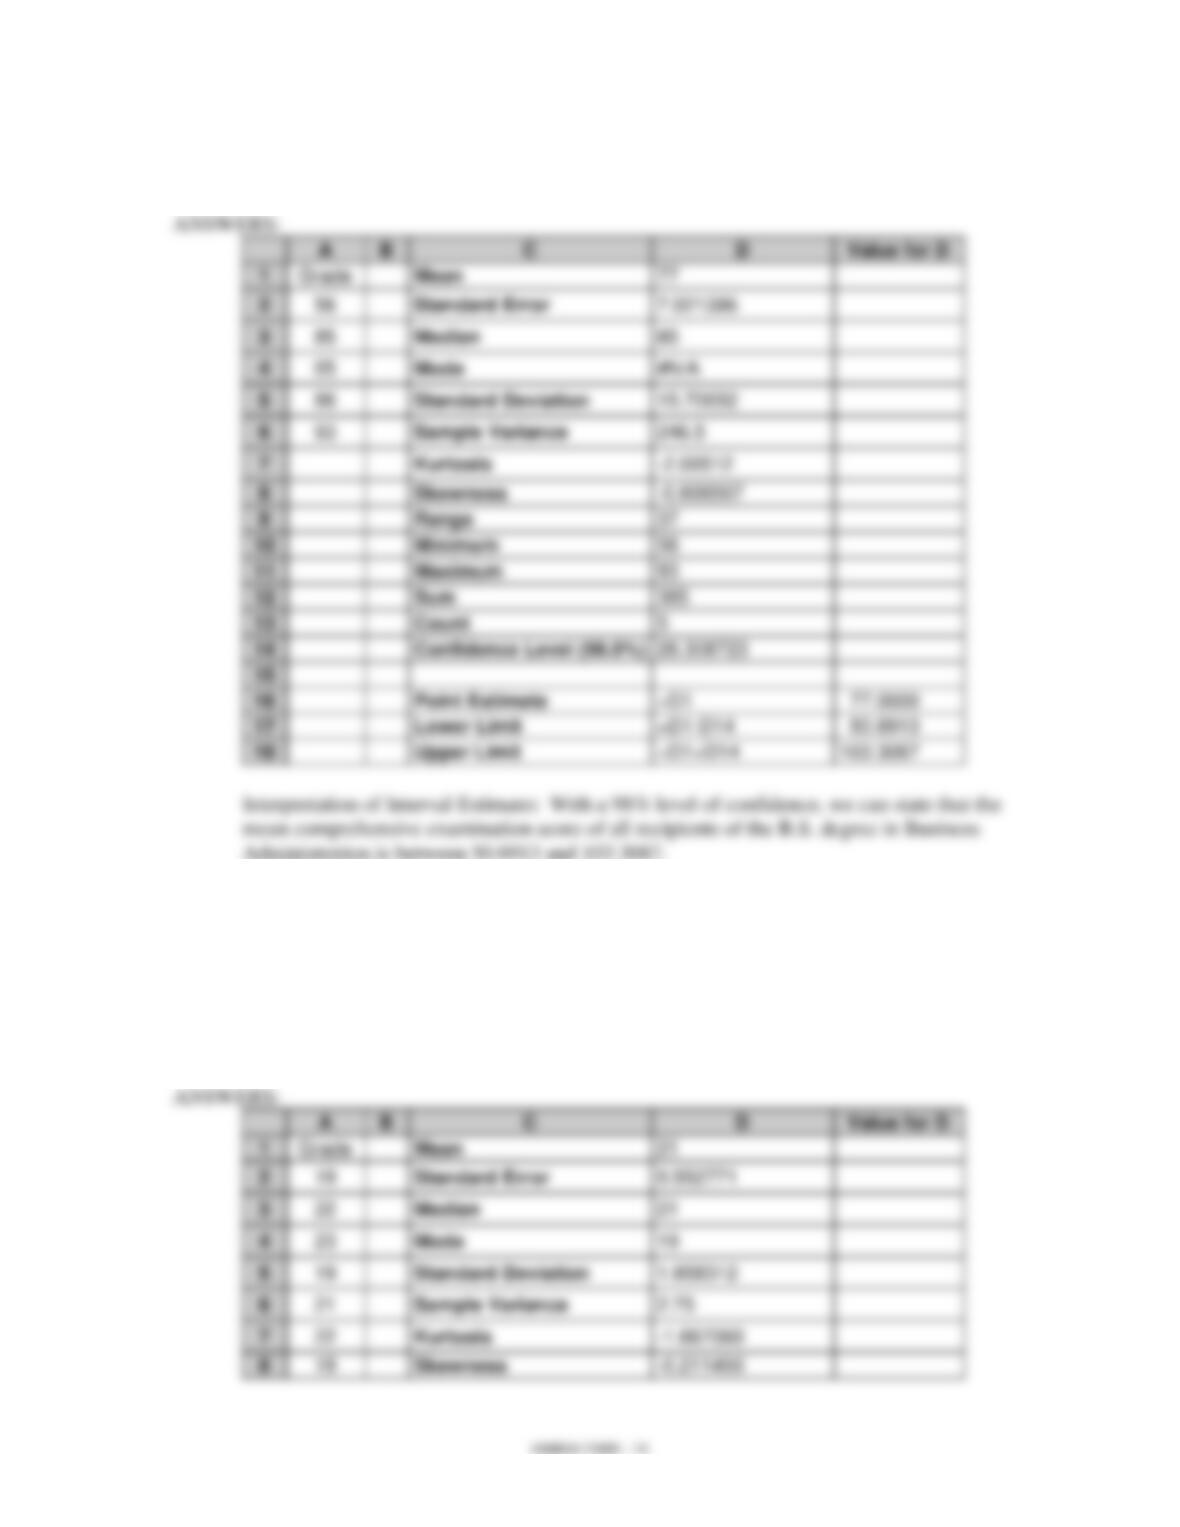
Use Excel to determine an interval estimate for the mean of the population at a 98%
confidence level. Interpret your results.
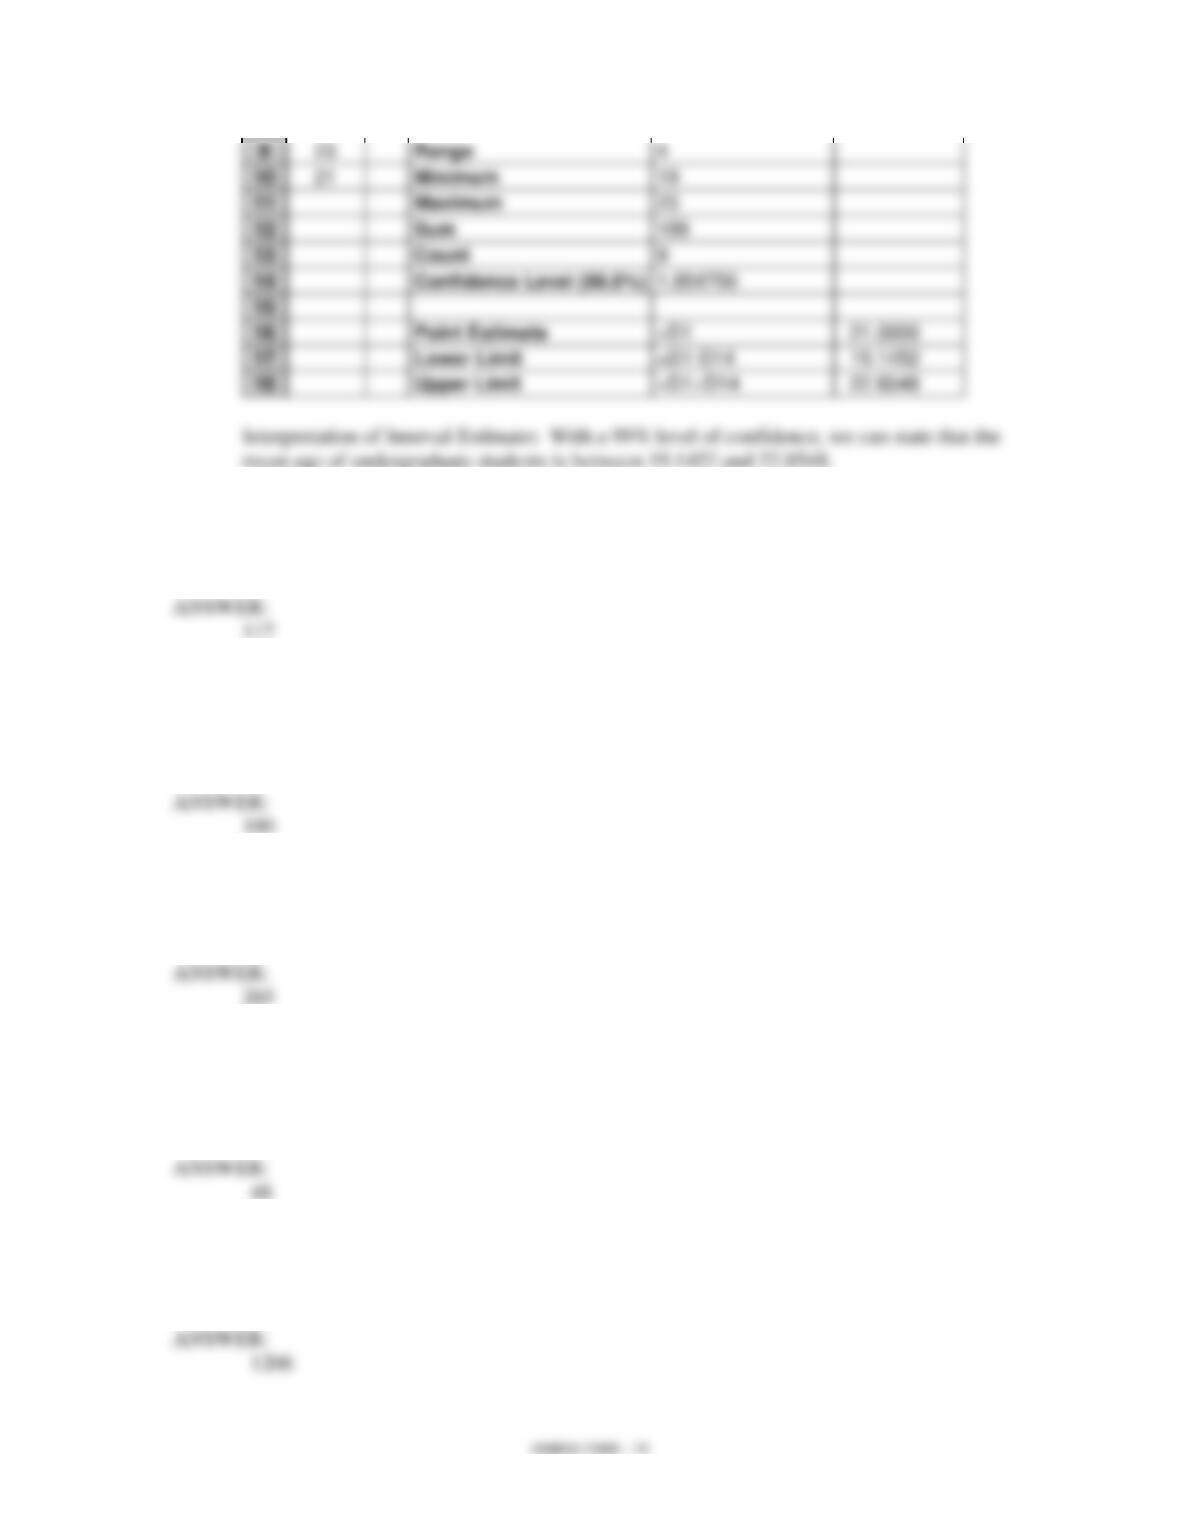
29. Below you are given ages that were obtained by taking a random sample of 9
undergraduate students.
19
22
23
19
21
22
19
23
21
Use Excel to determine an interval estimate for the mean of the population at a 99%
confidence level. Interpret your results.
30. The monthly starting salaries of students who receive an MBA degree have a standard
deviation of $110. What size sample should be selected to obtain a 0.95 probability of
estimating the mean monthly income within $20 or less?
31. A coal company wants to determine a 95% confidence interval estimate for the average
daily tonnage of coal that they mine. Assuming that the company reports that the
standard deviation of daily output is 200 tons, how many days should they sample so that
the margin of error will be 39.2 tons or less?
32. If the standard deviation of the lifetimes of vacuum cleaners is estimated to be 300 hours,
how large of a sample must be taken in order to be 97% confident that the margin of error
will not exceed 40 hours?
33. A researcher is interested in determining the average number of years employees of a
company stay with the company. If past information shows a standard deviation of 7
months, what size sample should be taken so that at 95% confidence the margin of error
will be 2 months or less?
34. If the standard deviation for the lifetimes of washing machines is estimated to be 800
hours, how large a sample must be taken in order to be 97% confident that the margin of
error will not exceed 50 hours?
35. A real estate agent wants to estimate the mean selling price of two-bedroom homes in a
particular area. She wants to estimate the mean selling price to within $10,000 with an
89.9% level of confidence. The standard deviation of selling prices is unknown but the
agent estimates that the highest selling price is $1,000,000 and the lowest is $50,000.
How many homes should be sampled?
36. For inventory purposes, a grocery store manager wants to estimate the mean number of
pounds of cat food sold per month. The estimate is desired to be within 10 pounds with a
95% level of confidence. A pilot study provided a standard deviation of 27.6 pounds.
How many months should be sampled?
37. It is known that the variance of a population equals 484. A random sample of 81
observations is going to be taken from the population.
a. With a .80 probability, what statement can be made about the size of the margin
of error?
b. With a .80 probability, how large of a sample would have to be taken to provide a
margin of error of 3 or less?
38. In a random sample of 400 registered voters, 120 indicated they plan to vote for
Candidate A. Determine a 95% confidence interval for the proportion of all the
registered voters who will vote for Candidate A.
39. In a random sample of 200 registered voters, 120 indicated they are Democrats. Develop
a 95% confidence interval for the proportion of registered voters in the population who
are Democrats.
40. In a random sample of 500 college students, 23% say that they read or watch the news
every day. Develop a 90% confidence interval for the population proportion. Interpret
your results.

41. Six hundred consumers were asked whether they would like to purchase a domestic or a
foreign automobile. Their responses are given below.
Preference
Frequency
Domestic
240
Foreign
360
Develop a 95% confidence interval for the proportion of all consumers who prefer to
purchase domestic automobiles.
42. A university planner wants to determine the proportion of spring semester students who
will attend summer school. She surveys 32 current students discovering that 12 will
return for summer school.
a. Construct a 90% confidence interval estimate for the proportion of current spring
students who will return for summer school.
b. With a 0.95 probability, how large of a sample would have to be taken to provide
a margin of error of 3% or less?
43. A new brand of breakfast cereal is being market tested. One hundred boxes of the cereal
were given to consumers to try. The consumers were asked whether they liked or
disliked the cereal. You are given their responses below.
Response
Frequency
Liked
60
Disliked
40
100
a. What is the point estimate of the proportion of people who will like the cereal?
b. Construct a 95% confidence interval for the proportion of all consumers who will
like the cereal.
c. What is the margin of error for the 95% confidence interval that you constructed
in part b?
d. With a .95 probability, how large of a sample needs to be taken to provide a
margin of error of .09 or less?
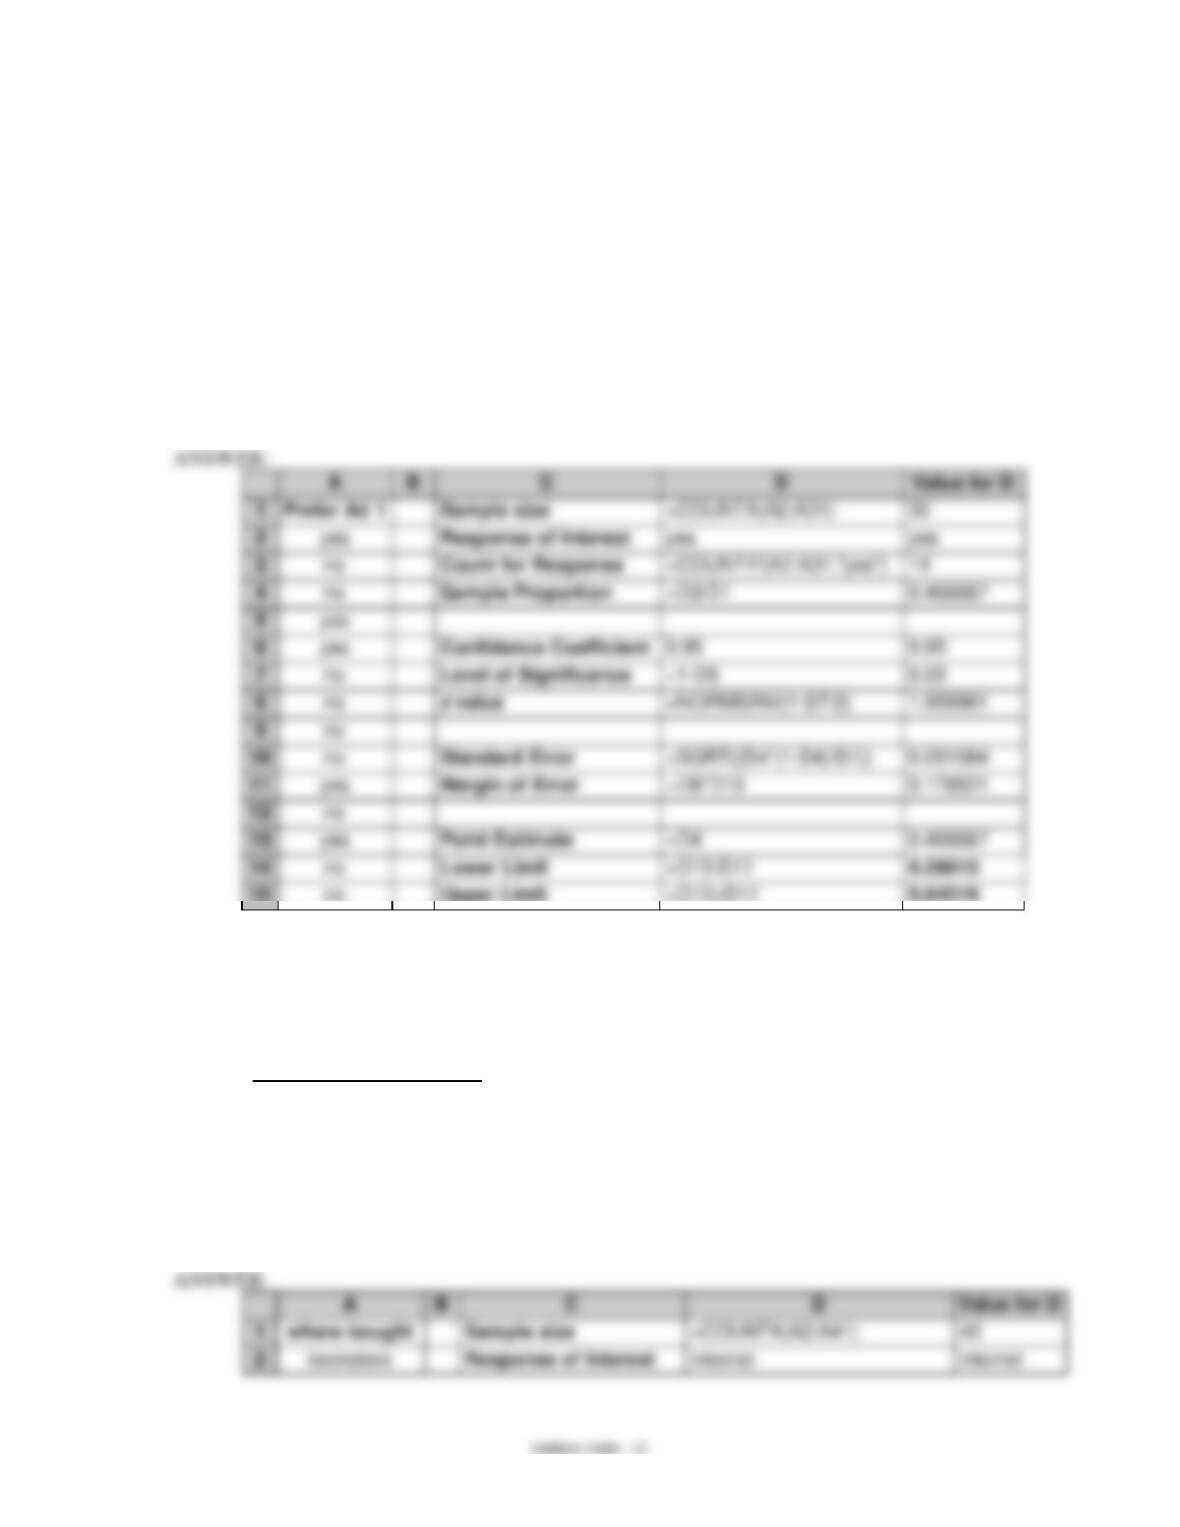
44. A marketing firm is developing a new television advertisement for a large discount retail
chain. A sample of 30 people is shown two potential ads and asked their preference. The
results for ad #1 follow. Use Excel to develop a 95% confidence interval estimate of the
proportion of people in the population who will prefer ad #1.
Prefer Advertisement #1
yes
no
no
yes
yes
no
no
no
no
yes
no
yes
no
no
yes
yes
yes
no
yes
yes
no
no
no
yes
yes
no
yes
yes
no
no
45. A survey of 40 students at a local college asks, “Where do you buy the majority of your
books?” The responses fell into three categories: “at the campus bookstore,” “on the
Internet,” and “other.” The results follow. Use Excel to estimate the proportion of all of
the college students who buy their books on the Internet.
Where Most Books Bought
bookstore
bookstore
internet
other
internet
other
bookstore
other
bookstore
bookstore
bookstore
bookstore
bookstore
other
bookstore
bookstore
bookstore
internet
internet
other
other
other
other
other
other
other
internet
bookstore
other
other
internet
other
bookstore
bookstore
other
bookstore
internet
internet
other
bookstore
46. A health club annually surveys its members. Last year, 33% of the members said they
use the treadmill at least 4 times a week. How large of sample should be taken this year
to estimate the percentage of members who use the treadmill at least 4 times a week?
The estimate is desired to have a margin of error of 5% with a 95% level of confidence.
47. A local hotel wants to estimate the proportion of its guests that are from out-of-state.
Preliminary estimates are that 45% of the hotel guests are from out-of-state. How large a
sample should be taken to estimate the proportion of out-of-state guests with a margin of
error no larger than 5% and with a 95% level of confidence?
48. The manager of a department store wants to determine what proportion of people who
enter the store use the store’s credit card for their purchases. What size sample should he
take so that at 99% confidence the error will not be more than 8%?
49. The manager of Hudson Auto Repair wants to advertise one price for an engine tune-up,
with parts included. Before he decides the price to advertise, he needs a good estimate of
the average cost of tune-up parts. A sample of 20 customer invoices for tune-ups has
been taken and the costs of parts, rounded to the nearest dollar, are listed below.
91
78
93
57
75
52
99
80
105
62
104
74
62
68
97
73
77
65
80
109
Provide a 90% confidence interval estimate of the mean cost of parts per tune-up for all
of the tune-ups performed at Hudson Auto Repair.

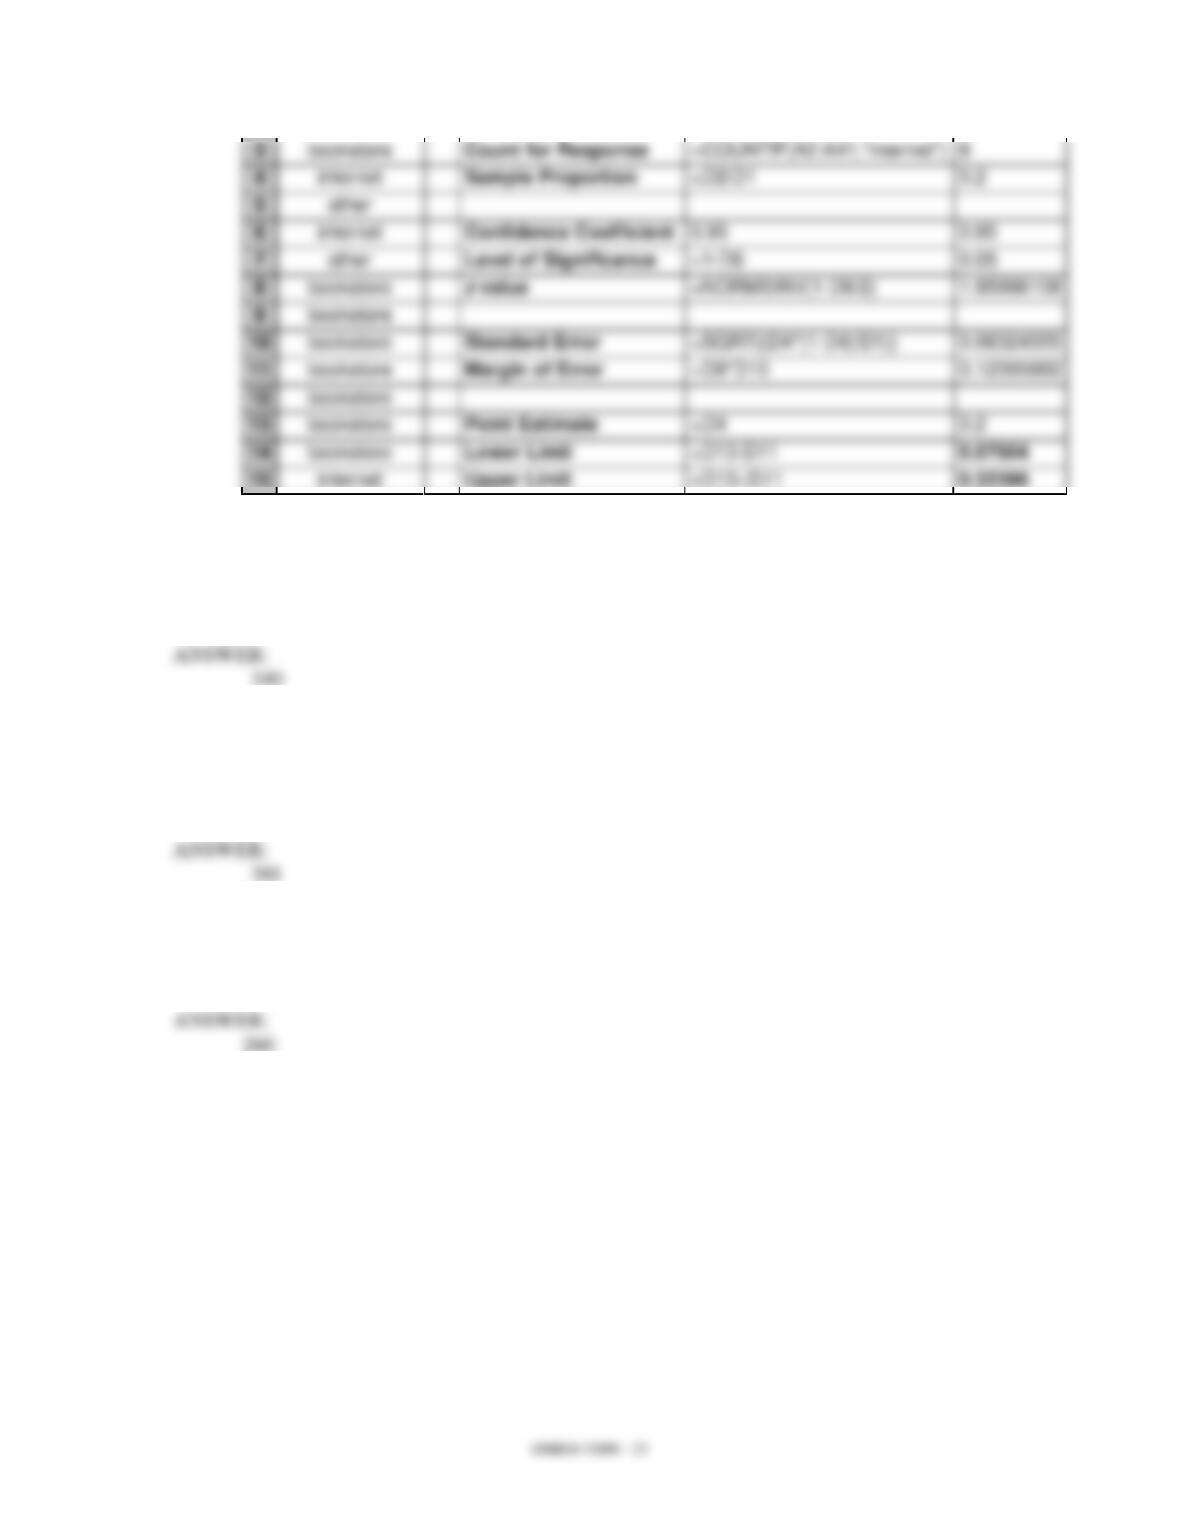
50. The manager of University Credit Union (UCU) is concerned about checking account
transaction discrepancies. Customers are bringing transaction errors to the attention of
the bank’s staff several months after they occur. The manager would like to know what
proportion of his customers balance their checking accounts within 30 days of receiving a
transaction statement from the bank.
Using random sampling, 400 checking account customers are contacted by telephone and
asked if they routinely balance their accounts within 30 days of receiving a statement.
271 of the 400 customers respond Yes.
a. Develop a 95% confidence interval estimate for the proportion of the population
of checking account customers at UCU that routinely balance their accounts in a
timely manner.
b. Suppose UCU wants a 95% confidence interval estimate of the population
proportion with a margin of error of E = .025. How large a sample size is
needed?