a. Construct a frequency distribution and graphically represent the
frequency distribution.
b. Construct a relative frequency distribution and graphically represent the
relative frequency distribution.
6. There are 800 students in the School of Business Administration. There are four
majors in the School: Accounting, Finance, Management, and Marketing. The
following shows the number of students in each major.
Major
Number of Students
Accounting
240
Finance
160
Management
320
Marketing
80
Develop a percent frequency distribution and construct a bar chart and a pie
chart.
7. Below you are given the examination scores of 20 students.
52
99
92
86
84
63
72
76
95
88
92
58
65
79
80
90
75
74
56
99
a. Construct a frequency distribution for this data. Let the first class be 50
– 59 and draw a histogram.
b. Construct a cumulative frequency distribution.
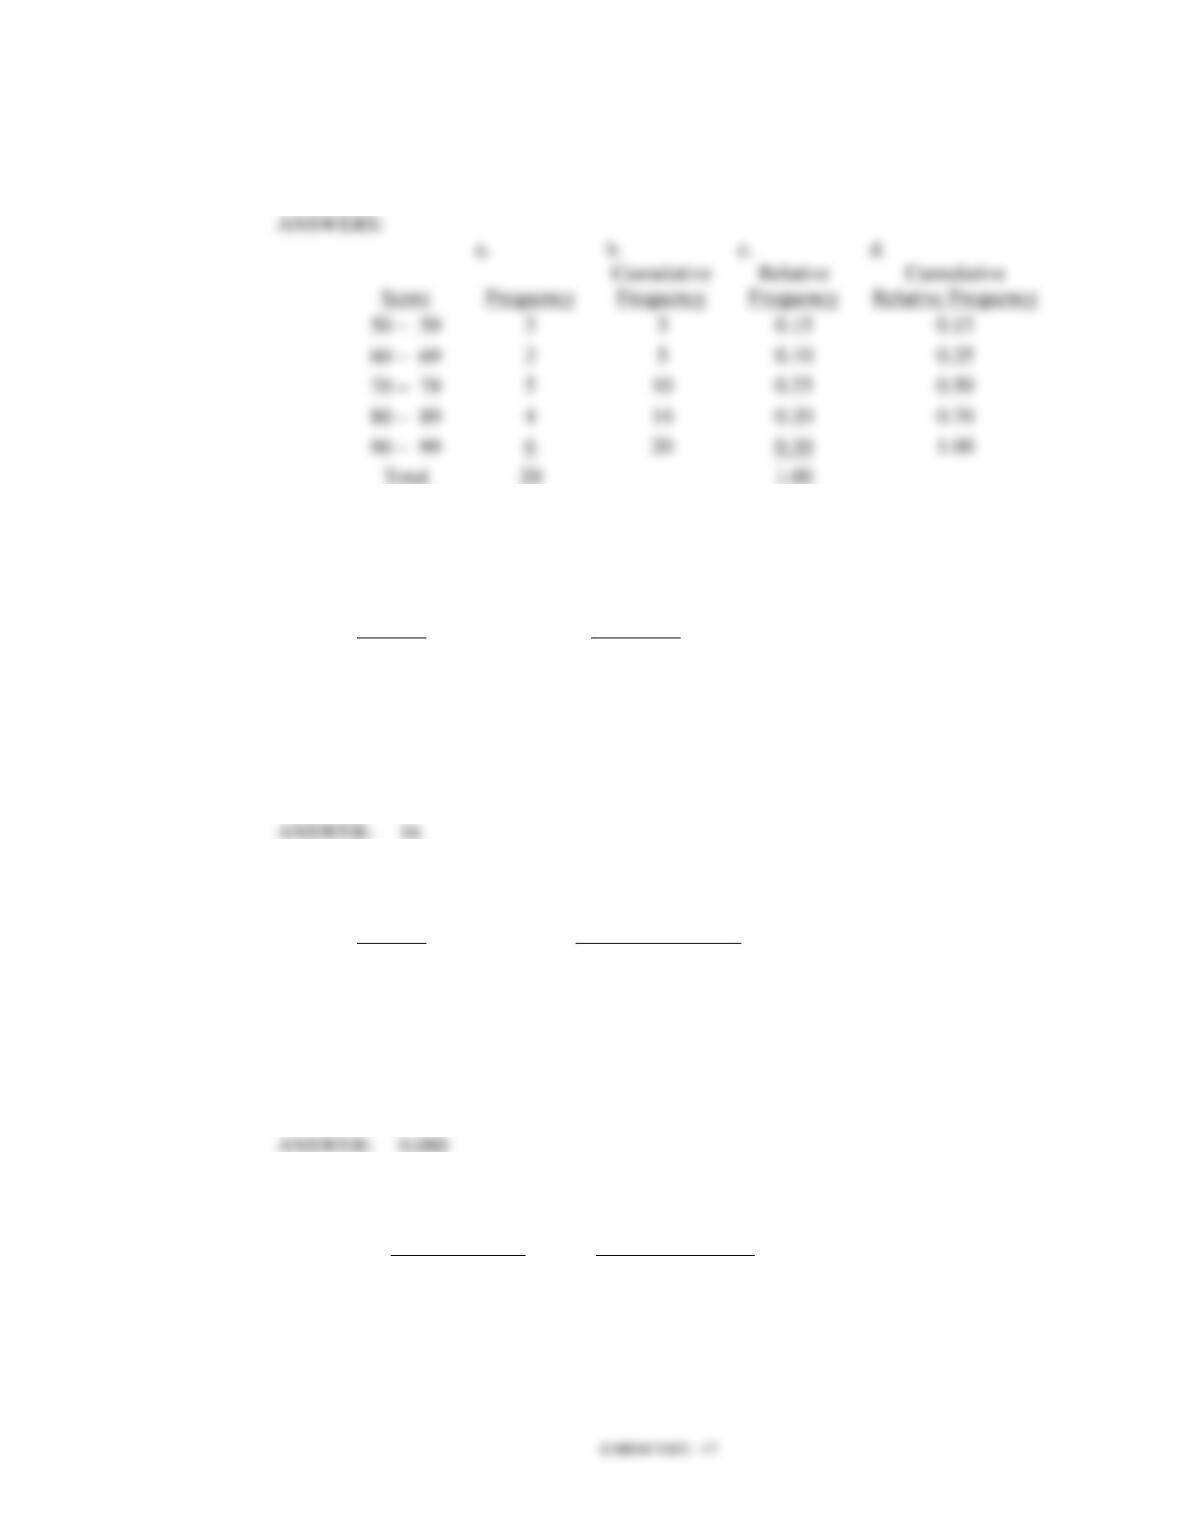
c. Construct a relative frequency distribution.
d. Construct a cumulative relative frequency distribution.
10
14
20
8. Two hundred members of a fitness center were surveyed. One survey item
stated, “The facilities are always clean.” The members’ responses to the item are
summarized below. Fill in the missing value for the frequency distribution.
Opinion
Frequency
Strongly Agree
63
Agree
92
Disagree
Strongly Disagree
15
No Opinion
14
9. Fill in the missing value for the following relative frequency distribution.
Opinion
Relative Frequency
Strongly Agree
0.315
Agree
0.460
Disagree
Strongly Disagree
0.075
No Opinion
0.070
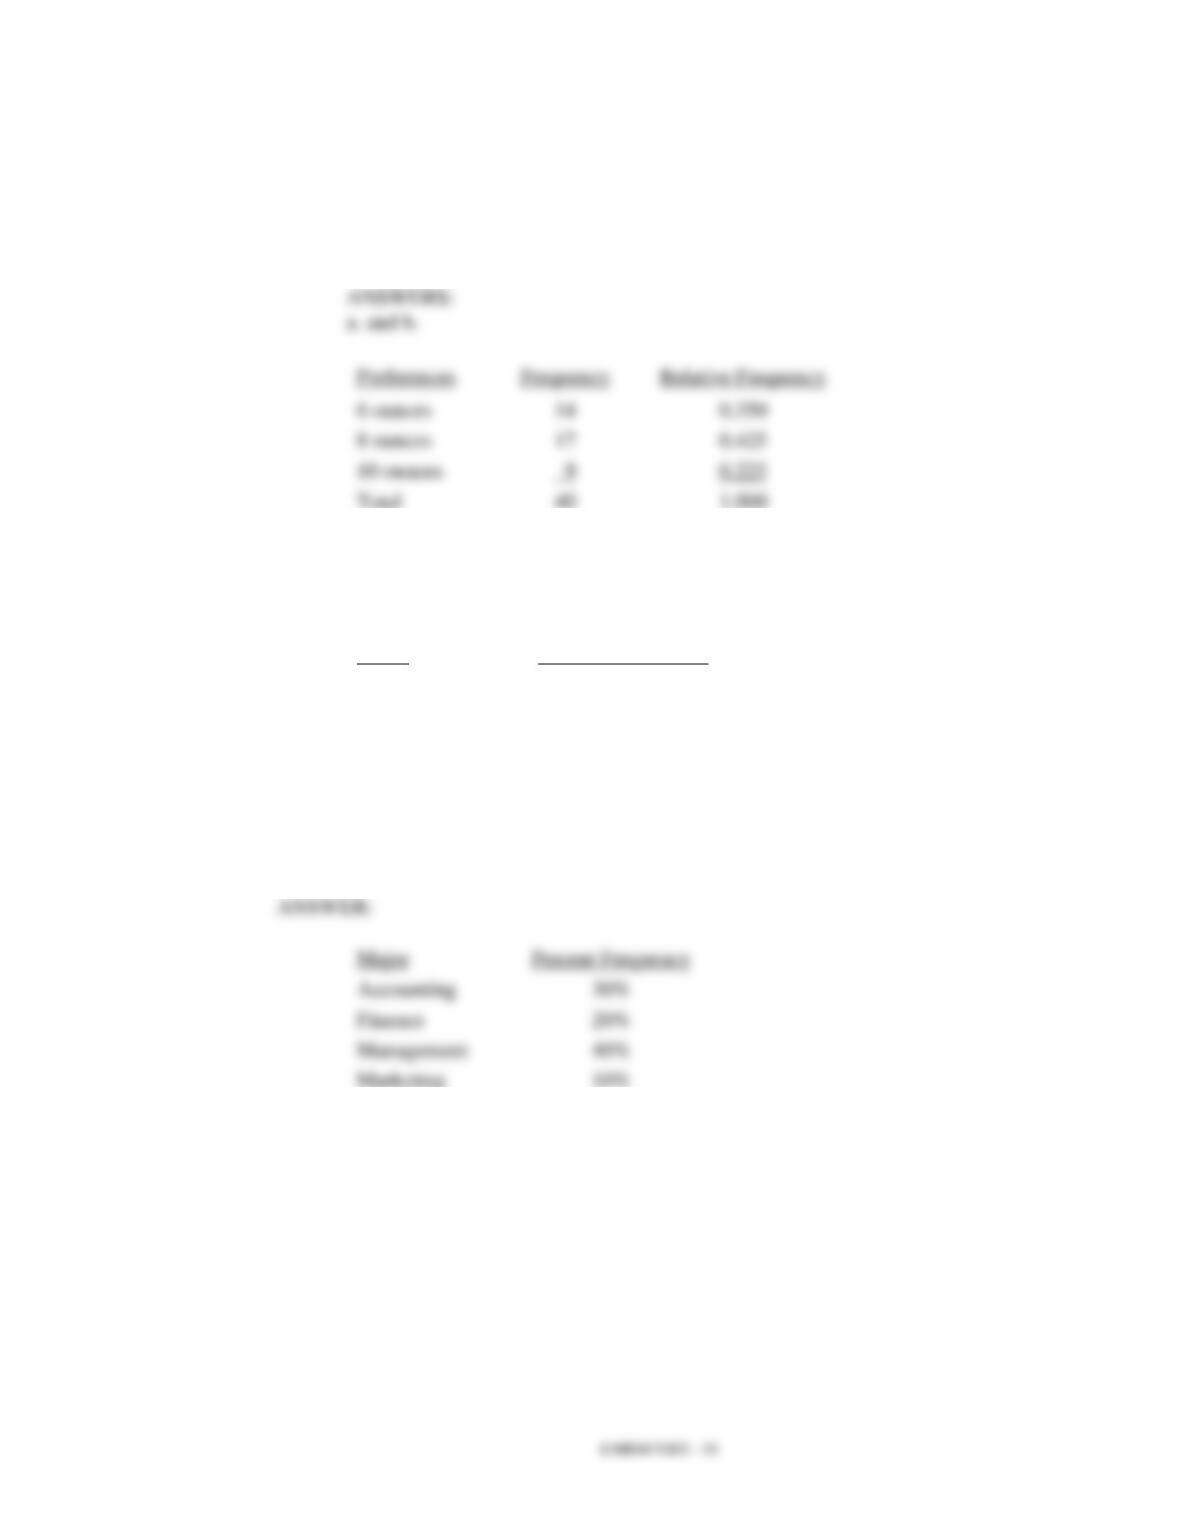
10. Fill in the missing value for the following percent frequency distribution.
Annual Salaries
Percent Frequency
Under $30,000
10
$30,000 – 49,999
35
$50,000 – 69,999
40
$70,000 – 89,999

$90,000 and over
5
11. The following is a summary of the number of hours spent per day watching
television for a sample of 100 people. What is wrong with the frequency
distribution?
Hours/Day
Frequency
0 − 1
10
1 − 3
45
3 − 5
20
5 − 7
20
7 − 9
5
12. A summary of the results of a job satisfaction survey follows. What is wrong
with the relative frequency distribution?
Rating
Relative Frequency
Poor
.15
Fair
.45
Good
.25
Excellent
.30
13. The frequency distribution below was constructed from data collected from a
group of 25 students.
Height in Inches
Frequency
58 − 63
3
64 − 69
5
70 − 75
2
76 − 81
6
82 − 87
4
88 − 93
3
94 − 99
2
a. Construct a relative frequency distribution.
b. Construct a cumulative frequency distribution.
c. Construct a cumulative relative frequency distribution.
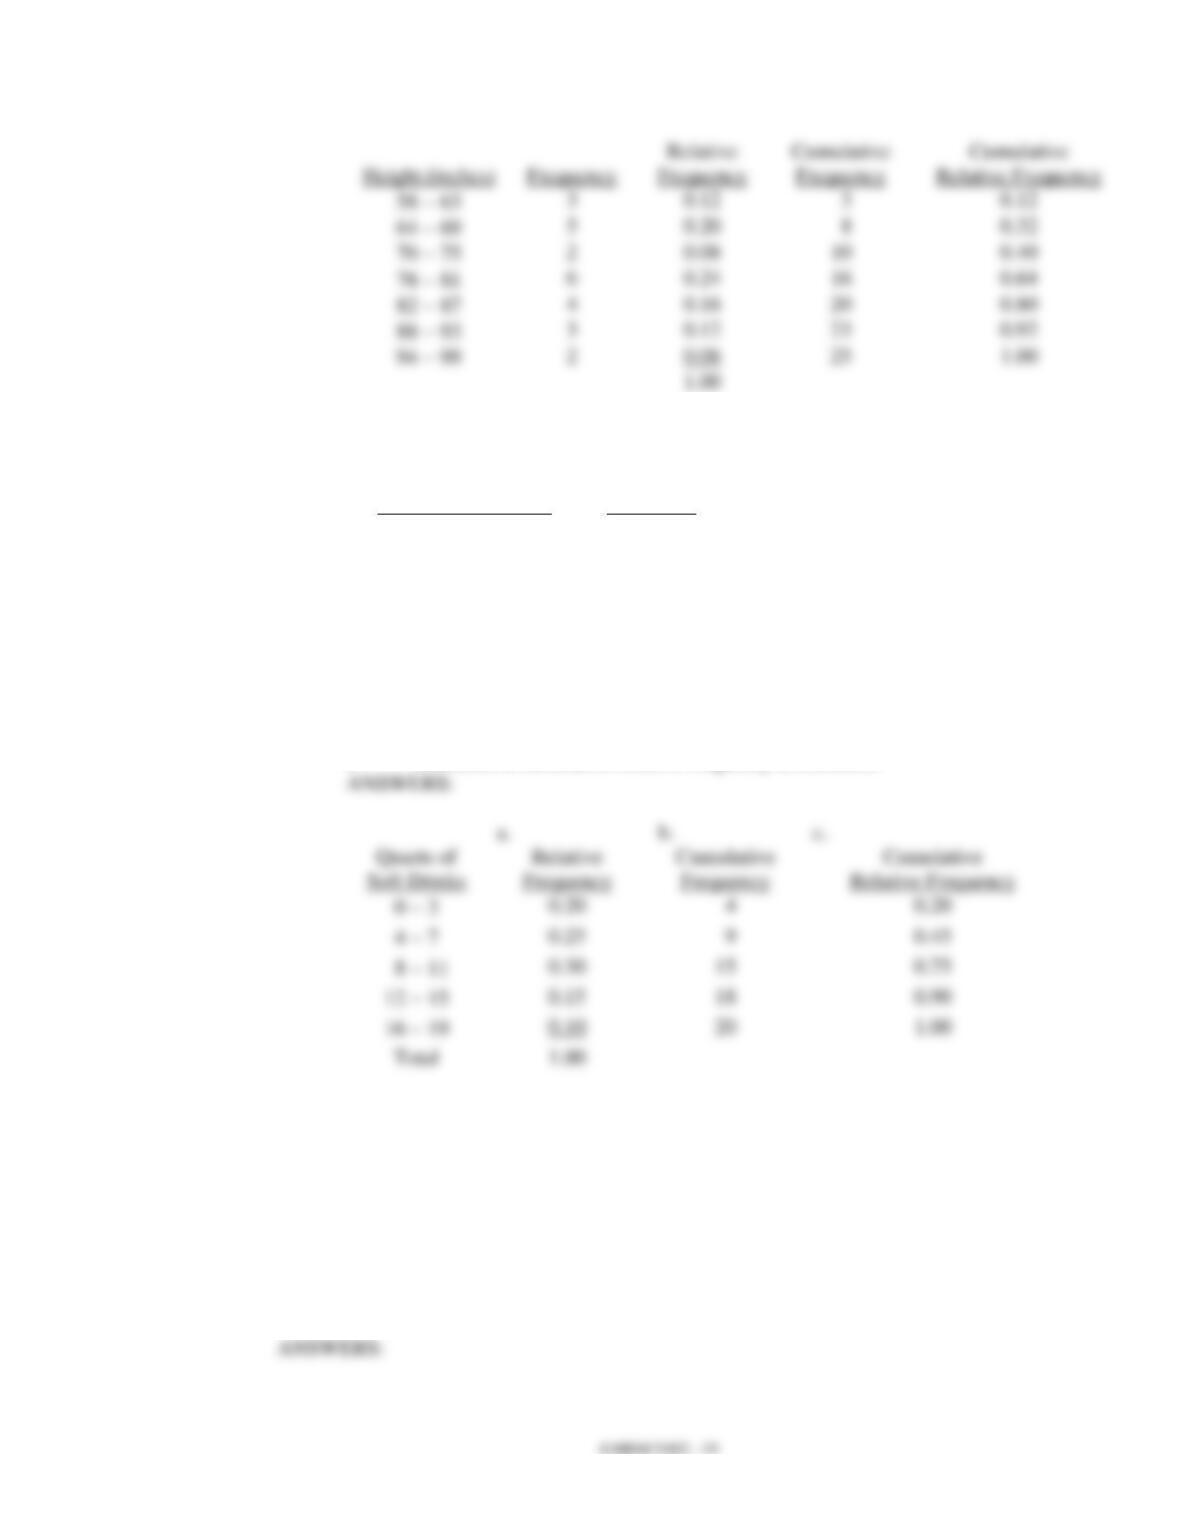
14. The frequency distribution below was constructed from data collected on the
quarts of soft drinks consumed per week by 20 students.
Quarts of Soft Drink
Frequency
0 − 3
4
4 − 7
5
8 − 11
6
12 − 15
3
16 − 19
2
a. Construct a relative frequency distribution.
b. Construct a cumulative frequency distribution.
c. Construct a cumulative relative frequency distribution.
15. The grades of 10 students on their first management test are shown below.
94
61
96
66
92
68
75
85
84
78
a. Construct a frequency distribution. Let the first class be 60 − 69.
b. Construct a cumulative frequency distribution.
c. Construct a relative frequency distribution.
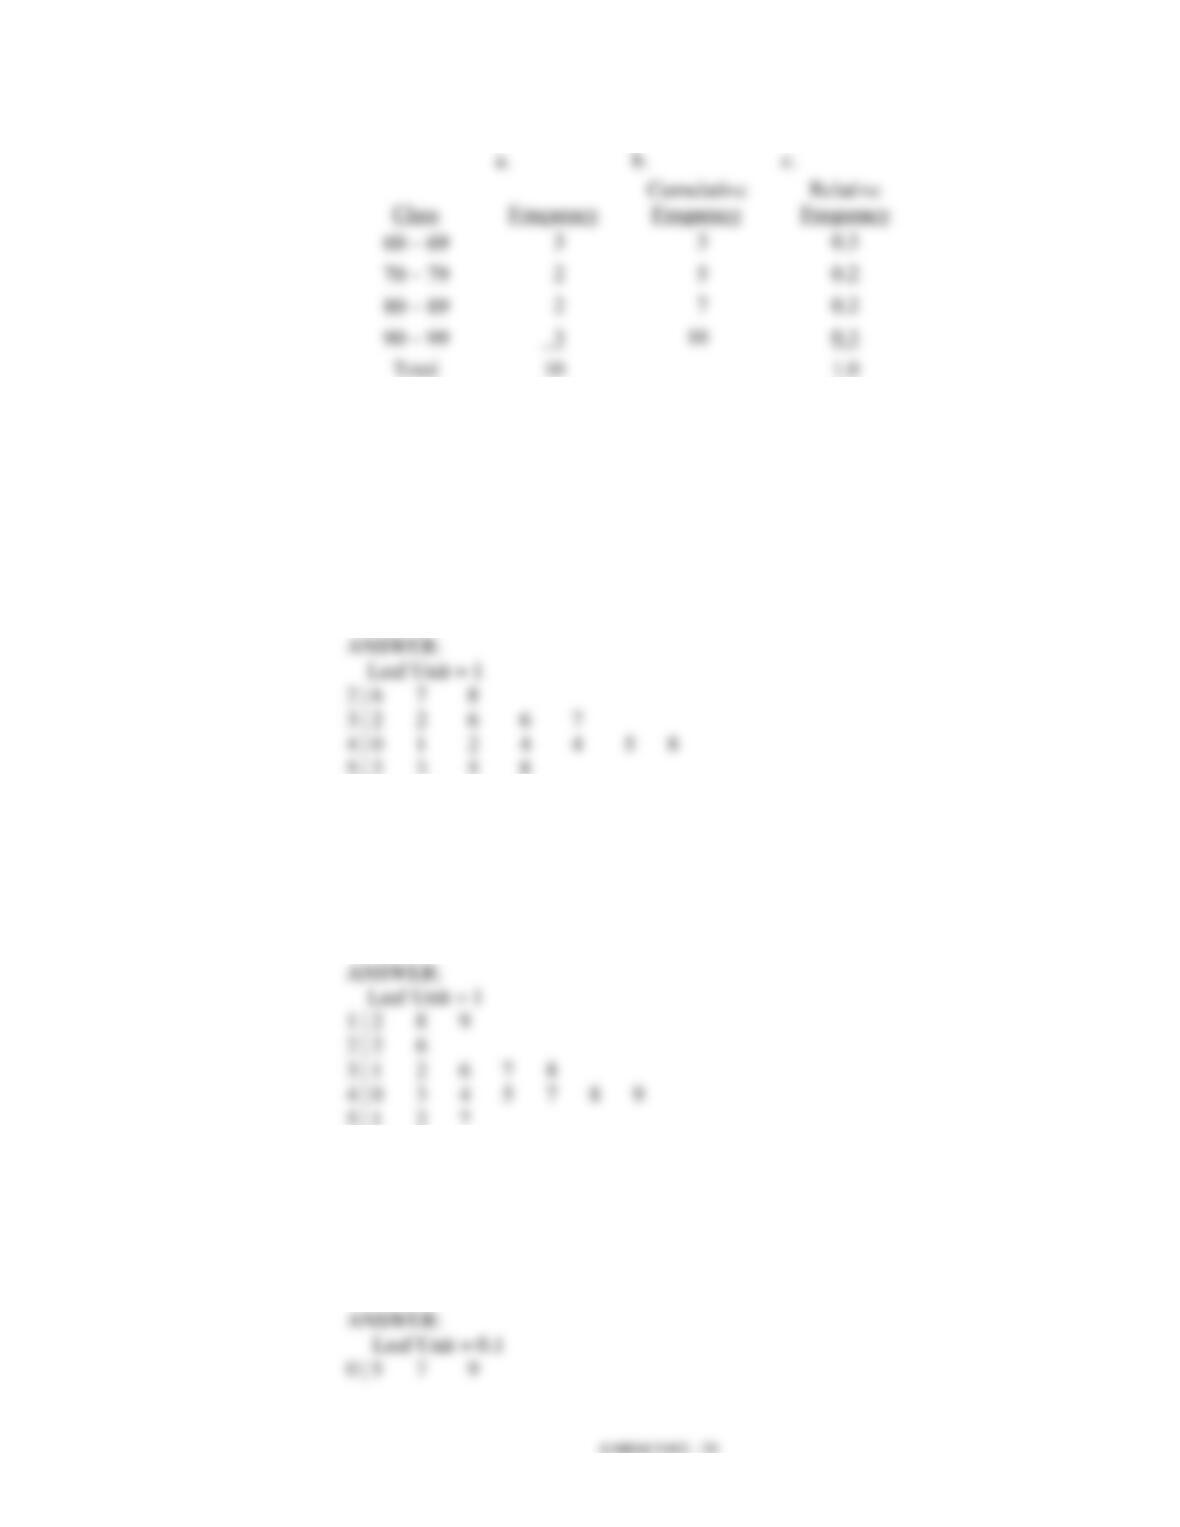
16. You are given the following data on the ages of employees at a company.
Construct a stem-and-leaf display. Specify the leaf unit for the display.
26
32
28
45
58
52
44
36
42
27
41
53
55
48
32
42
44
40
36
37
17. Construct a stem-and-leaf display for the following data. Specify the leaf unit for
the display.
12
52
51
37
47
40
38
26
57
31
49
43
45
19
36
32
44
48
22
18
18. You are given the following data on the earnings per share for ten companies.
Construct a stem-and-leaf display. Specify the leaf unit for the display.
2.6
1.4
1.3
0.5
2.2
1.1
1.1
0.7
0.9
2.0
19. You are given the following data on the annual salaries for eight employees.
Construct a stem-and-leaf display. Specify the leaf unit for the display.
$26,500
$27,850
$25,000
$27,460
$26,890
$25,400
$26,150
$30,000
20. You are given the following data on the price/earnings (P/E) ratios for twelve
companies. Construct a stem-and-leaf display. Specify the leaf unit for the
display.
23
25
39
47
22
37
8
36
48
28
37
26
21. You are given the following data on times (in minutes) to complete a race.
Construct a stem-and-leaf display. Specify the leaf unit for the display.
15.2
15.8
12.4
11.9
15.2
14.7
14.8
11.8
12.0
12.1
22. The SAT math scores of a sample of business school students and their genders
are shown below.
EMBS4 TB02 – 22
SAT Math Scores
Gender
Less than 400
400 up to 600
600 and more
Total
Female
24
168
48
240
Male
40
96
24
160
Total
64
264
72
400
a. How many students scored less than 400?
b. How many students were female?
c. Of the male students, how many scored 600 or more?
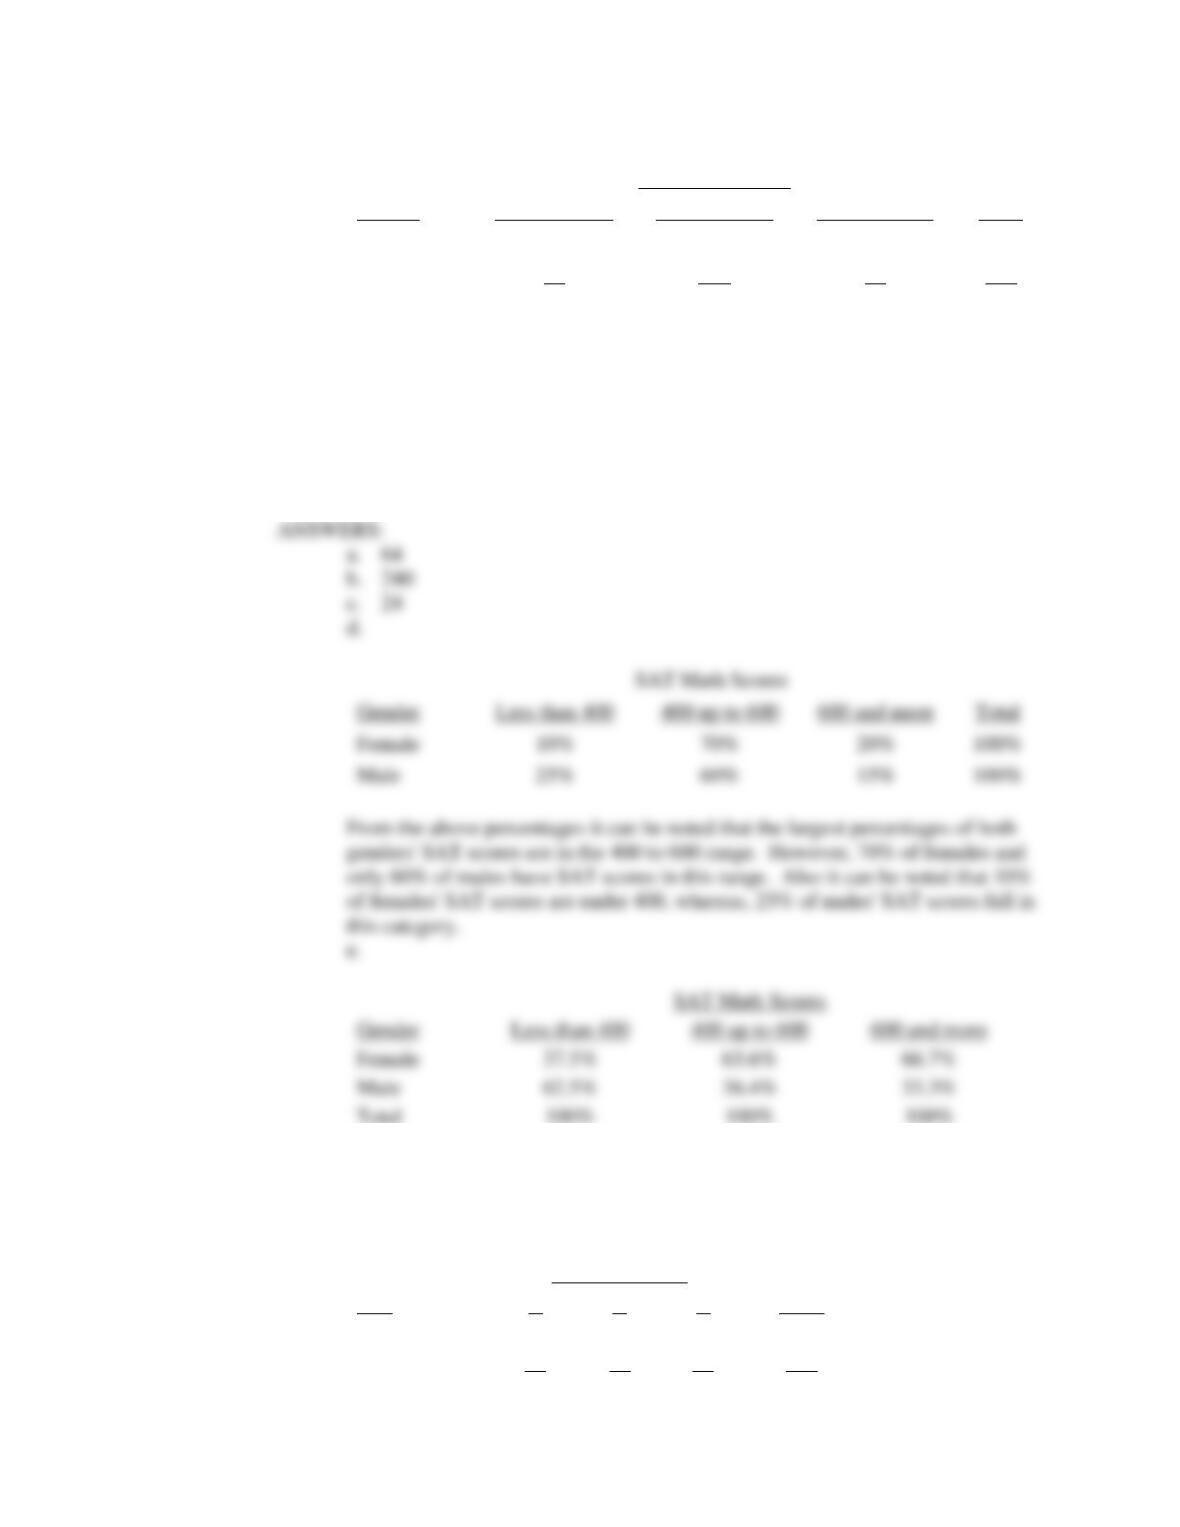
d. Compute row percentages and comment on any relationship that may exist
between SAT math scores and gender of the individuals.
e. Compute column percentages.
23. A market research firm has conducted a study to determine consumer preference
for a new package design for a particular product. The consumers, ages were also
noted.
Package Design
Age
A
B
C
Total
Under 25
18
18
29
65
25 – 40
18
12
5
35
Less than 400
Female
Male
Gender
Less than 400
400 up to 600
600 and more
Female
Male
Total
36
30
34
100
a. Which package design was most preferred overall?
b. What percent of those participating in the study preferred package A?
c. What percent of those under 25 years of age preferred package A?
d. What percent of those aged 25 − 40 preferred package A?
e. Is the preference for package A the same for both age groups?
24. Partial results of a study follow in a crosstabulation of column percentages.
Method of Payment
Gender
Cash
Credit Card
Check
Female
18%
50%
90%
Male
82%
50%
10%
Total
100%
100%
100%
a. Interpret the 18% found in the first row and first column of the
crosstabulation.
b. If 50 of those in the study paid by check, how many of the males paid by
check?
25. For the following observations, plot a scatter diagram and indicate what kind of
relationship (if any) exist between x and y.
x
y
2
7
6
19
3
9
5
17
4
11
26. For the following observations, plot a scatter diagram and indicate what kind of
relationship (if any) exists between women’s height (inches) and annual starting
salary ($1000).
Height
Salary
64
45
63
40
68
39
65
38
67
42
66
45
65
43
64
35
66
33
27. For the following observations, plot a scatter diagram and indicate what kind of
relationship (if any) exists between the amount of sugar in one serving of cereal
(grams) and the amount of fiber in one serving of cereal (grams).
Sugar
Fiber
1.2
3.2
1.3
3.1
1.5
2.8
1.8
2.4
2.2
1.1
2.8
1.3
3.0
1.0
28. What type of graph is depicted below?
0
2
4
6
8
10
12
20 30 40 50
x
y
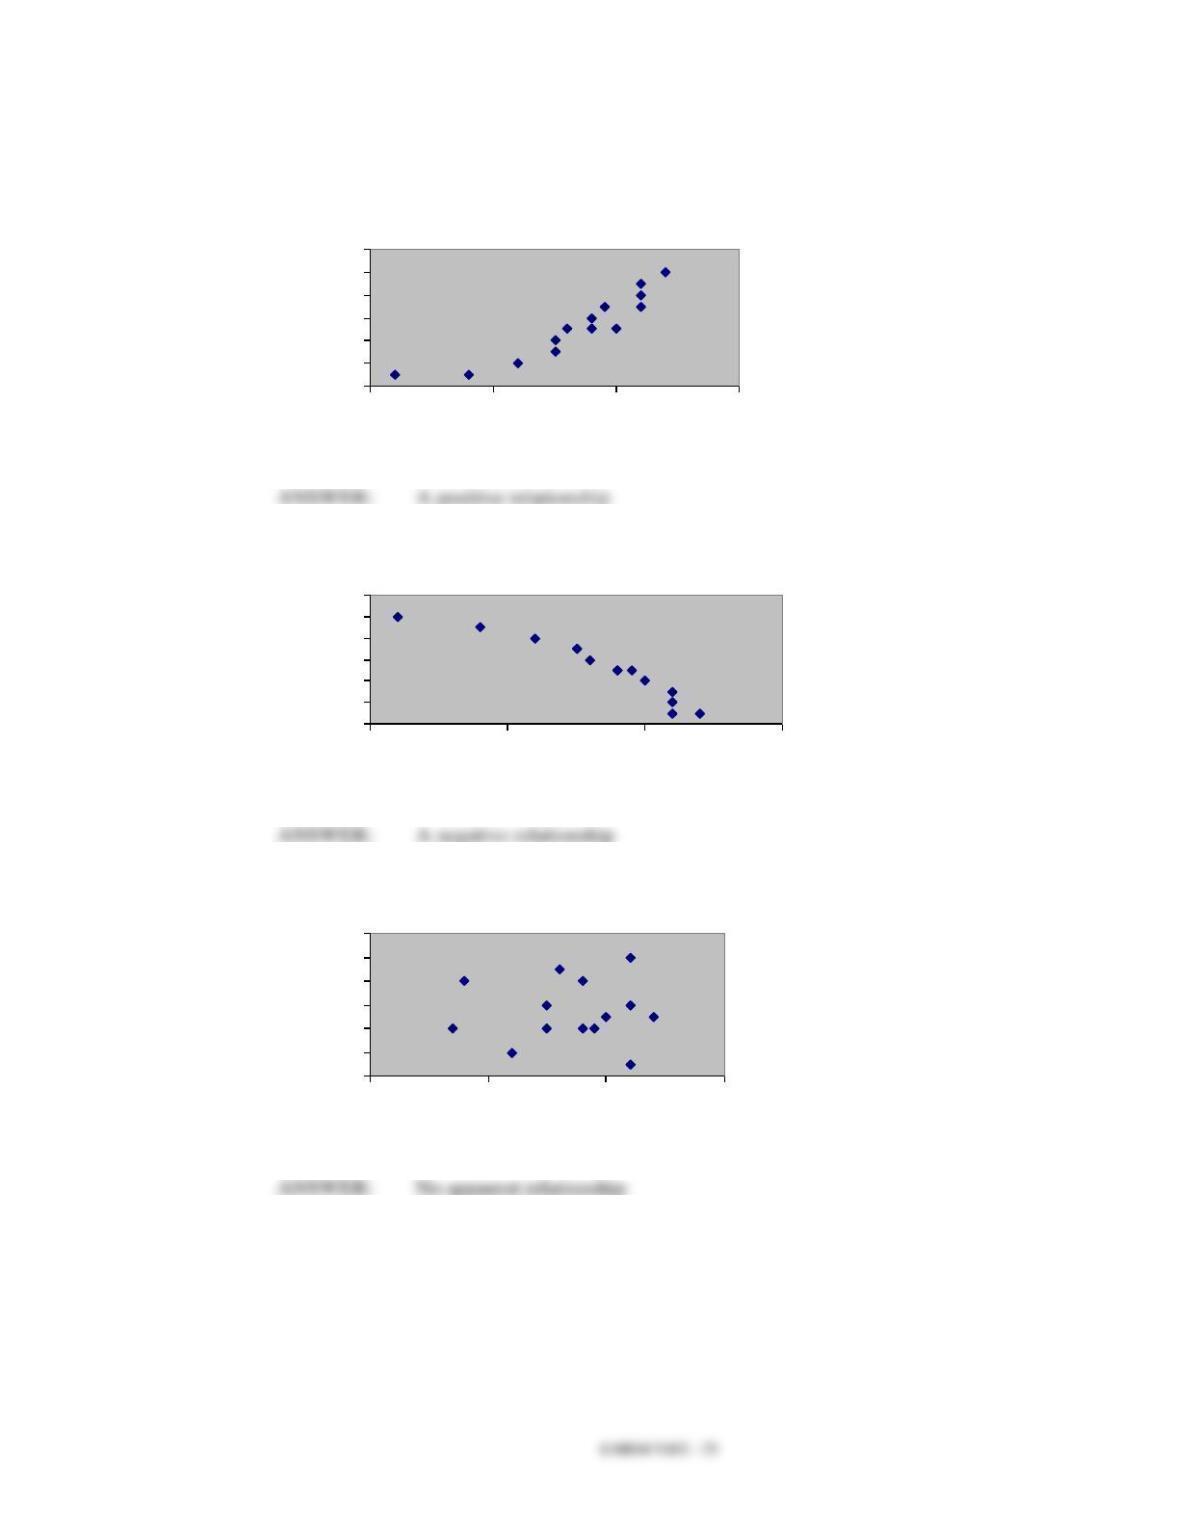
29. What type of relationship is depicted in the following scatter diagram?
0
2
4
6
8
10
12
20 30 40 50
x
y
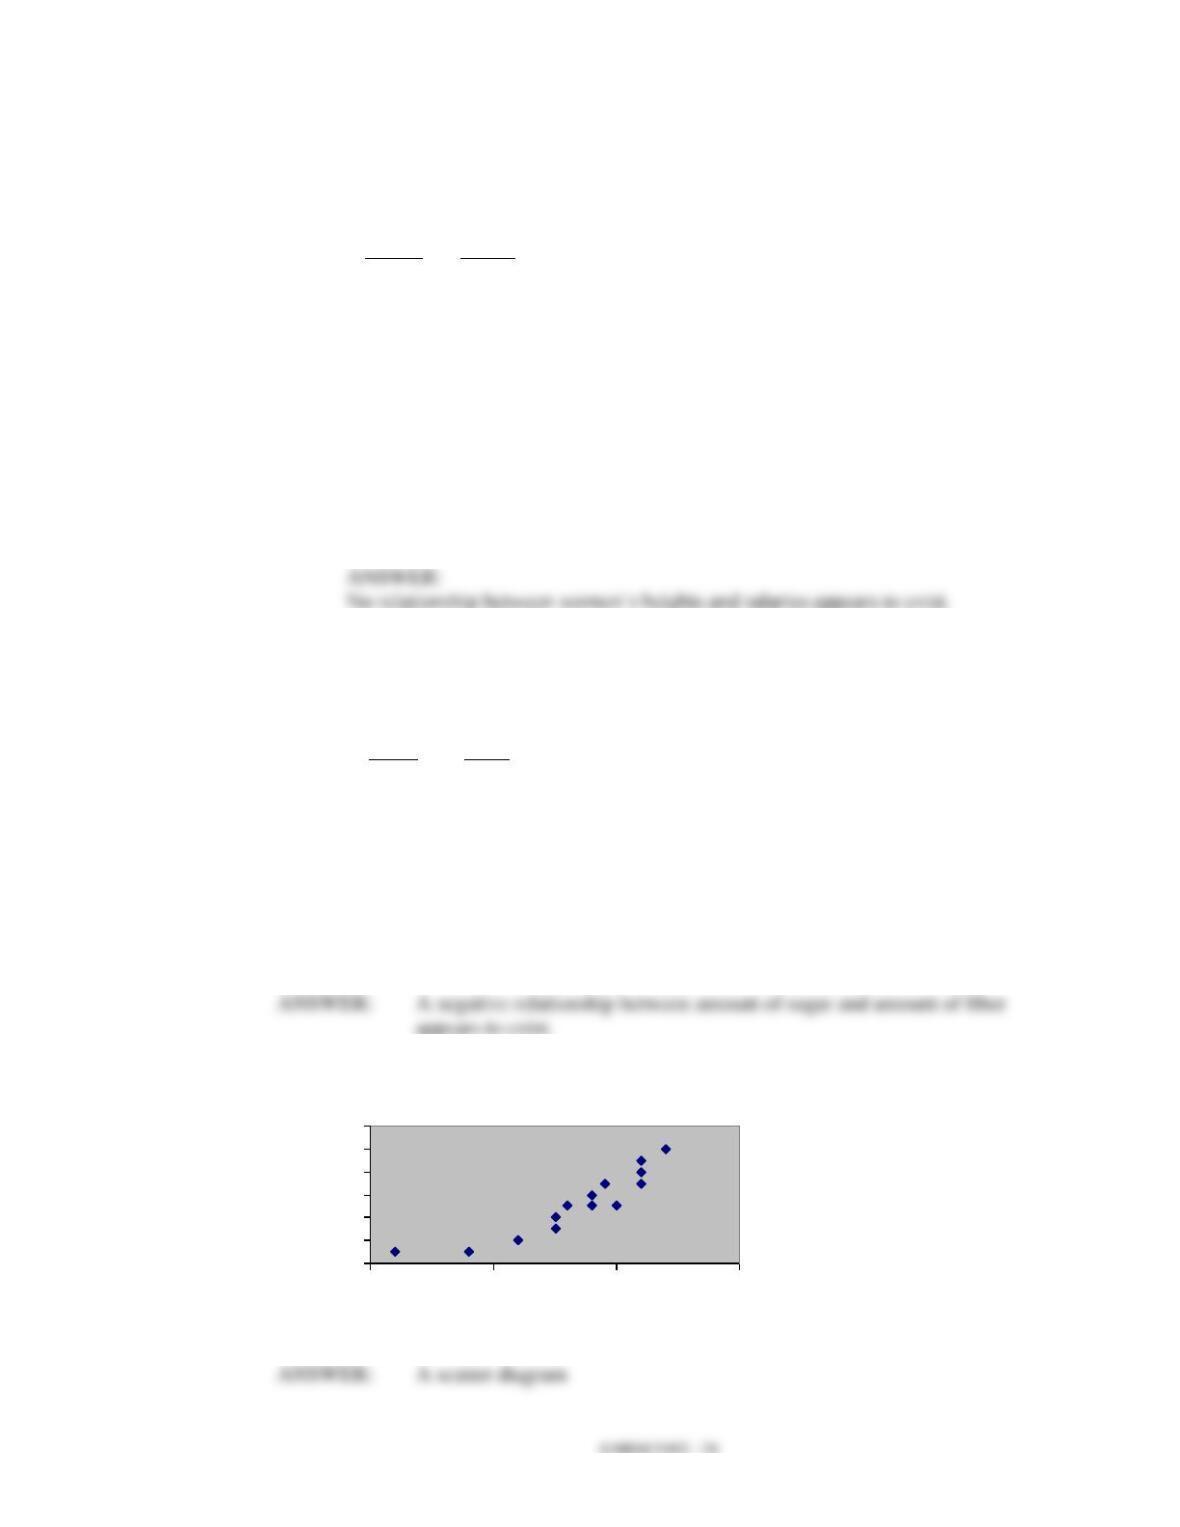
30. What type of relationship is depicted in the following scatter diagram?
0
2
4
6
8
10
12
20 30 40 50
x
y
31. What type of relationship is depicted in the following scatter diagram?
0
2
4
6
8
10
12
20 30 40 50
x
y
32. It is time for Roger Hall, manager of new car sales at the Maxwell Ford
dealership, to submit his order for new Mustang coupes. These cars will be
parked in the lot, available for immediate sale to buyers who are not special-
ordering a car. One of the decisions Roger must make is how many Mustangs of
each color he should order. The new color options are very similar to the past
year’s options.
Roger believes that the colors chosen by customers who special-order their cars
best reflect most customers’ true color preferences. For that reason, he has taken
a random sample of 40 special orders for Mustang coupes placed in the past year.
The color preferences found in the sample are listed below.
Blue
Black
Green
White
Black
Red
Red
White
Black
Red
White
Blue
Blue
Green
Red
Black
Red
White
Blue
White
Red
Red
Black
Black
Green
Black
Red
Black
Blue
Black
White
Green
Blue
Red
Black
White
Black
Red
Black
Blue
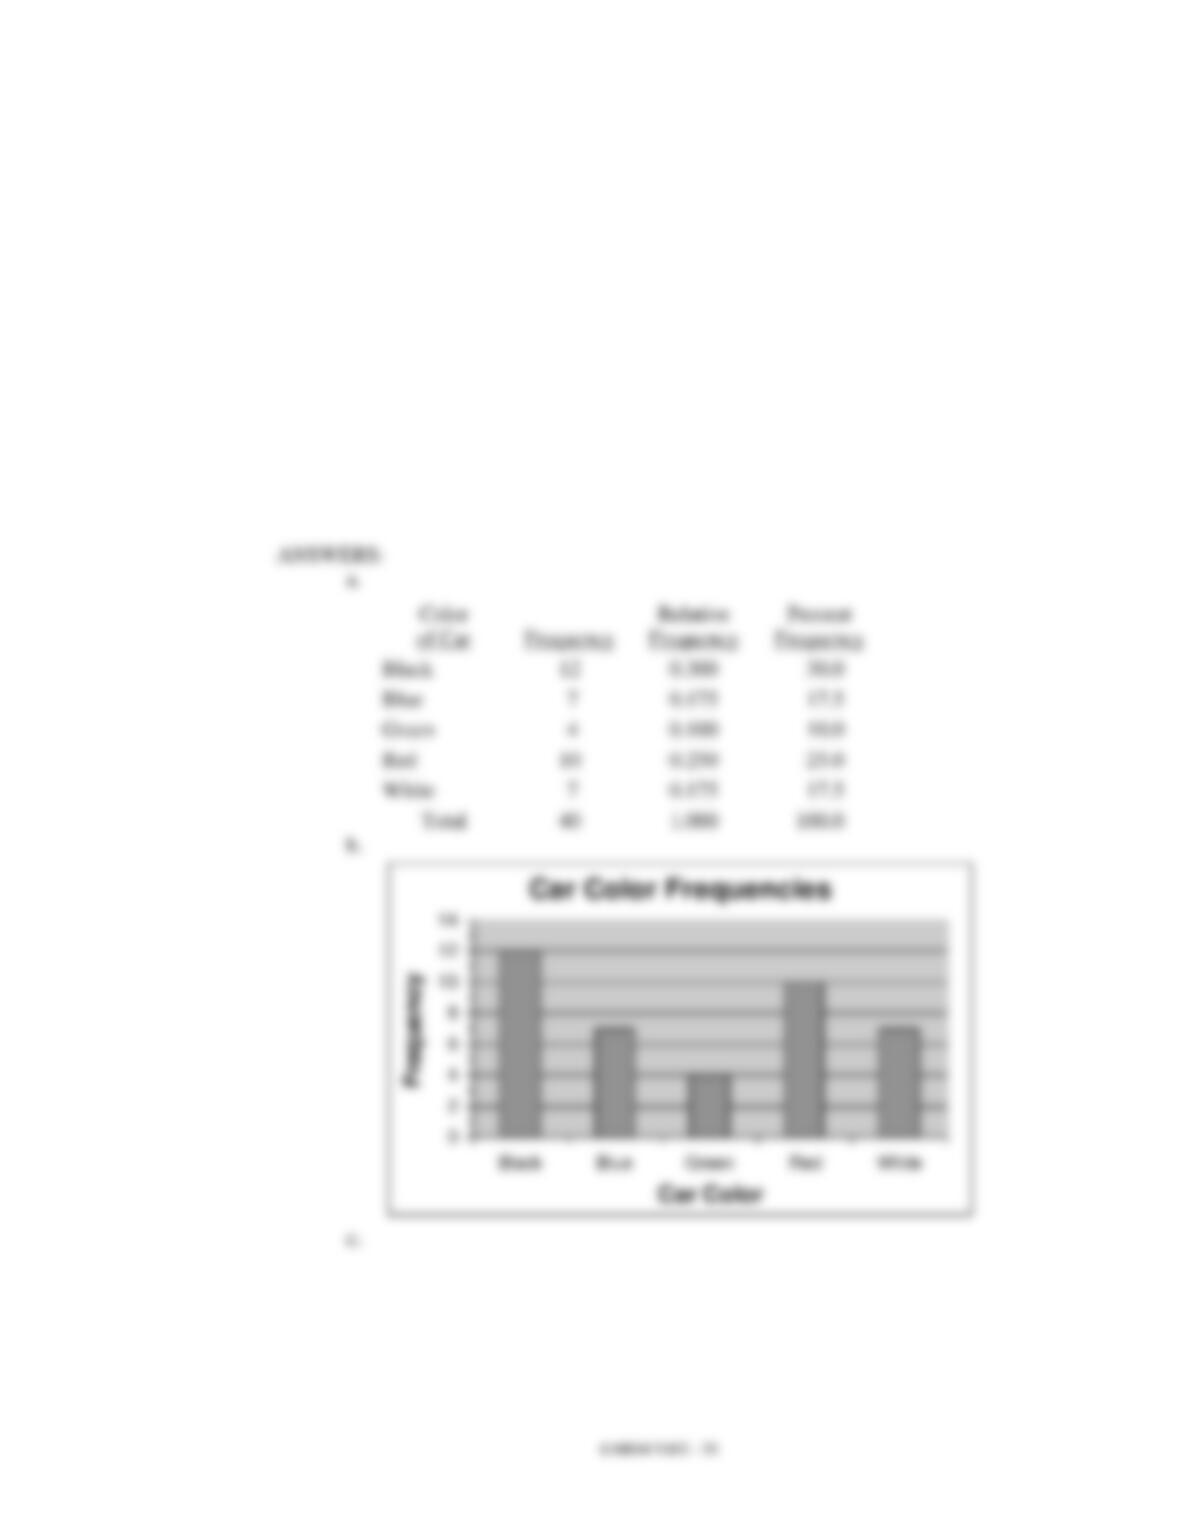
a. Prepare a frequency distribution, relative frequency distribution, and percent
frequency distribution for the data set.
b. Construct a bar graph showing the frequency distribution of the car colors.
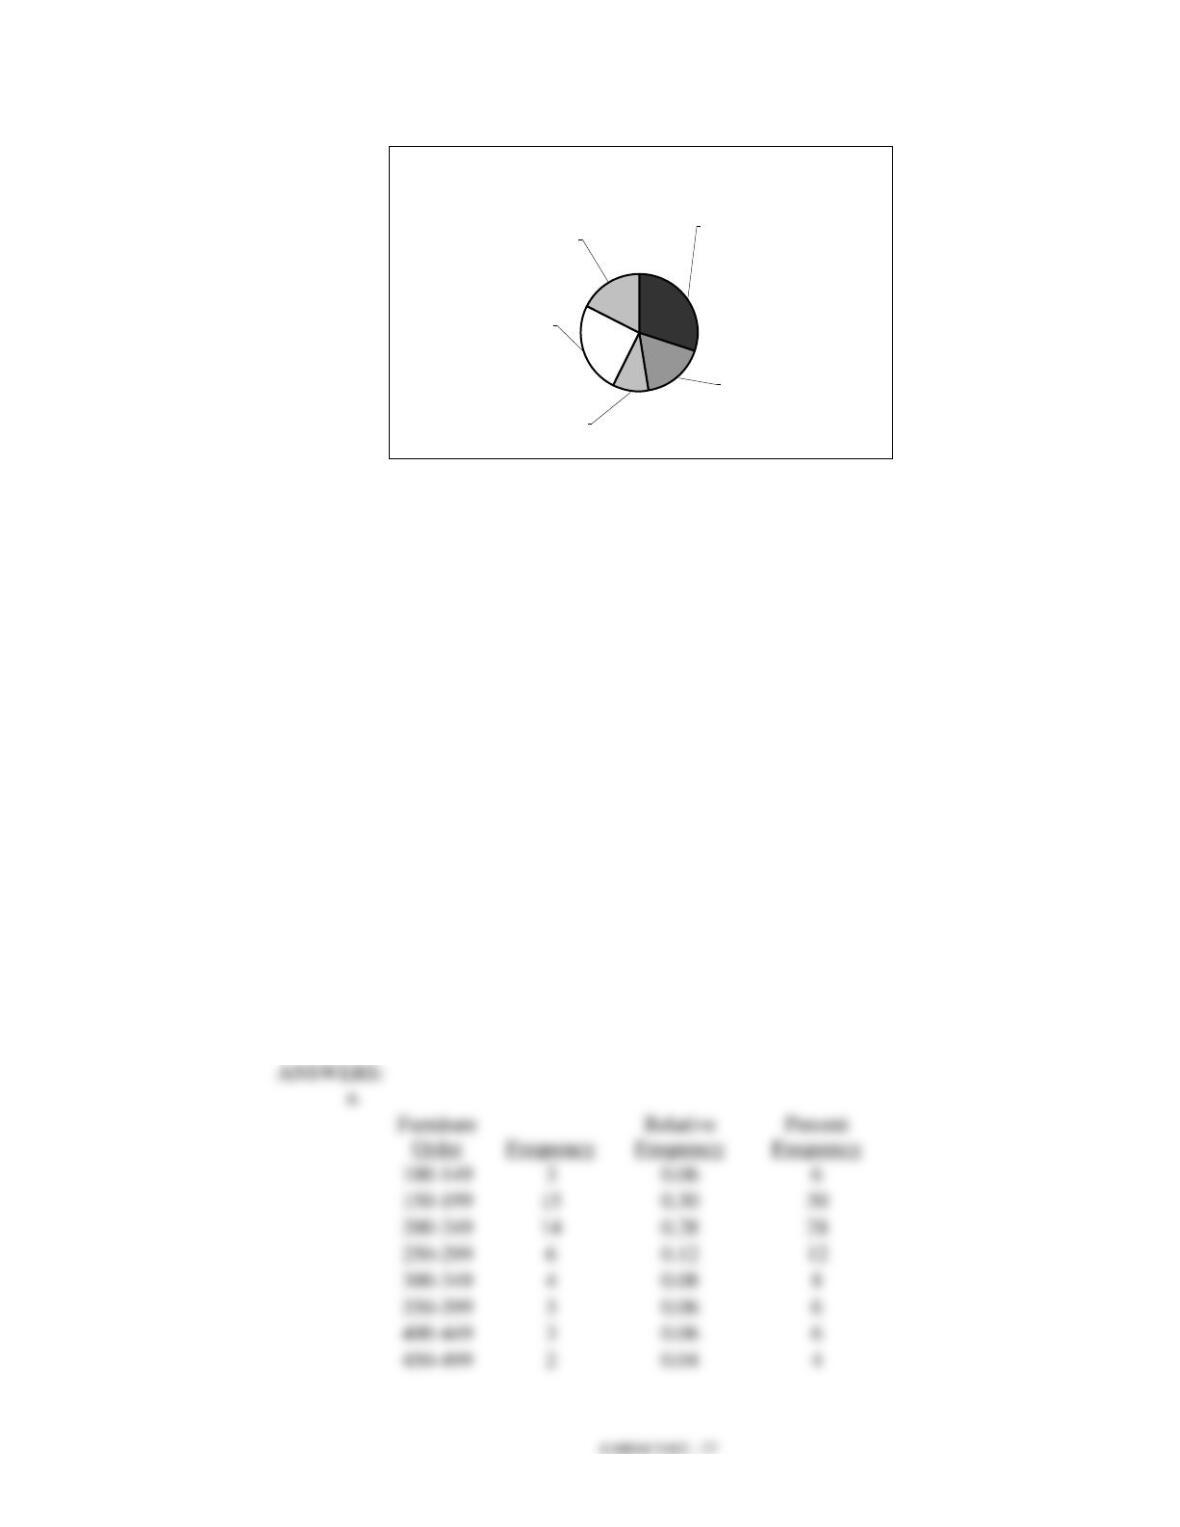
c. Construct a pie chart showing the percent frequency distribution of the car
colors.
Car Color Percent Frequencies
White
17.5%
Green
10.0%
Black
30.0%
Red
25.0%
Blue
17.5%
33. Missy Walters owns a mail-order business specializing in clothing, linens, and
furniture for children. She is considering offering her customers a discount on
shipping charges for furniture based on the dollar-amount of the furniture order.
Before Missy decides the discount policy, she needs a better understanding of the
dollar-amount distribution of the furniture orders she receives.
Missy had an assistant randomly select 50 recent orders that included furniture.
The assistant recorded the value, to the nearest dollar, of the furniture portion of
each order. The data collected is listed below.
136
281
226
123
178
445
231
389
196
175
211
162
212
241
182
290
434
167
246
338
194
242
368
258
323
196
183
209
198
212
277
348
173
409
264
237
490
222
472
248
231
154
166
214
311
141
159
362
189
260
a. Prepare a frequency distribution, relative frequency distribution, and percent
frequency distribution for the data set using a class width of $50.
b. Construct a histogram showing the percent frequency distribution of the
furniture-order values in the sample.
c. Develop a cumulative frequency distribution and a cumulative percent
frequency distribution for this data.
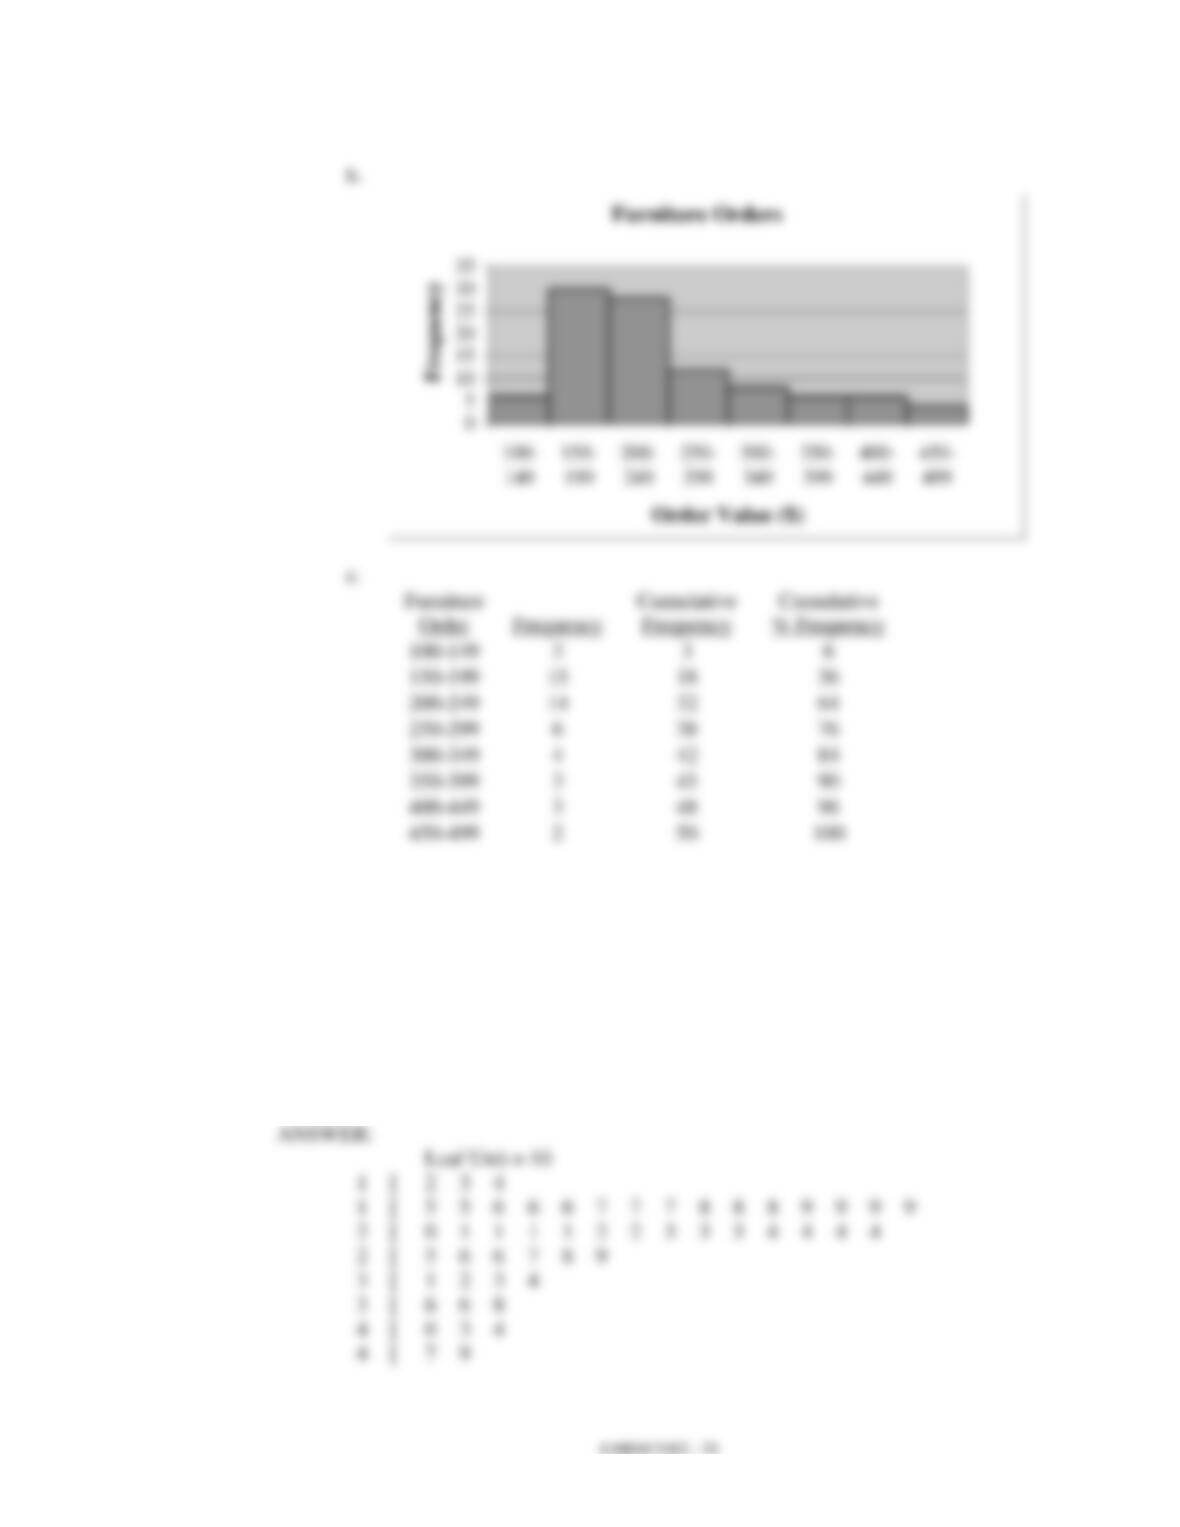
34. Develop a stretched stem-and-leaf display for the data set below, using a leaf unit
of 10.
136
281
226
123
178
445
231
389
196
175
211
162
212
241
182
290
434
167
246
338
194
242
368
258
323
196
183
209
198
212
277
348
173
409
264
237
490
222
472
248
231
154
166
214
311
141
159
362
189
260