Keyton: Communication Research, 5e IM–1
Chapter 9
Descriptive Statistics, Significance Levels, and Hypothesis Testing
Activity: Calculating Percentages
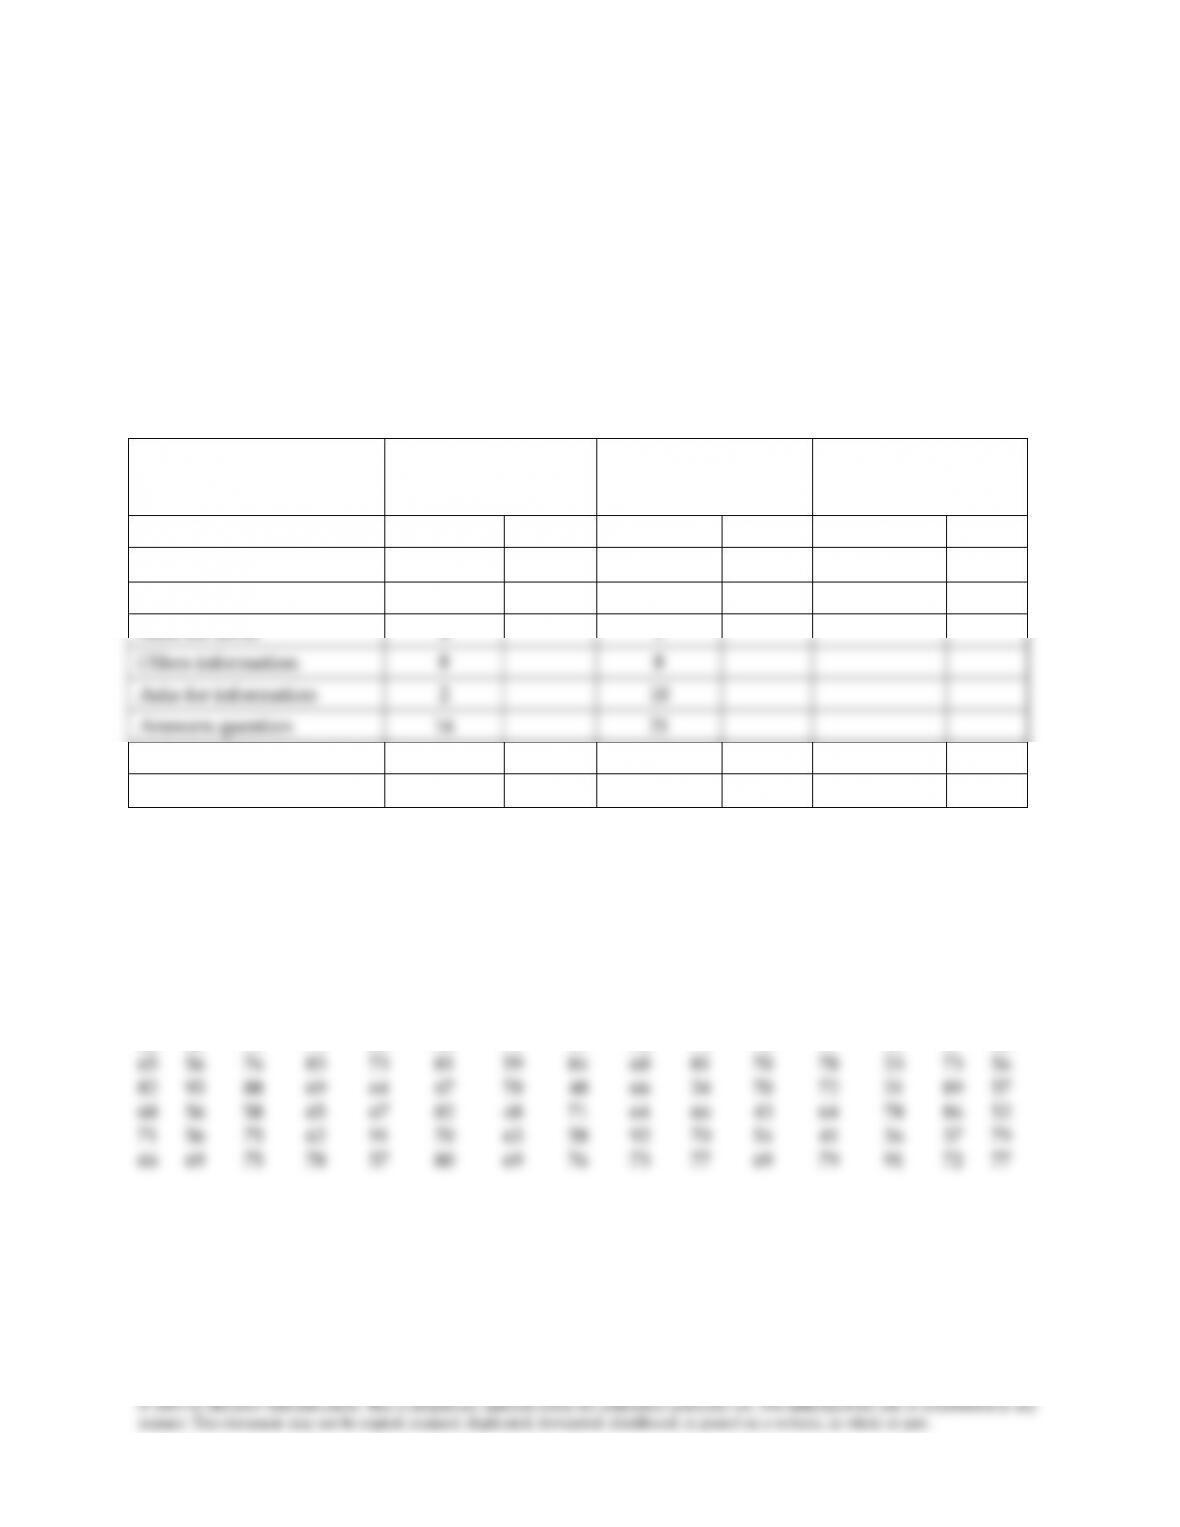
Ask students to calculate the cumulative frequencies and convert all frequencies to percentages for the
frequencies given in the table shown below.
Children’s Interactions
with Parents
Interactions with
Mother
Interactions with
Father
Cumulative
Category
Frequency
%
Frequency
%
Frequency
%
Asks for money
10
7
Asks for help
5
3
Asks for favor
4
1
Offers information
8
8
Asks for information
2
10
Answers question
16
21
Makes positive evaluation
6
6
Makes negative evaluation
4
7
Activity: Creating a Polygon
Ask students to draw the polygon that represents the data set shown below.
83
94
92
64
63
55
62
60
58
61
47
68
64
66
79
49
77
76
65
66
67
68
69
69
88
72
76
69
72
75
63
44
87
72
62
72
82
75
98
90
89
63
69
64
58
82
43
75
76
80
56
71
57
72
71
76
77
83
57
60
65
56
76
83
73
81
59
84
60
81
70
78
53
73
56
82
95
88
69
64
67
70
48
66
54
70
72
51
89
57
68
56
58
65
67
82
48
71
64
66
43
64
78
86
52
71
56
75
62
91
70
65
58
92
70
54
41
56
57
79
66
69
75
78
57
80
69
76
73
77
69
79
91
72
77
If your students are ready, you can also assign them to identify the skewness of the curve and compute
the descriptive statistics.
Keyton: Communication Research, 5e IM–2
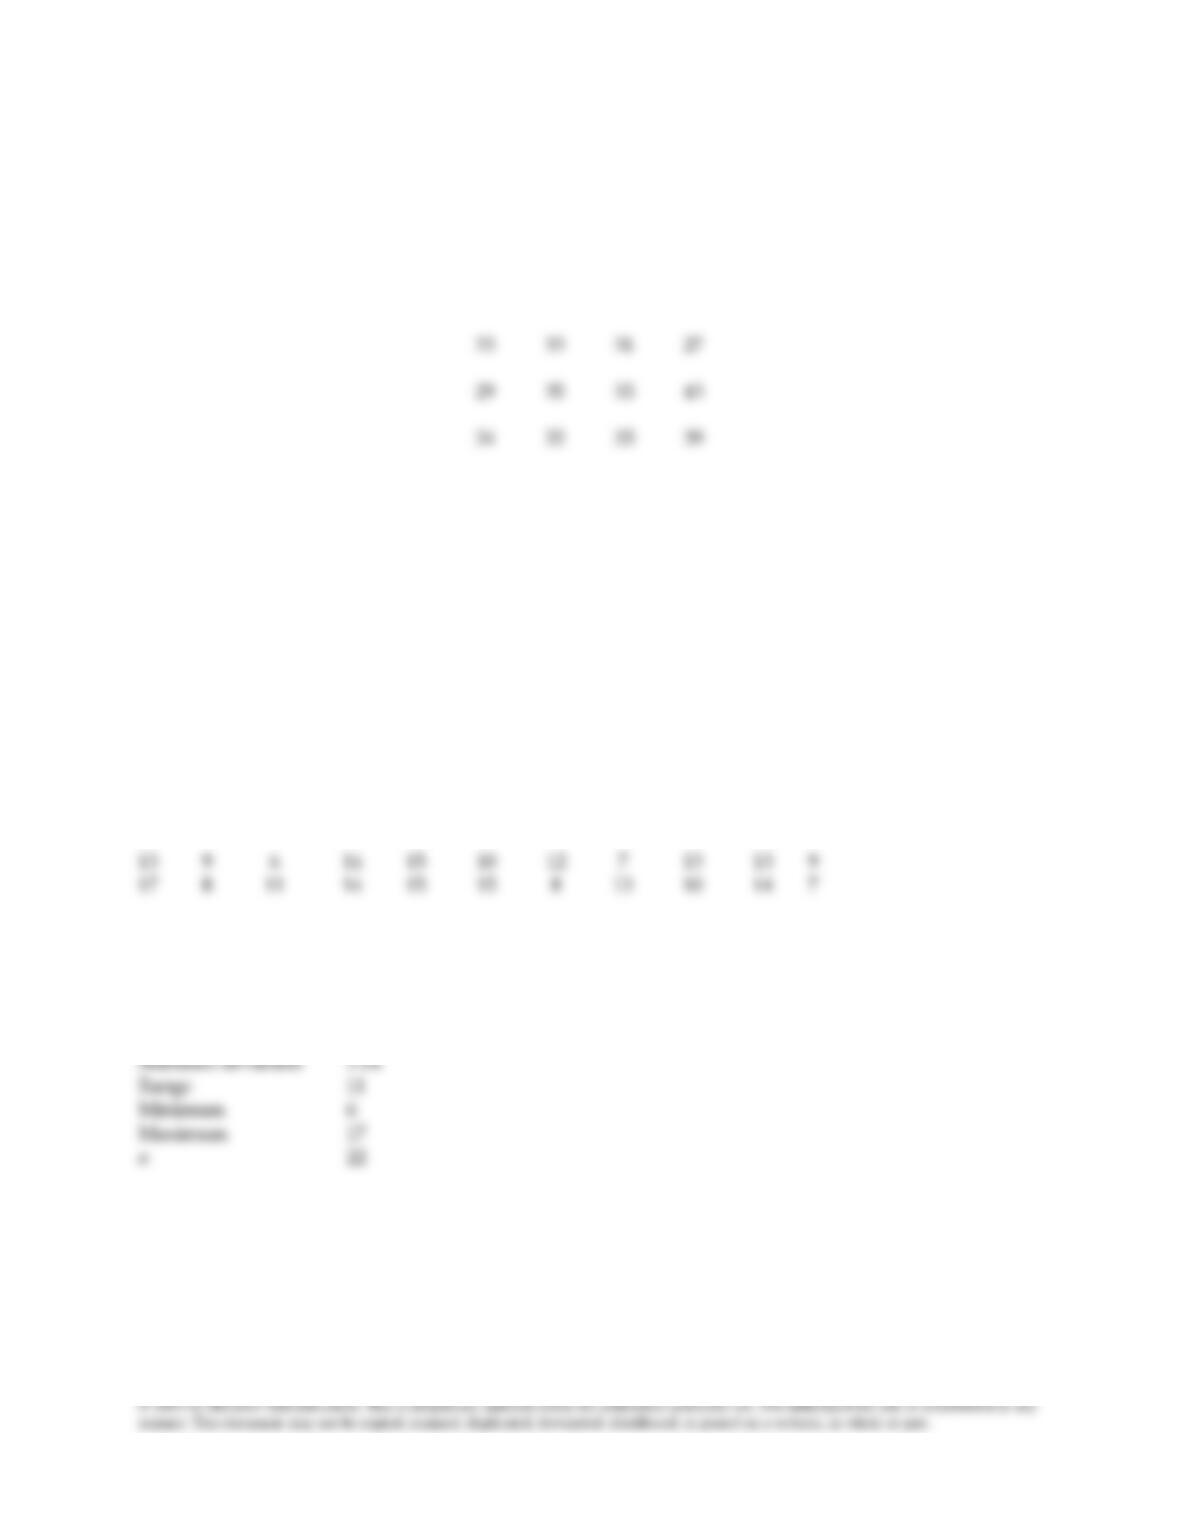
Activity: Calculating Descriptive Statistics
Ask students to compute the mean, median, mode, standard deviation, range, and n for the raw data
shown below.
31 26 27 32
46 38 36 37
Results
Mean 33.95
Median 33.5
Mode 35
Standard deviation 5.11
Range 20
Minimum 26
Maximum 46
n 20
Additional Data Set
13
9
6
14
15
10
12
7
13
13
9
17
8
11
14
15
15
8
13
10
14
7
Results
Mean 11.5
Median 12.5
Mode 13
Keyton: Communication Research, 5e IM–3
Activity: Constructing Frequency Distributions
Ask students to use the date shown below to construct a polygon and to assess the skewness of the
distribution.
X
f
X
f
51
1
37
7
50
1
36
8
49
6
35
3
48
6
34
1
47
11
33
7
46
13
32
3
45
16
31
4
44
8
30
3
43
15
29
4
42
16
28
1
41
13
27
3
40
9
26
2
39
5
25
1
38
3
24
2
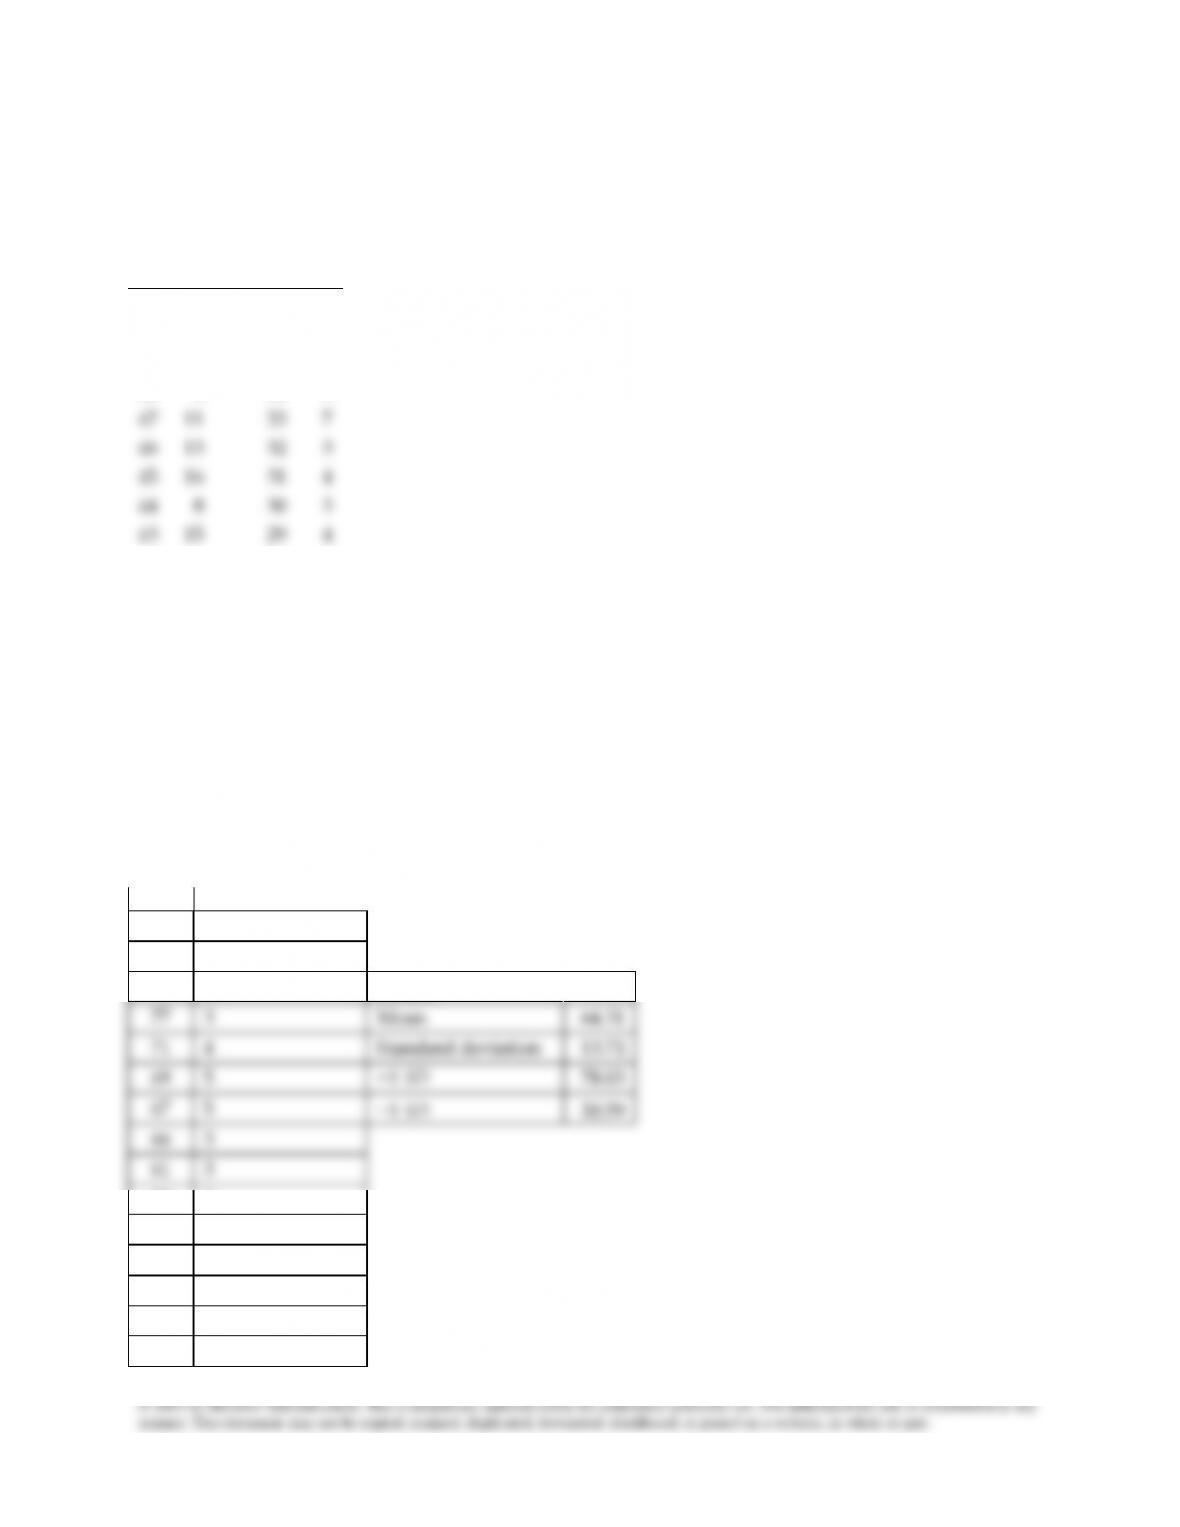
Activity: Using Standard Deviations
Ask students to compute the mean and standard deviation for the data shown below. What scores
indicate +1 and −1 standard deviations? How many scores lay outside the +1 and −1 standard
deviations?
X
f
82
1
81
1
78
3
Results
77
3
Mean
64.31
71
4
Standard deviation
13.72
69
5
+1 SD
78.03
67
5
−1 SD
50.59
66
3
61
3
59
2
43
1
41
2
37
1
34
1
28
1
Keyton: Communication Research, 5e IM–4
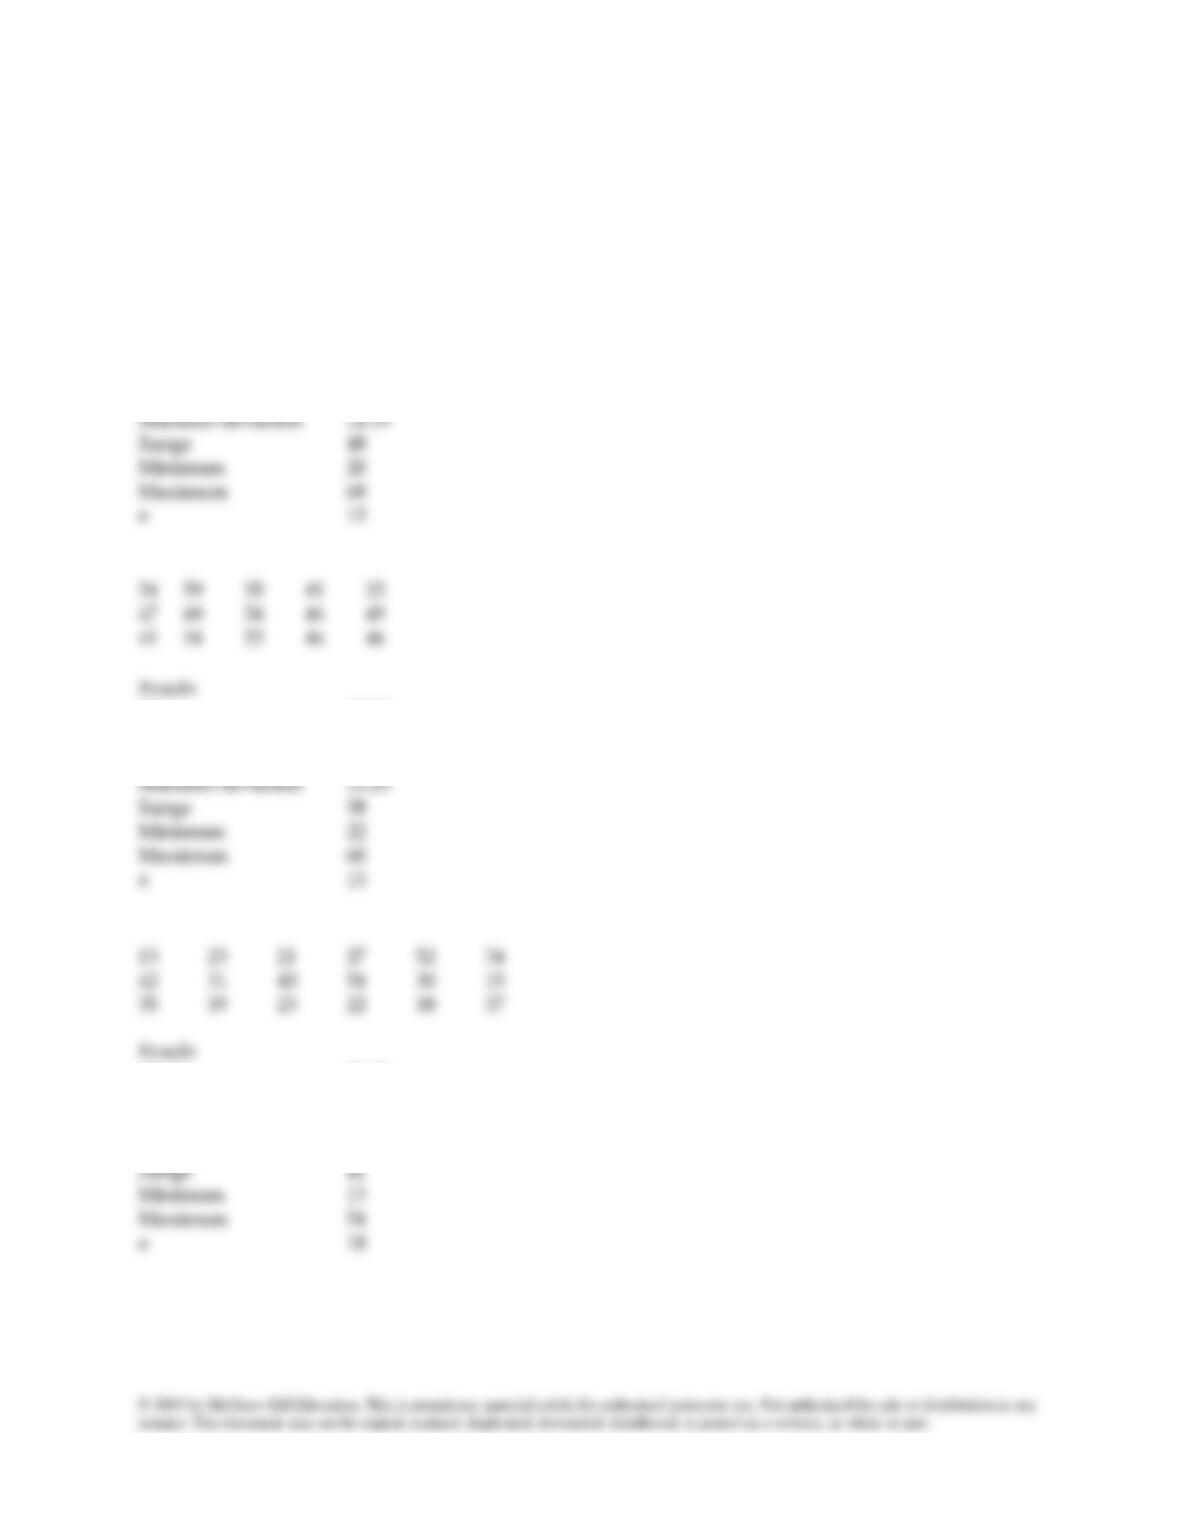
Additional Data Sets
27
25
20
50
58
36
33
31
59
25
37
34
68
44
28
Results
Mean 38.33
Median 34
Mode 25
Mean 43.93
Median 46
Mode 46
Mean 29.78
Median 28.5
Mode 23
Standard deviation 11.95
Keyton: Communication Research, 5e IM–5
Stats Worksheet—Numbers Concepts
(XY)2
The answer is:
For X = 3 and Y = 4
(3 × 4)2 =
(12)2 =
144
For X = 9 and Y = 6
(9 × 6)2 =
( )2 =
XY2
The answer is:
For X = 3 and Y = 4
3(4)2 =
3 × 16 =
48
For X = 9 and Y = 6
9(6)2 =
9 × ( ) =
Working with positive and negative numbers The answer is:
3 – 12 =
− 9
4 – 16 =
− 3 − 12 =
− 15
− 4 – 16 =
(3)(− 12) =
− 36
(4)(− 16) =
(− 3)(− 12) =
36
(− 4)(− 12) =
(− 2)2 =
4
(− 4)2 =
Working with zeros The answer is:
(2)(0) =
0
(4)(0) =
Working with square roots The answer is:
4
= 2
16
=
Working with fractions and decimals The answer is:
Convert 1⁄ 4 to a decimal
1 divided by 4 =
.25
Convert 1⁄ 5 to a decimal
( ) divided by ( ) =
Convert .25 to a percentage
.25 × 100 =
25%
Convert .40 to a percentage
( ) × ( ) =
Keyton: Communication Research, 5e IM–6
Answer Key for Stats Worksheet—Numbers Concepts
(XY)2 The answer is:
For X = 3 and Y = 4
(3 × 4)2 =
(12)2 =
144
For X = 9 and Y = 6
(9 × 6)2 =
(54)2 =
2916
(XY)2 The answer is:
For X = 3 and Y = 4
3(4)2=
3 × 16 =
48
For X = 9 and Y = 6
9(6)2=
9 × (36) =
324
Working with positive and negative numbers The answer is:
3 – 12 =
− 9
4 – 16 =
− 12
− 3 − 12 =
− 15
− 4 – 16 =
− 20
(3)(− 12) =
− 36
(4)(− 16) =
− 64
(− 3)(− 12) =
36
(− 4)(− 12) =
48
(− 2)2=
4
(− 4)2 =
16
Working with zeros The answer is:
(4)(0) = 0
Working with square roots The answer is:
4
= 2
16
= 4
Working with fractions and decimals The answer is:
Convert 1⁄ 4 to a decimal
1 divided by 4 =
.25
Convert 1⁄ 5 to a decimal
(1) divided by (5) =
.20
Convert .25 to a percentage
.25 × 100 =
25%
Convert .40 to a percentage
(.40) × (100) =
40%
Keyton: Communication Research, 5e IM–7
Stats Worksheet—Descriptive Statistics
1. In a study of the credibility of television news compared with the credibility of print news, a
sample of adults used the scale shown
“Television news is more trustworthy than corresponding news reported in the newspaper.”
Strongly disagree
Disagree
Undecided
Agree
Strongly agree
1
2
3
4
5
Responses from the participants were as follows:
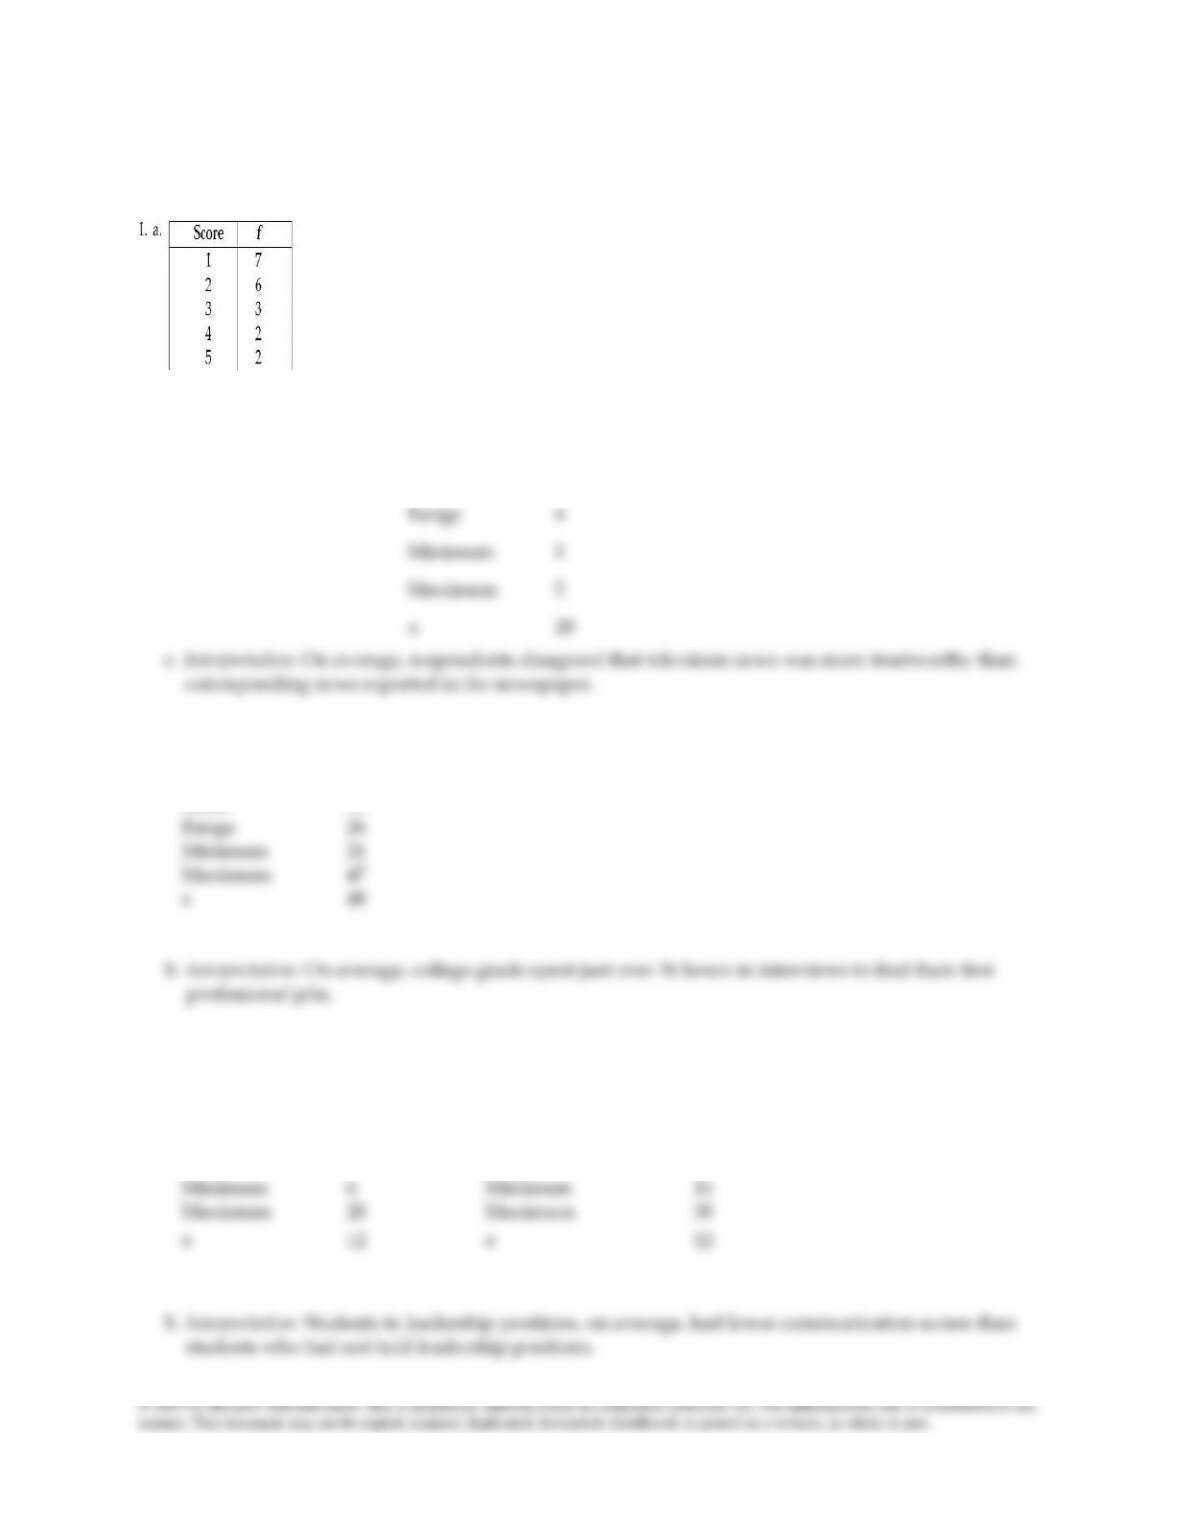
a. Construct a frequency distribution.
b. Determine the mean, median, mode, and range.
c. Write an interpretation of the mean.
2. College grads kept track of how many hours they spent in interviews to find their first professional
jobs. They reported their interview times as follows:
41
33
21
41
36
37
27
34
36
36
36
36
39
33
40
47
29
41
28
39
30
44
41
39
45
30
26
27
21
46
40
47
46
47
35
24
35
34
35
38
38
38
38
43
37
37
36
37
a. Determine the n, mean, median, and range.
b. Write an interpretation for these data.
3. Two groups of students were tested for their levels of communication apprehension. The group of
students who had been leaders in high school (e.g., cheerleaders, sports team captains, student
government leaders) reported their communication apprehension scores as follows:
a. Determine the n, mean, range, and standard deviation for both groups of students.
b. Write an interpretation comparing these two groups of data.
4. Draw the normal curve identifying where the mean and +1, +2, +3, − 1, − 2, and − 3 standards would
be placed.
5. A positively skewed curve means that
6. A negatively skewed curve means that
Keyton: Communication Research, 5e IM–8
Answer Key for Stats Worksheet—Descriptive Statistics
b. Results
Mean 2.3
Median 2
Mode 1
2. a. Results
Mean 36.33
Median 37
Mode 36
3. a. Leadership Students Results Nonleadership Students Results
Mean 14.75 Mean 19.92
Median 15 Median 17.5
Standard deviation 4.07 Standard deviation 5.63
Range 14 Range 16
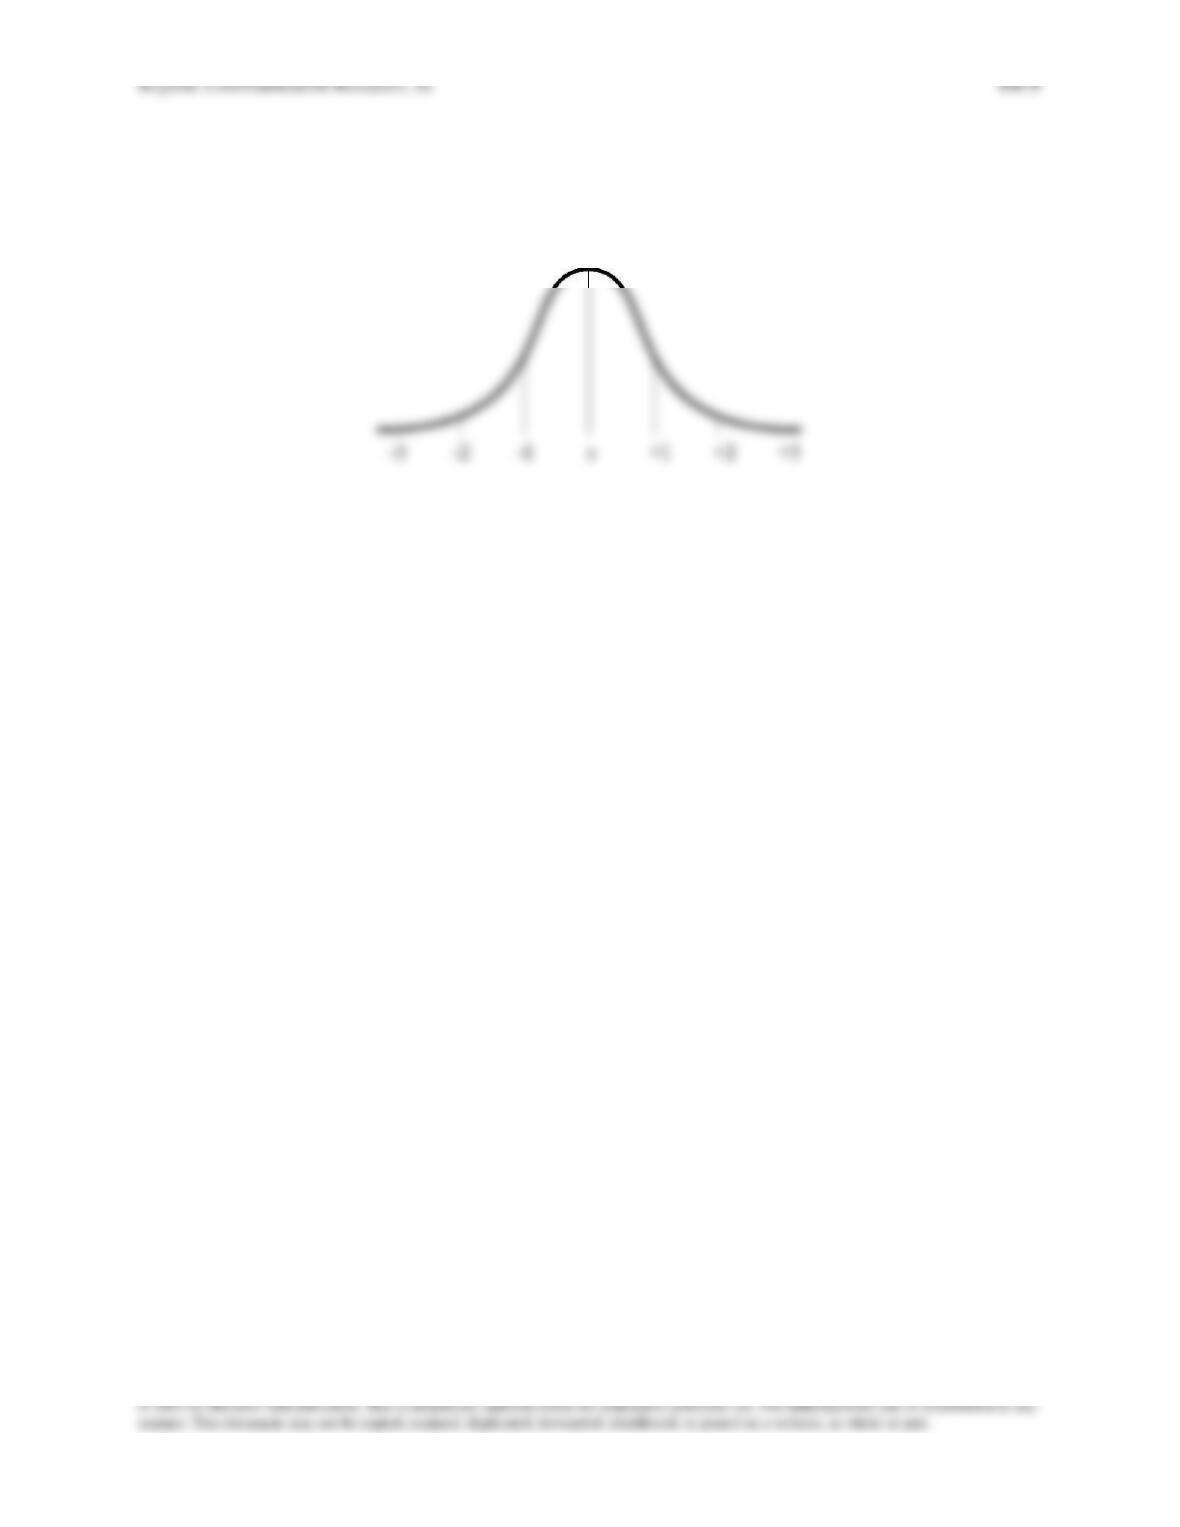
4.
5. A positively skewed curve means that there are very few very high scores.
6. A negatively skewed curve means that there are very few very low scores.
Keyton: Communication Research, 5e IM–10
Worksheet—Significance Levels and Hypothesis Testing
2. In what way does statistical significance differ from social or practical significance?
3. Fill in the blanks: A researcher makes the decision to accept the alternative hypothesis based on the
_______________ level of the statistical test. In most cases, researchers choose a significance level of
_______________. In other words, if the significance level is less than this standard, the researcher should
_______________ the finding of the statistical test as real. If the significance level is greater than this
standard, the researcher labels the finding as _______________. Even with this standard and these
Additional Resources
Robinson, N. W., & Castle Bell, G. (2014). Rating slam dunks to visualize the mean, median, node, range,
and standard deviation. Communication Teacher, 28, 218-223. doi:10.1080/17404622.2014.939672
The activity described by Professor Gray is best suited for small classes (30 or less). The dance club idea
may work best with less experienced and more traditional college-age students. The questions in the
debriefing section are excellent.
Carr, N. T. (2008). Using Microsoft Excel® to calculate descriptive statistics and create graphs. Language
Assessment Quarterly, 5, 43-62. doi:10.1080/15434300701776336
This article discusses both the importance of calculating and displaying descriptive statistics. The content
of the article is about educational assessment, but the principles can easily be transferred to
Keyton: Communication Research, 5e IM–11
teaching statistics. This site focuses on descriptive statistics:
https://www.socialresearchmethods.net/kb/statdesc.php
Web Resources
For a list of Internet resources, visit https://www.joannkeyton.com/research-methods