Keyton: Communication Research, 5e IM–1
Chapter 11
Testing for Relationships
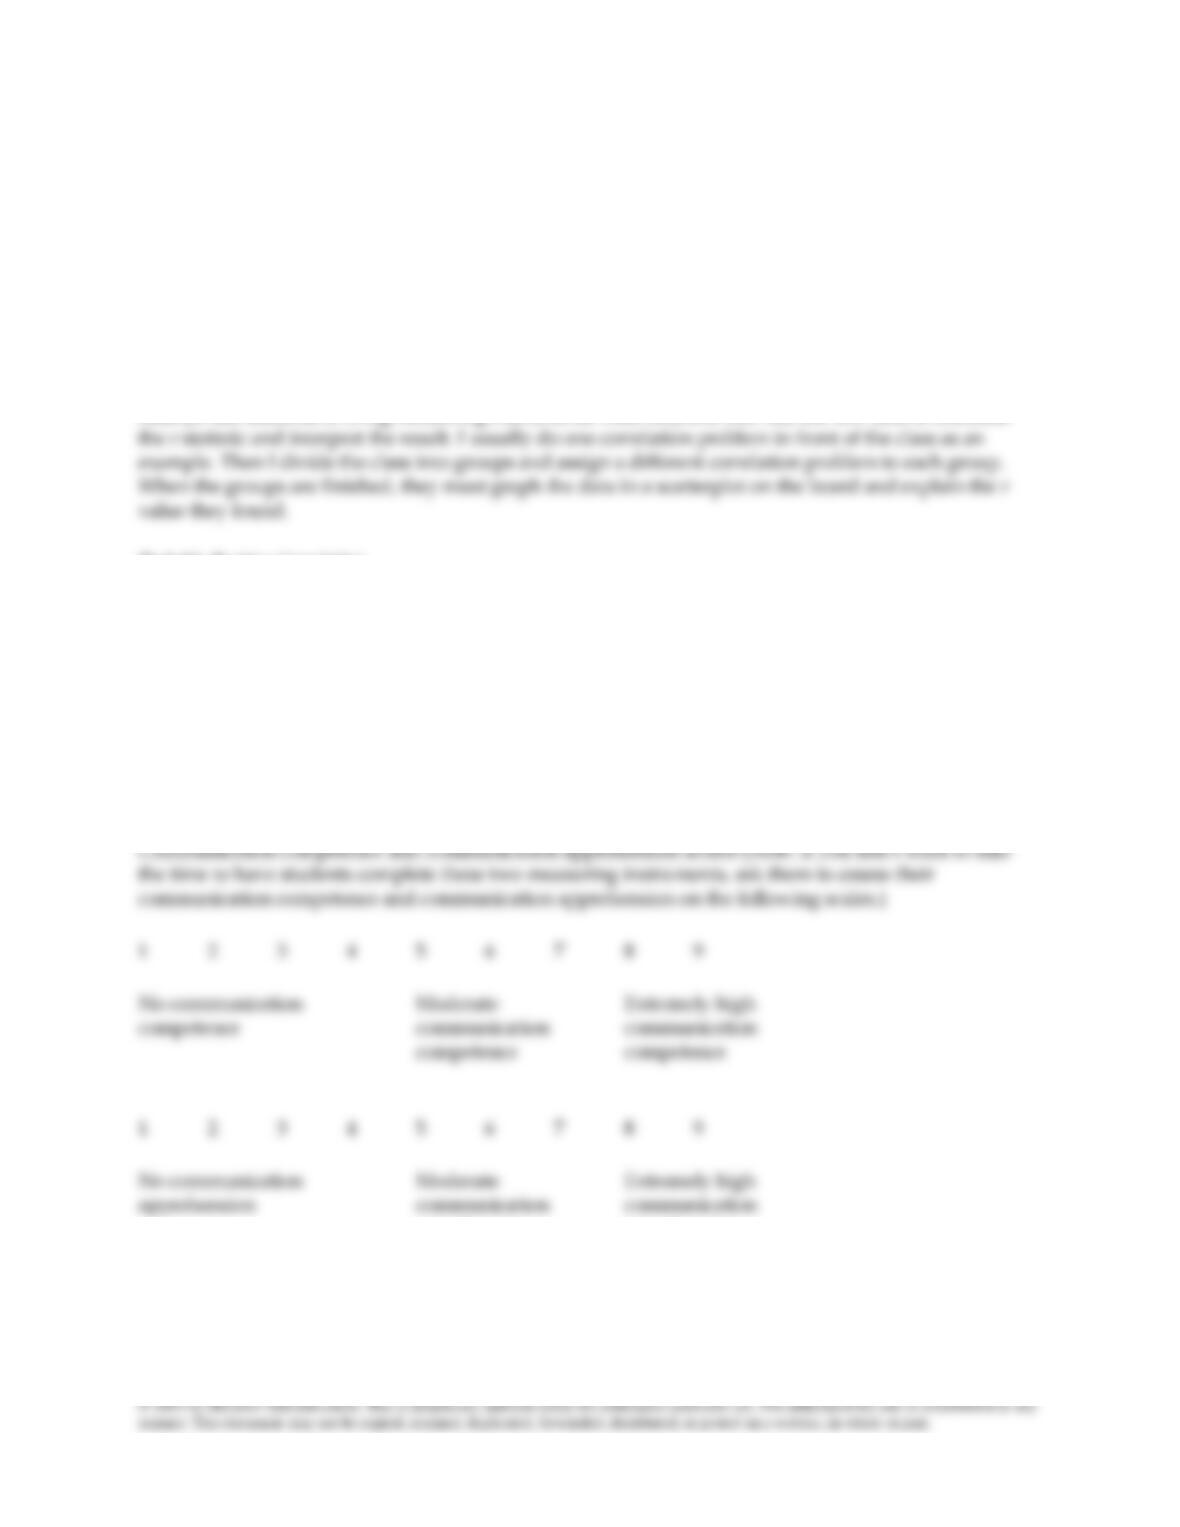
Activity: Demonstrating Correlation
As simple as correlation is, students often need personalized examples to make the distinctions between
positive, negative, and no (zero) correlation. One way to emphasize these distinctions is to collect data in
class (or ask students to bring measuring instruments filled out) and then use the raw data to calculate
Probable Positive Correlation
Number of times in formal leadership position in a group and self-assessment of leadership competence
(Note: If you don’t want to take the time to have students complete a leadership assessment, ask them to
assess their leadership competence on the following scale.)
1
2
3
4
5
6
7
8
9
No leadership
competence
Moderate
leadership
competence
Extremely high
leadership
competence
Probable Negative Correlation
apprehension apprehension
Probable Zero Correlations
Communication competence and number of siblings
Communication apprehension and grade point average

Keyton: Communication Research, 5e IM–2
Keyton: Communication Research, 5e IM–3
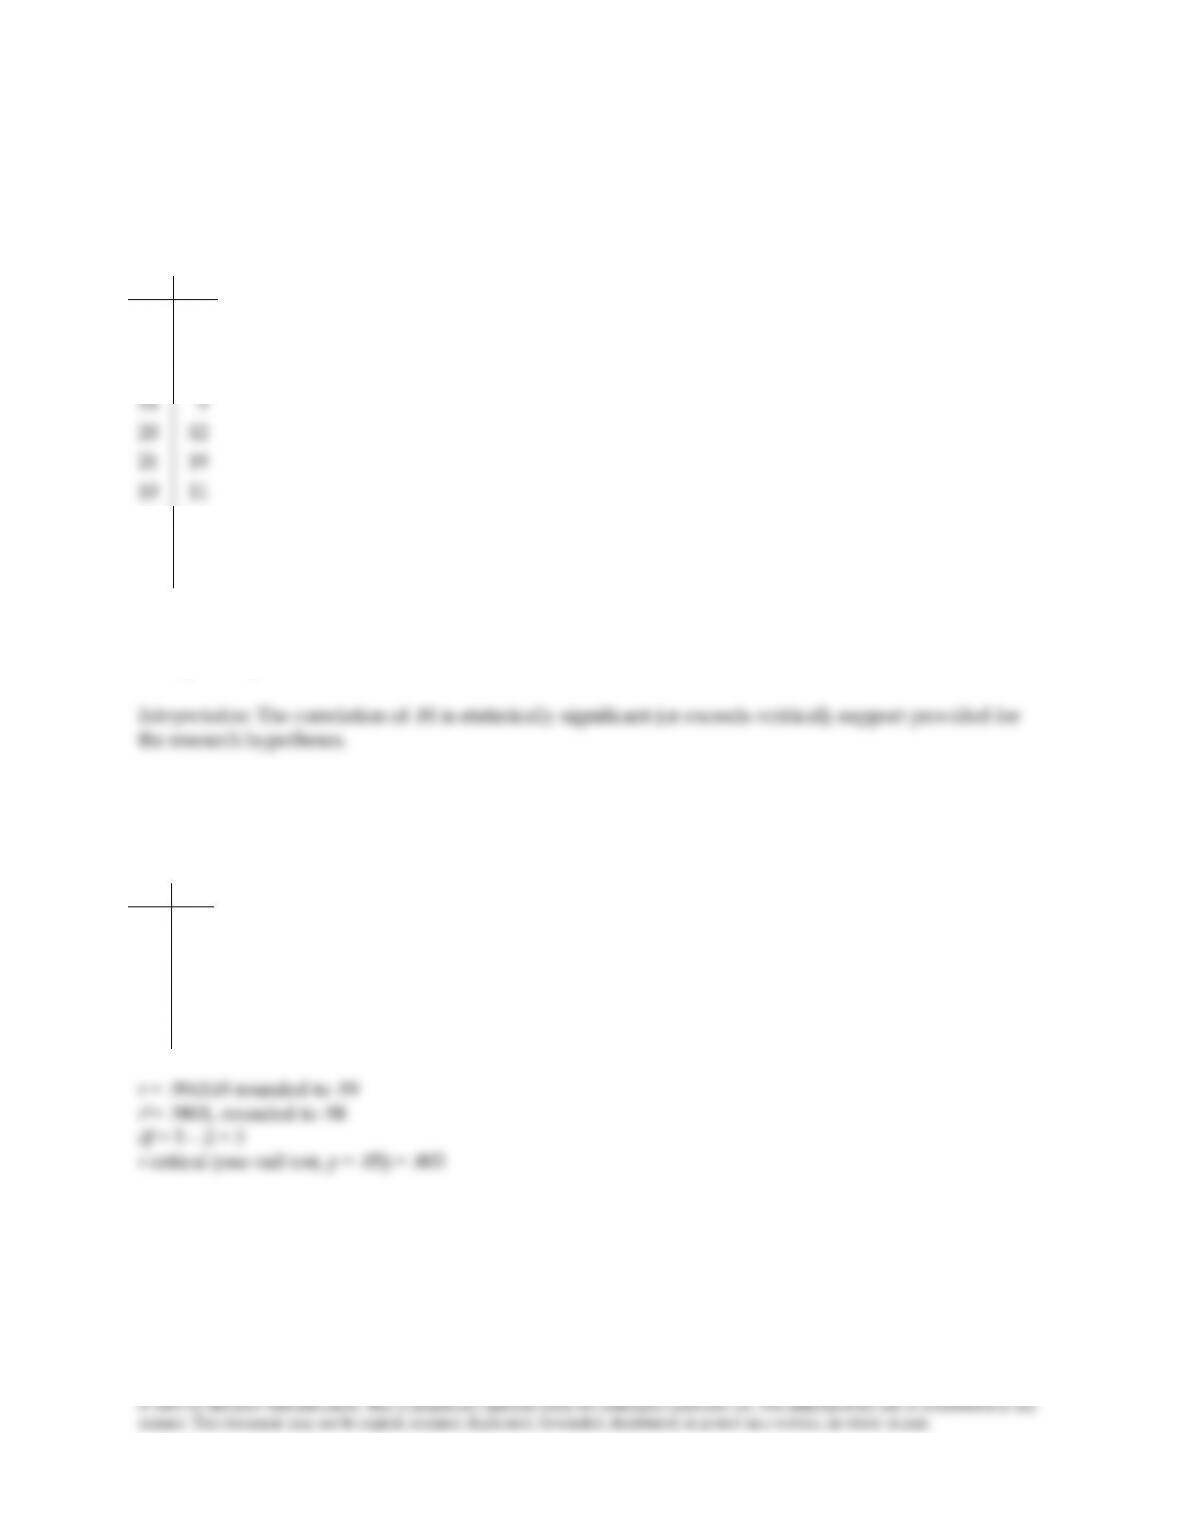
Activity: Positive Correlation Exercise
Ask students to compute r and r2, evaluate the statistical significance of r, and interpret the result using
the data shown below. Assign names to the variables as appropriate for your class, and create the
corresponding hypothesis to be tested.
X
Y
18
23
7
5
13
11
14
9
20
12
21
19
10
11
5
4
9
11
22
17
r = .805154, rounded to .81; r2 = .6561, rounded to .66; df = 10 – 2 = 8; r critical (one-tail
test, p = .05) = .549
Additional Data Set
X
Y
38
41
56
63
59
70
64
72
74
84
Keyton: Communication Research, 5e IM–4
Activity: Nonsignificant Correlation Exercise
Ask students to compute r and r2, evaluate the statistical significance of r, and interpret the result using
the data below. Assign names to the variables as appropriate for your class, and create the corresponding
hypothesis to be tested.
X
Y
4
8
3
5
5
4
8
7
1
6
2
5
3
5
5
3
r = .097973, rounded to .10; r2 = .001; df = 8 – 2 = 6; r critical (one-tail test, p = .05) = .622
Interpretation: The correlation of .10 is not statistically significant (or does not meet or exceed r critical);
retain the null hypothesis.
Additional Data Set
X
Y
29
13
39
46
44
43
37
34
42
20
17
20
38
18
51
19
43
27

Keyton: Communication Research, 5e IM–5
Stats Worksheet—Correlation
1. A correlation is a
2. A perfect positive correlation of +1.00 means that
4. A perfect negative correlation of –1.00 means that
5. The frequencies on a communication task are as follows:
Subject Number
Number of Changes in
Number of Changes in
Hand Movements
Facial Expressions
1
2
5
2
7
9
3
5
8
4
2
5
5
3
3
6
8
6
7
3
6
8
8
8
9
7
8
10
5
8
11
3
5
Hypothesis: When people are giving directions, the number of hand movements will be positively
correlated to the number of facial expressions.
Compute the correlation coefficient and r 2. Also test r against its critical value at the .05 significance level.
Interpret your findings.
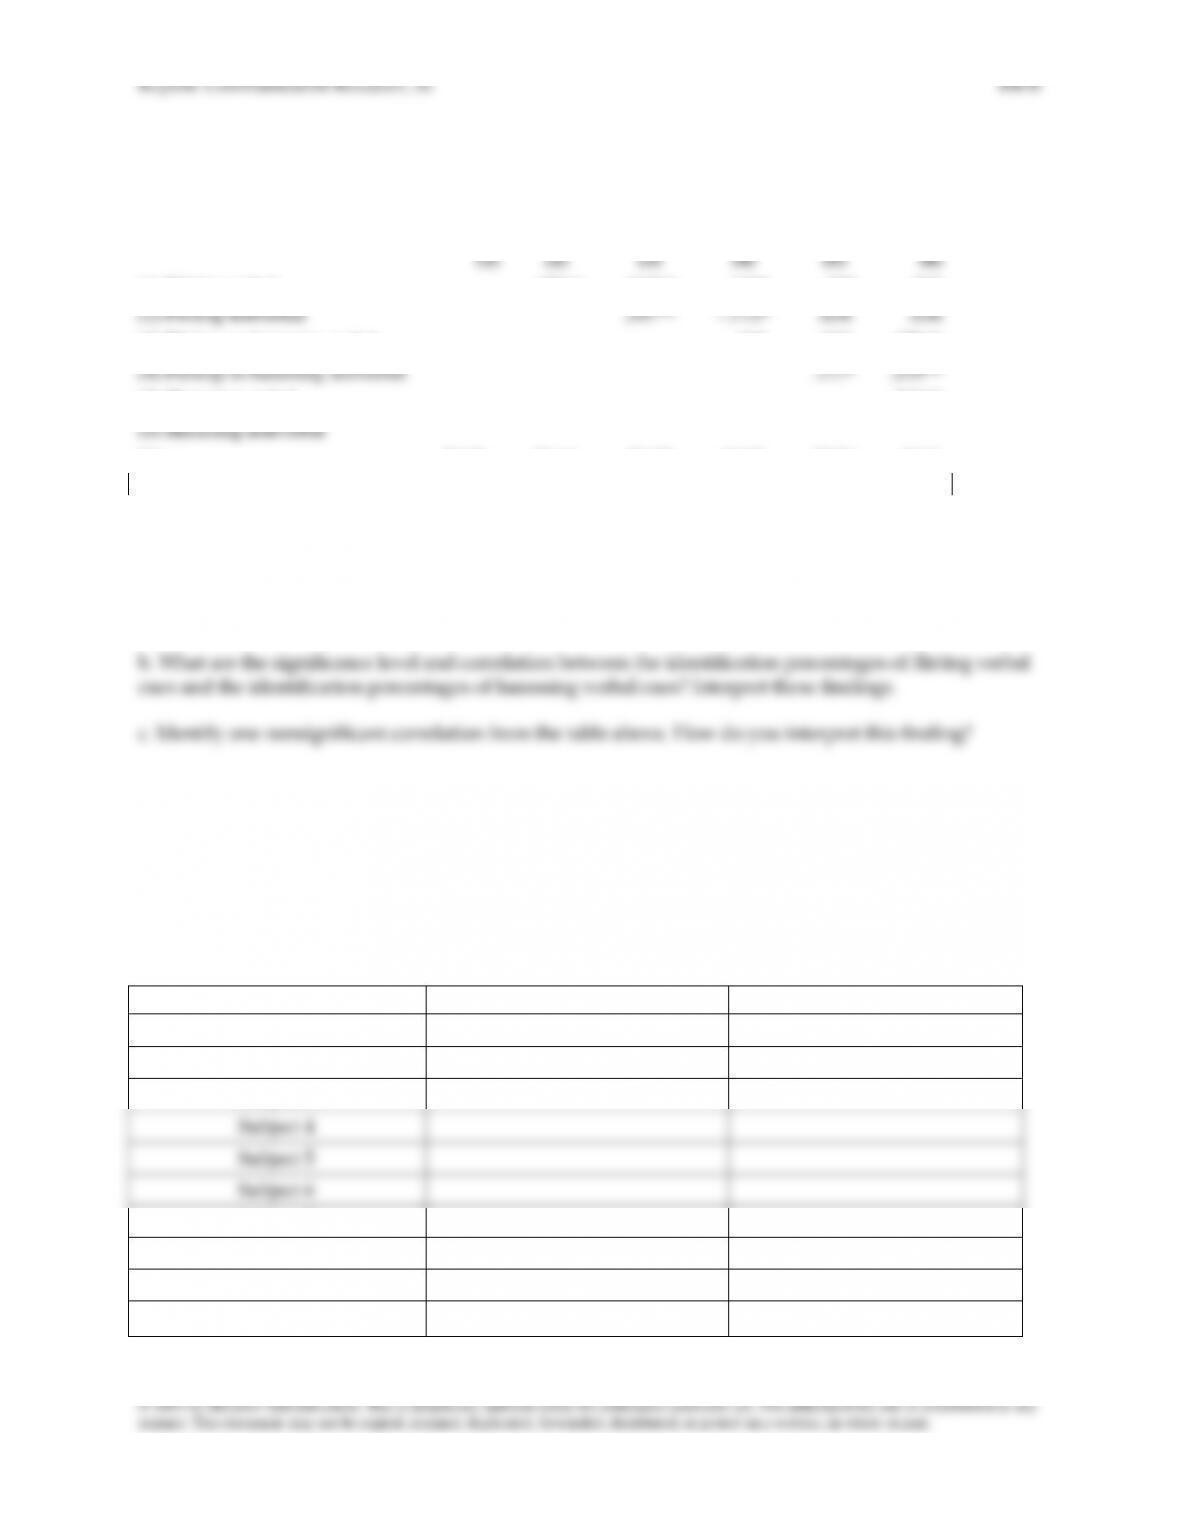
6. The correlation matrix for six variables appears below. Each variable should be read as “the percentage
of __________ cues identified.”
Descriptive Statistics and Correlations for Identification Scores
(1)
(2)
(3)
(4)
(5)
(6)
(1) Flirting verbal
.478**
.517**
–.138*
–.008
.003
(2) Flirting nonverbal
.547**
–.112*
.036
.036
(3) Flirting–to-harassing verbal
–.135
.053
.179**
(4) Flirting–to-harassing nonverbal
.117*
.235**
(5) Harassing verbal
.341**
(6) Harassing nonverbal
Mean
50.58
73.61
53.57
54.99
37.74
43.01
Standard deviation
30.11
34.07
32.22
49.81
29.89
34.05
*p < .05; **p < .01; Note: n = 431
a. What are the significance level and correlation between the identification percentages of flirting verbal
cues and the identification percentages of flirting nonverbal cues? Interpret these findings.
Extra Credit
Collect data from 10 of your friends or family members who work. Use the chart below to record the data.
Ask each person two questions: (a) How many s of school have you completed? and (b) On a scale of 1 to
5, with 1 being not satisfied at all, 3 being somewhat satisfied and somewhat dissatisfied, and 5 being
very satisfied, how satisfied are you with your job?
Subject
Years of School
Satisfaction with Job
Subject 1
Subject 2
Subject 3
Subject 4
Subject 5
Subject 6
Subject 7
Subject 8
Subject 9
Subject 10
Keyton: Communication Research, 5e IM–7
Compute the correlation. Determine if the r value meets or exceeds r critical. Interpret your findings.
From these findings, write a research question or hypothesis on these issues that deserve further testing.
Answer Key for Stats Worksheet—Correlation
1. A correlation is a statistical test that examines the linear relationship between two continuous level variables.
3. A correlation of .00 means that there is no relationship between the two variables.
5. r = .71 r 2 = .50 df = 9 r critical = .521 (one-tail test) Hand movements and facial expressions are positively and
strongly correlated, and significant.
6. a. r = .478 p = .01 The two variables are moderately and positively correlated, and significant at the .01 level.
b. r = –.008
Nonsignificant correlation. There is no relationship between the two variables.
c. There are several nonsignificant correlations:
–.008
flirting verbal and harassing verbal
.003
flirting verbal and harassing nonverbal
.036
flirting nonverbal and harassing verbal
.036
flirting nonverbal and harassing nonverbal
.053
flirting-to-harassing verbal and harassing verbal
Additional Resources
Allison, P. D. (1999). Multiple regression: A primer. Thousand Oaks, CA: Pine Forge Press.
This book is an excellent source that covers the basics, from what constitutes a multiple regression to the
interpretation of multiple regression results.
D’Urso, S. C., & Rains, S. A. (2008). Examining the scope of channel expansion: A test of channel
expansion theory with new and traditional communication media. Management Communication
Quarterly, 21, 486-507. doi:10.1177/0893318907313712
Ethington, C. A., Thomas, S. L., & Pike, G. R. (2003). Back to the basics: Regression as it should be.
In J. C. Smart (Ed.), Higher education: Handbook of theory & research (pp. 265-295). New
York: Springer.
Not an introductory chapter on regression, this handbook chapter reviews the technical issues (e.g., the
role of theory, structure of data, measurement of variables) that when overlooked or not reported,

Keyton: Communication Research, 5e IM–8
challenge the validity of regression results.
This article is about topics students can easily relate to. The correlation table presented in the article is
well laid out and could be used as the basis of a classroom activity or assignment.
The author details a number of problems with statistical packages’ approach to stepwise regression.
This series of websites (www.socialresearchmethods.net) is very helpful for finding different
ways/language to explain statistics to students. Unfortunately, the sites are now monetized (include ads),
and that’s why I don’t recommend them for students. But I do recommend them for faculty to assist in
teaching statistics. This site focuses on correlation:
https://www.socialresearchmethods.net/kb/statcorr.php
This document is from management, but I believe students will understand SEM with your guidance:
https://www.ifm.eng.cam.ac.uk/uploads/Research/RCDP/Resources/SEM-IfM_Read-Only.pdf
Web Resources
For a list of Internet resources, visit https://www.joannkeyton.com/research-methods