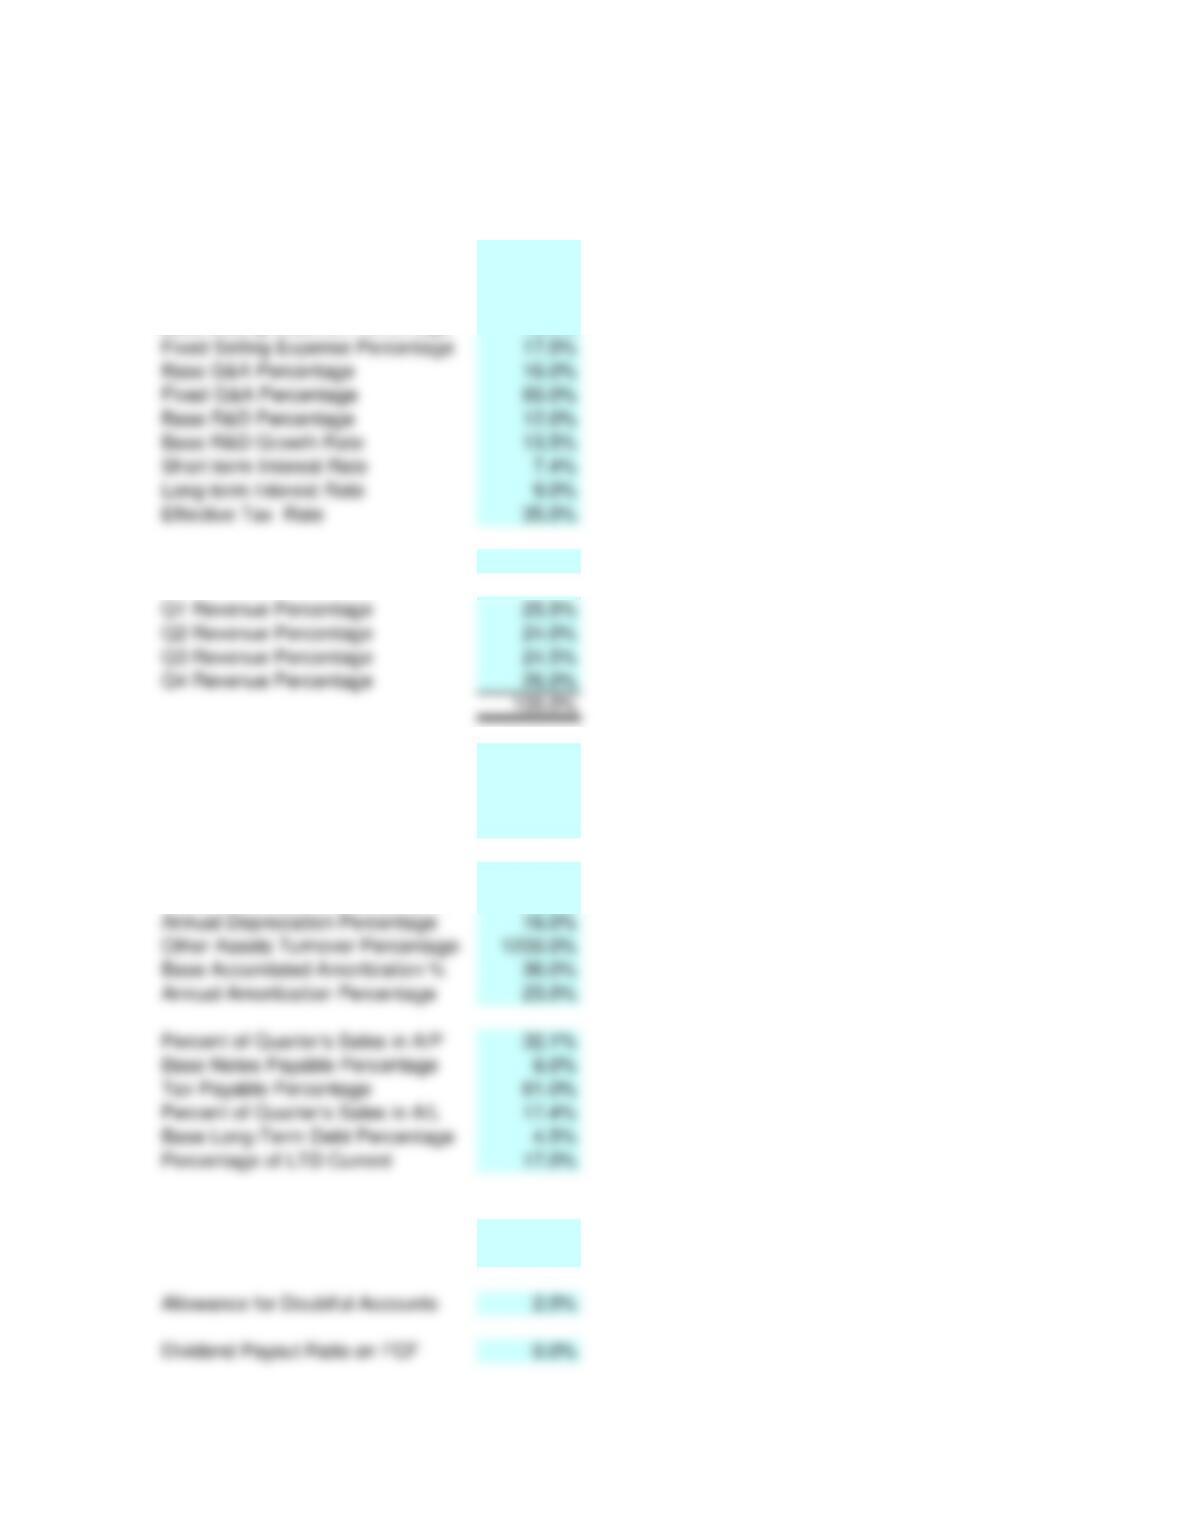
Base Revenue (year prior to 1st) 37,880$
Based Gross Margin Percentage 48.0%
Fixed Mfg. Costs Percentage 35.0%
Base Selling Expense Percentage 19.0%
Expected Annual Growth Rate 11.0%
Target Ending Cash Percentage 35.0%
Percent of Quarter’s Sales in A/R 83.0%
Target Ending Inventory Percentage 40.0%
Prepaid Expense Percentage 12.0%
PP&E Turnover Percentage 244.0%
Base Accumlated Depreciation % 38.0%
Base Common Stock Percentage 0.5%
Base APIC Percentage 12.0%
The values within the financial statements are all computed automatically
based on the contents of the following shaded fields:
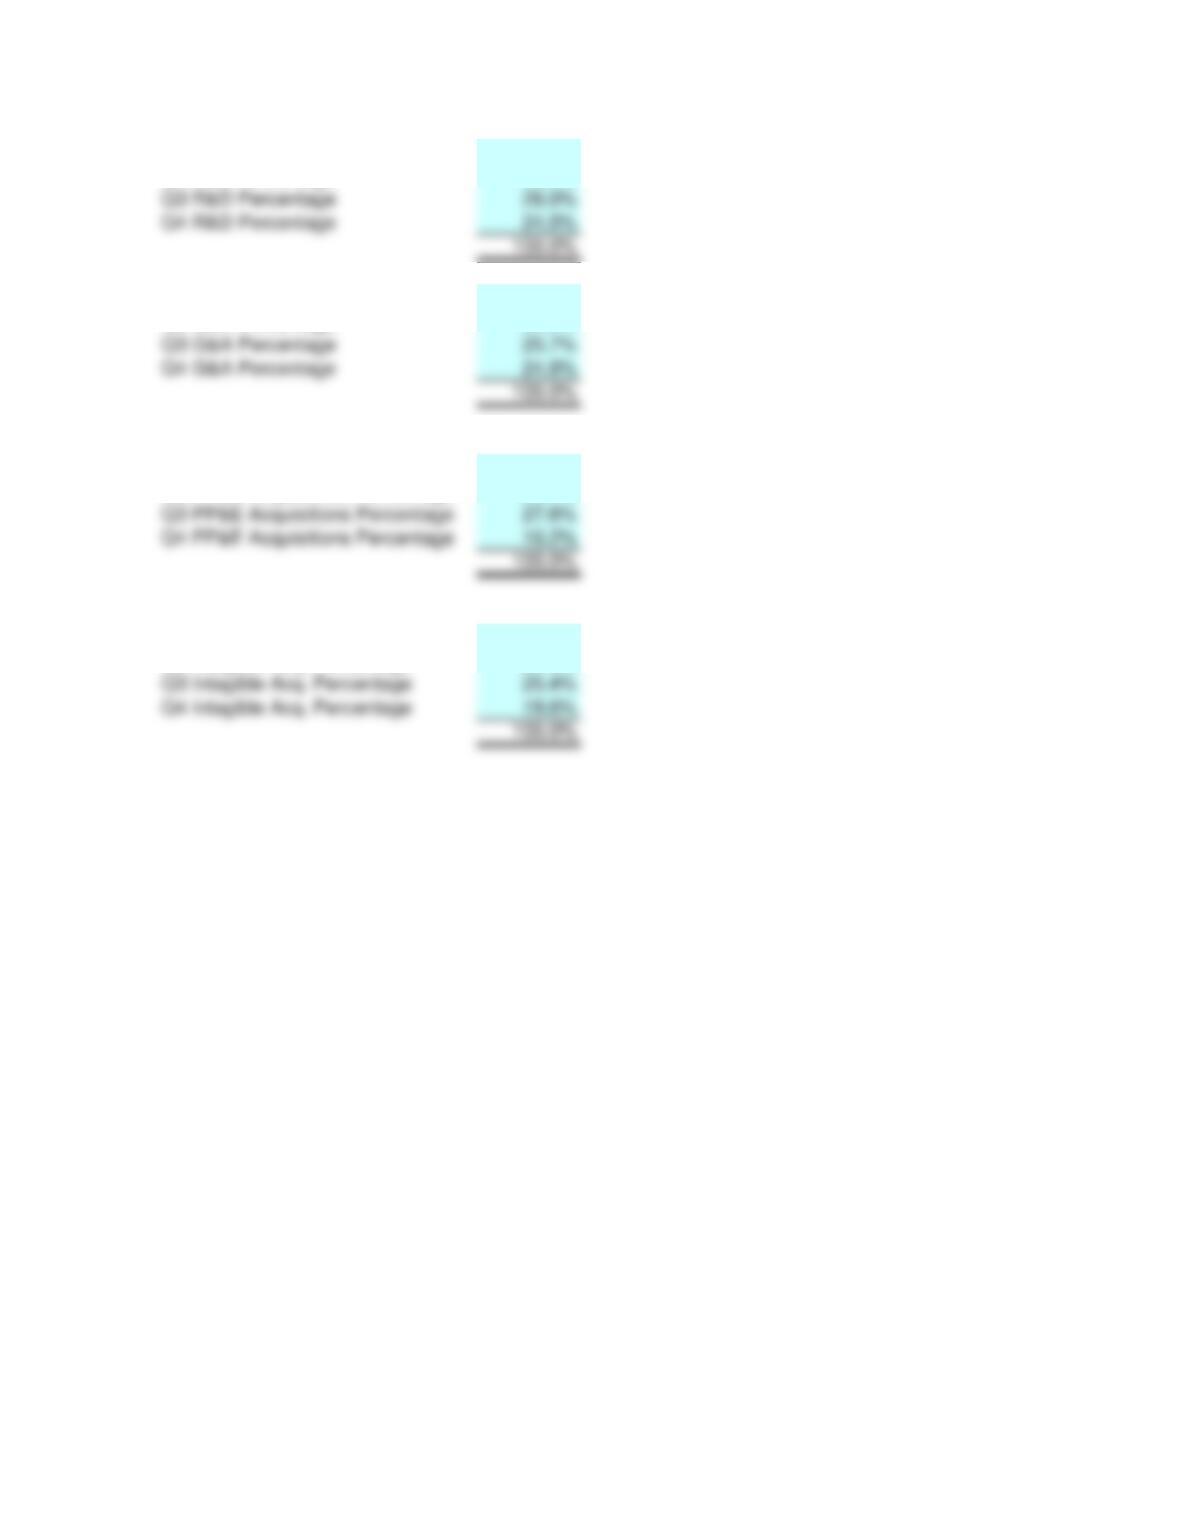
Q1 R&D Percentage 22.0%
Q2 R&D Percentage 28.0%
Q1 G&A Percentage 24.5%
Q2 G&A Percentage 25.0%
Q1 PP&E Acquisitions Percentage 26.8%
Q2 PP&E Acquisitions Percentage 35.4%
Q1Intagible Acq. Percentage 25.4%
Q2 Intagible Acq. Percentage 29.6%
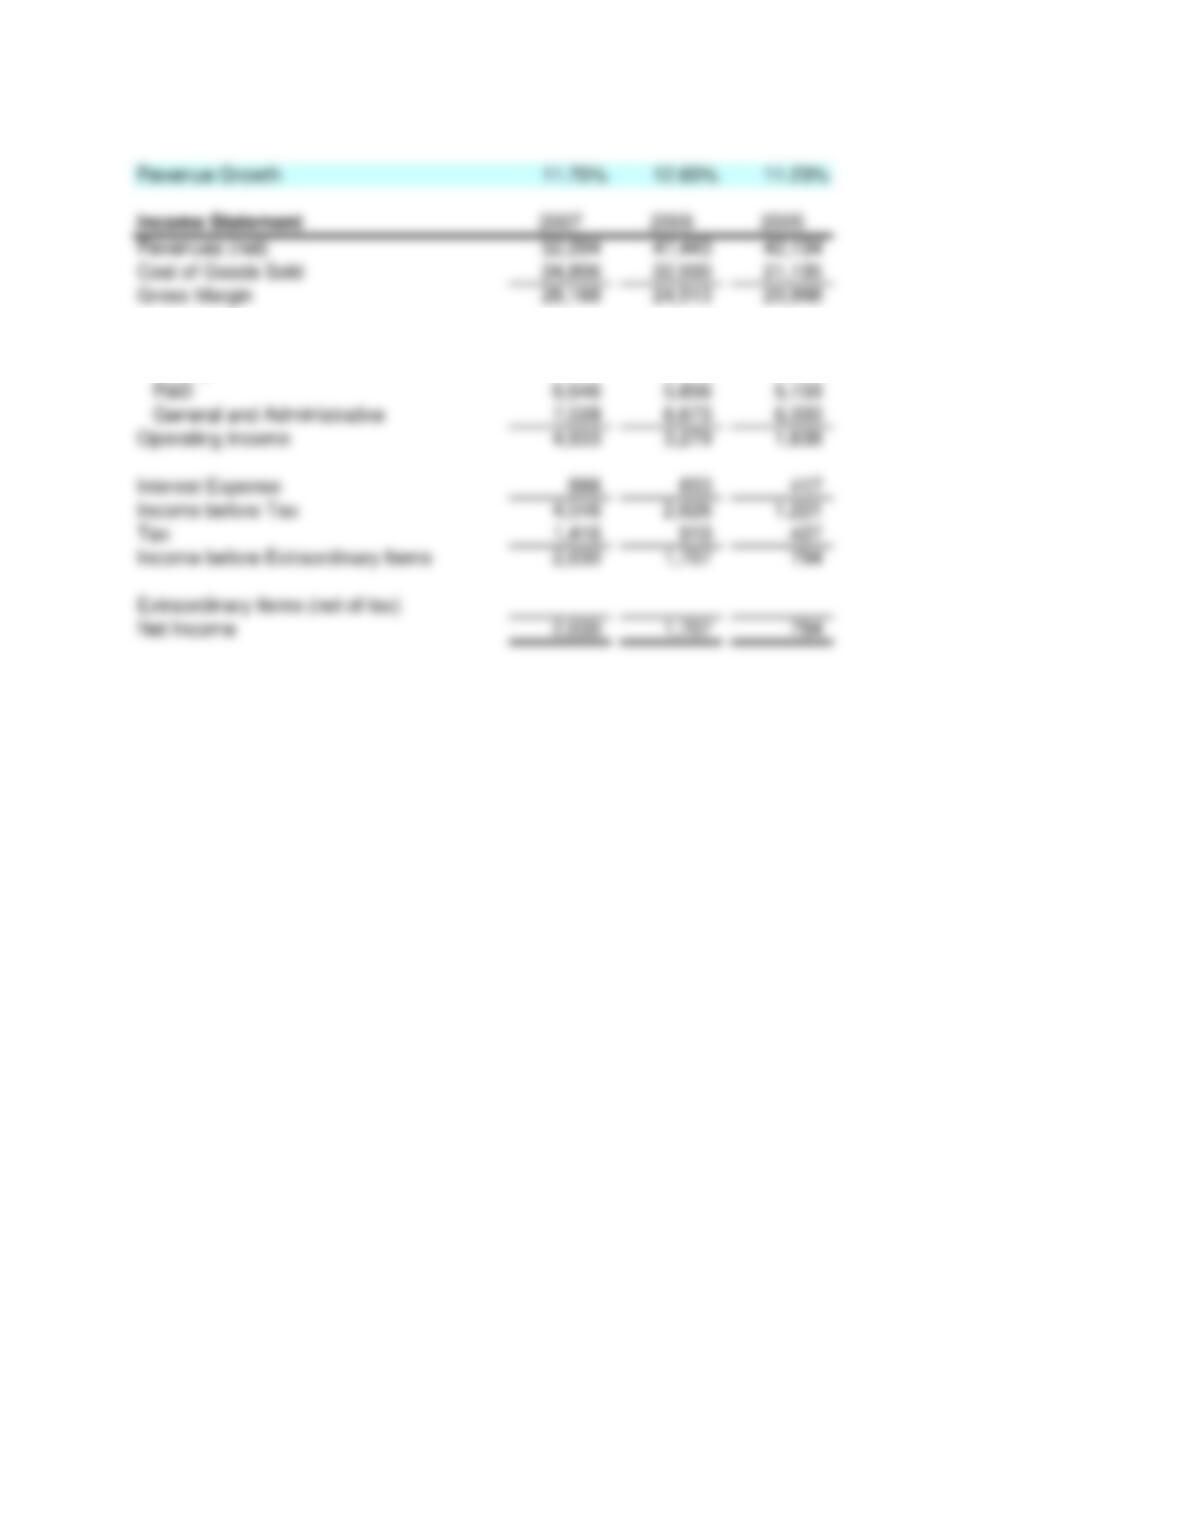
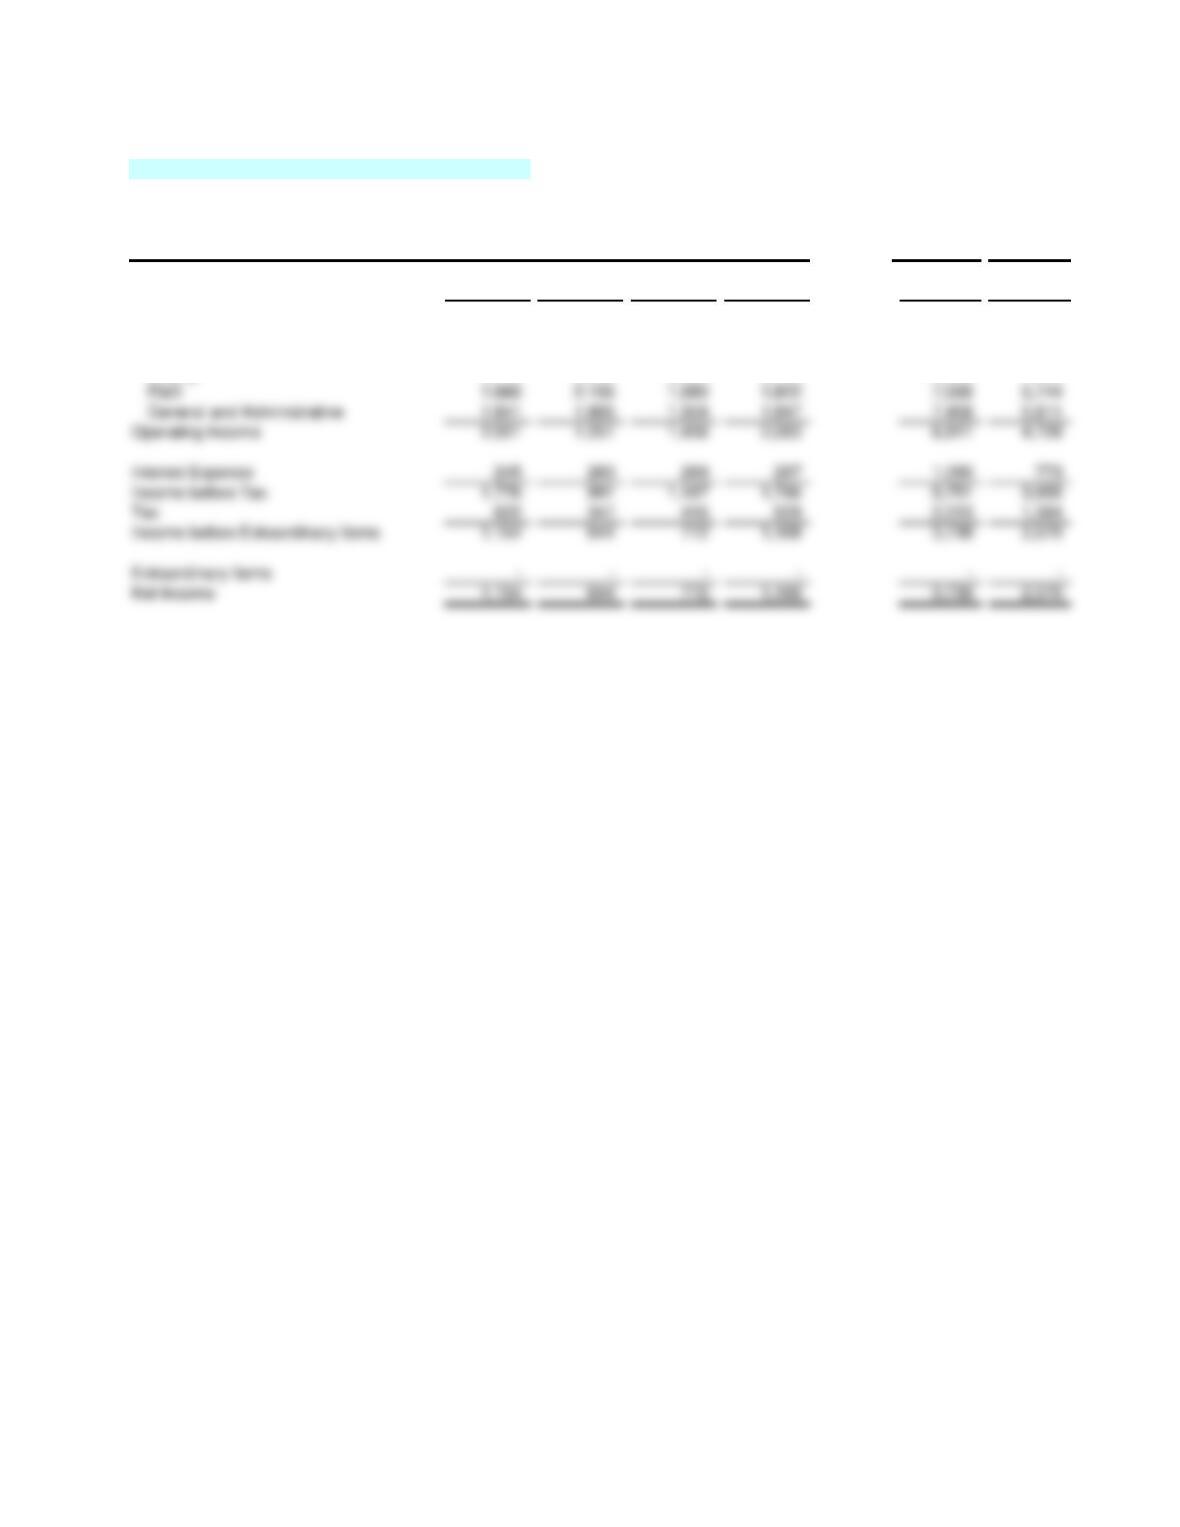
Operating Expenses
Selling 9,581 8,705 7,868
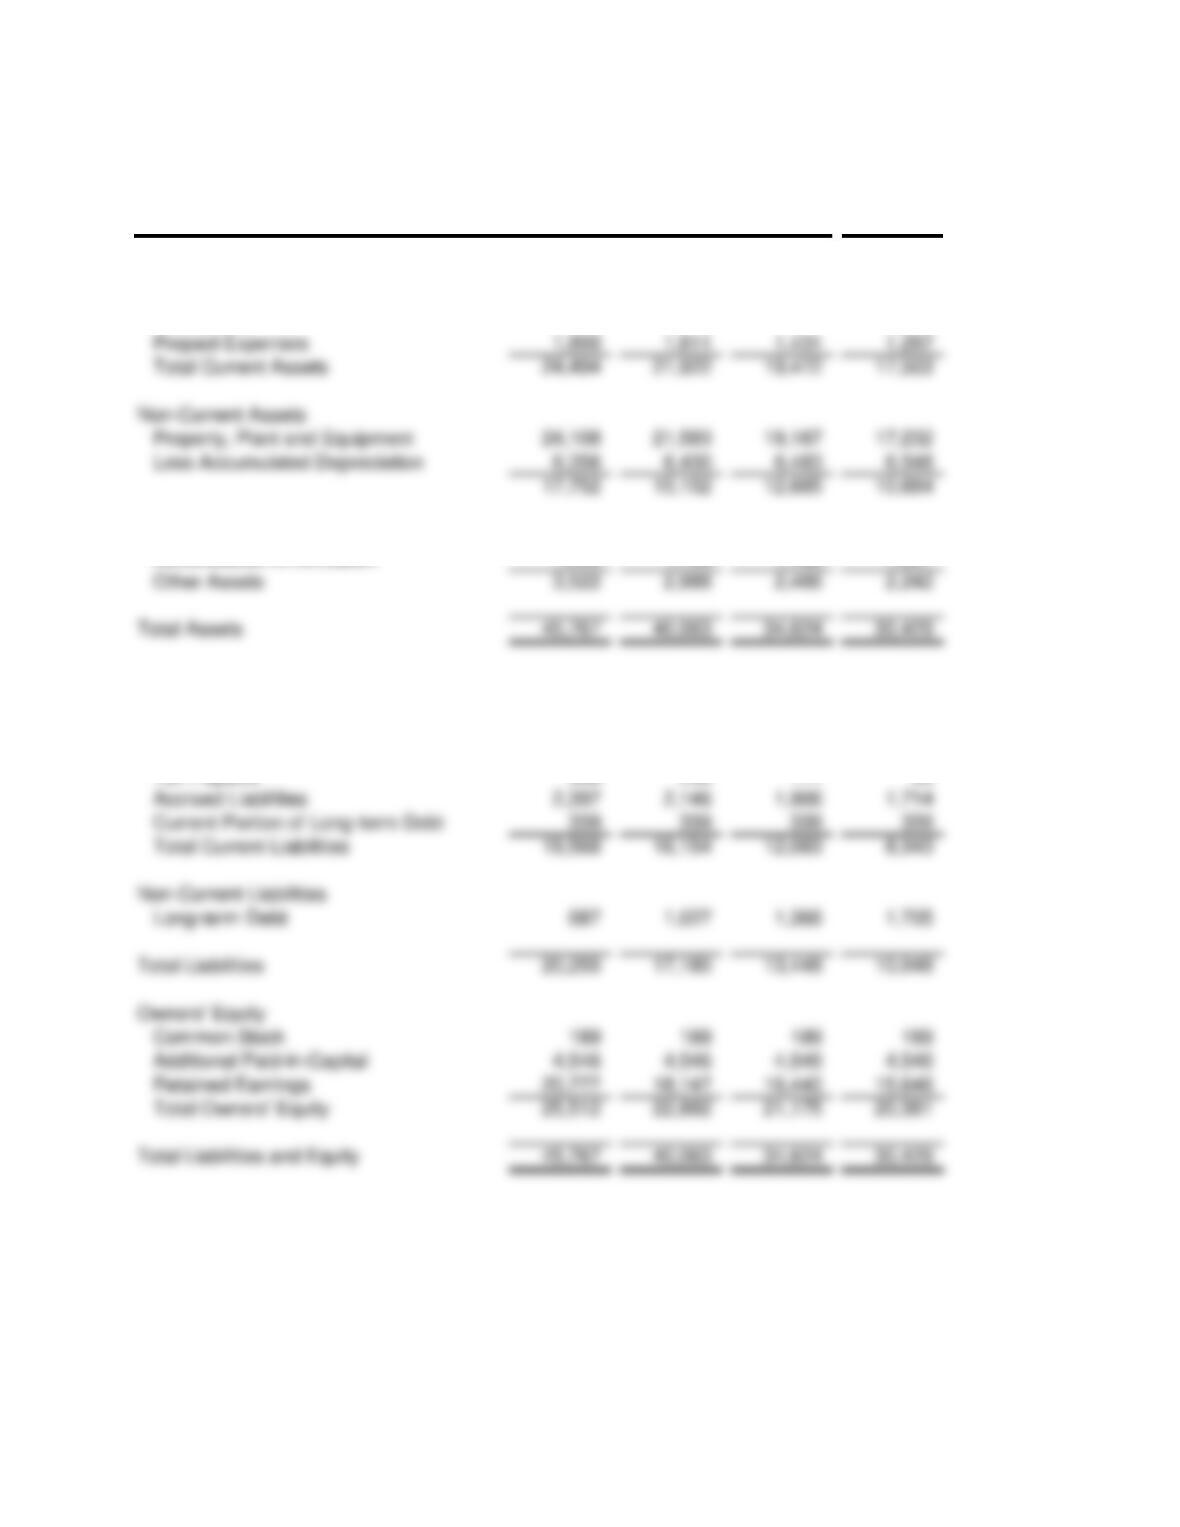
Balance Sheet 2007 2006 2005 2004
Current Assets
Cash 5,258 4,701 4,178 3,753
Accounts Receivable (net) 11,436 10,238 9,093 8,175
Inventories 6,000 5,371 4,770 4,289
Other Assets Gross 4,613 4,133 3,652 3,504
Accumulated Amortization 1,090 1,144 1,186 1,261
Current Liabilities
Accounts Payable 4,423 3,960 3,516 3,161
Notes Payable 12,040 9,470 6,210 3,030
Tax Payable 368 239 111 99
– – – –
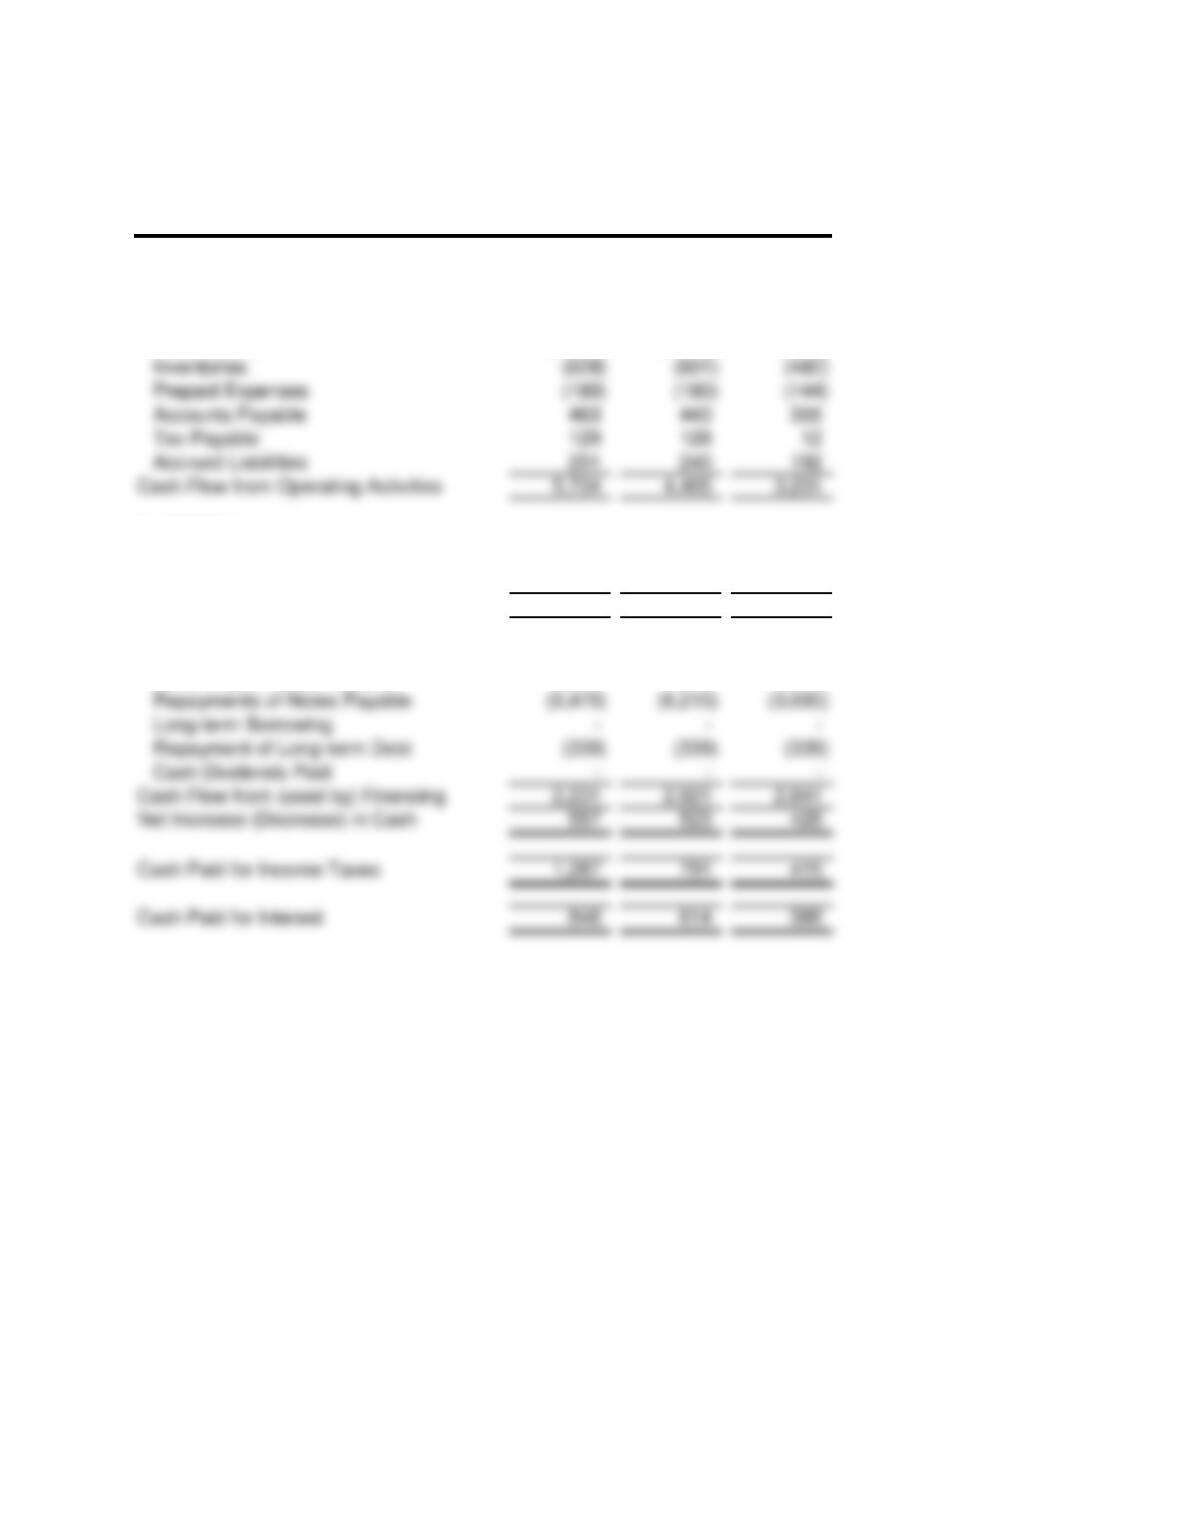
Statement of Cash Flows 2007 2006 2005
OPERATIONS:
Net Income 2,630 1,707 794
Adjustments to Reconcile:
Depreciation and Amortization 4,275 3,813 3,422
Accounts Receivable (1,198) (1,146) (918)
INVESTING:
Additions to PP&E 5,978 5,482 4,692
Acquistitions of Technology Licenses 1,430 1,321 954
Cash Flow used for Investing Activities 7,409 6,803 5,646
FINANCING:
Borrowing of Notes Payable 12,040 9,470 6,210
Revenue Growth for the Year 12.78%
Income Statement Q1 Q2 Q3 Q4
2008 Pro
Forma
9 Months
Ended
9/30/08
Revenues (net) 15,240 14,344 14,643 15,539 59,766 44,227
Cost of Goods Sold 7,000 6,554 6,669 7,045 27,269 20,224
Gross Margin 8,240 7,790 7,974 8,494
Operating Expenses
Selling 2,719 2,568 2,634 2,742 10,663 7,921
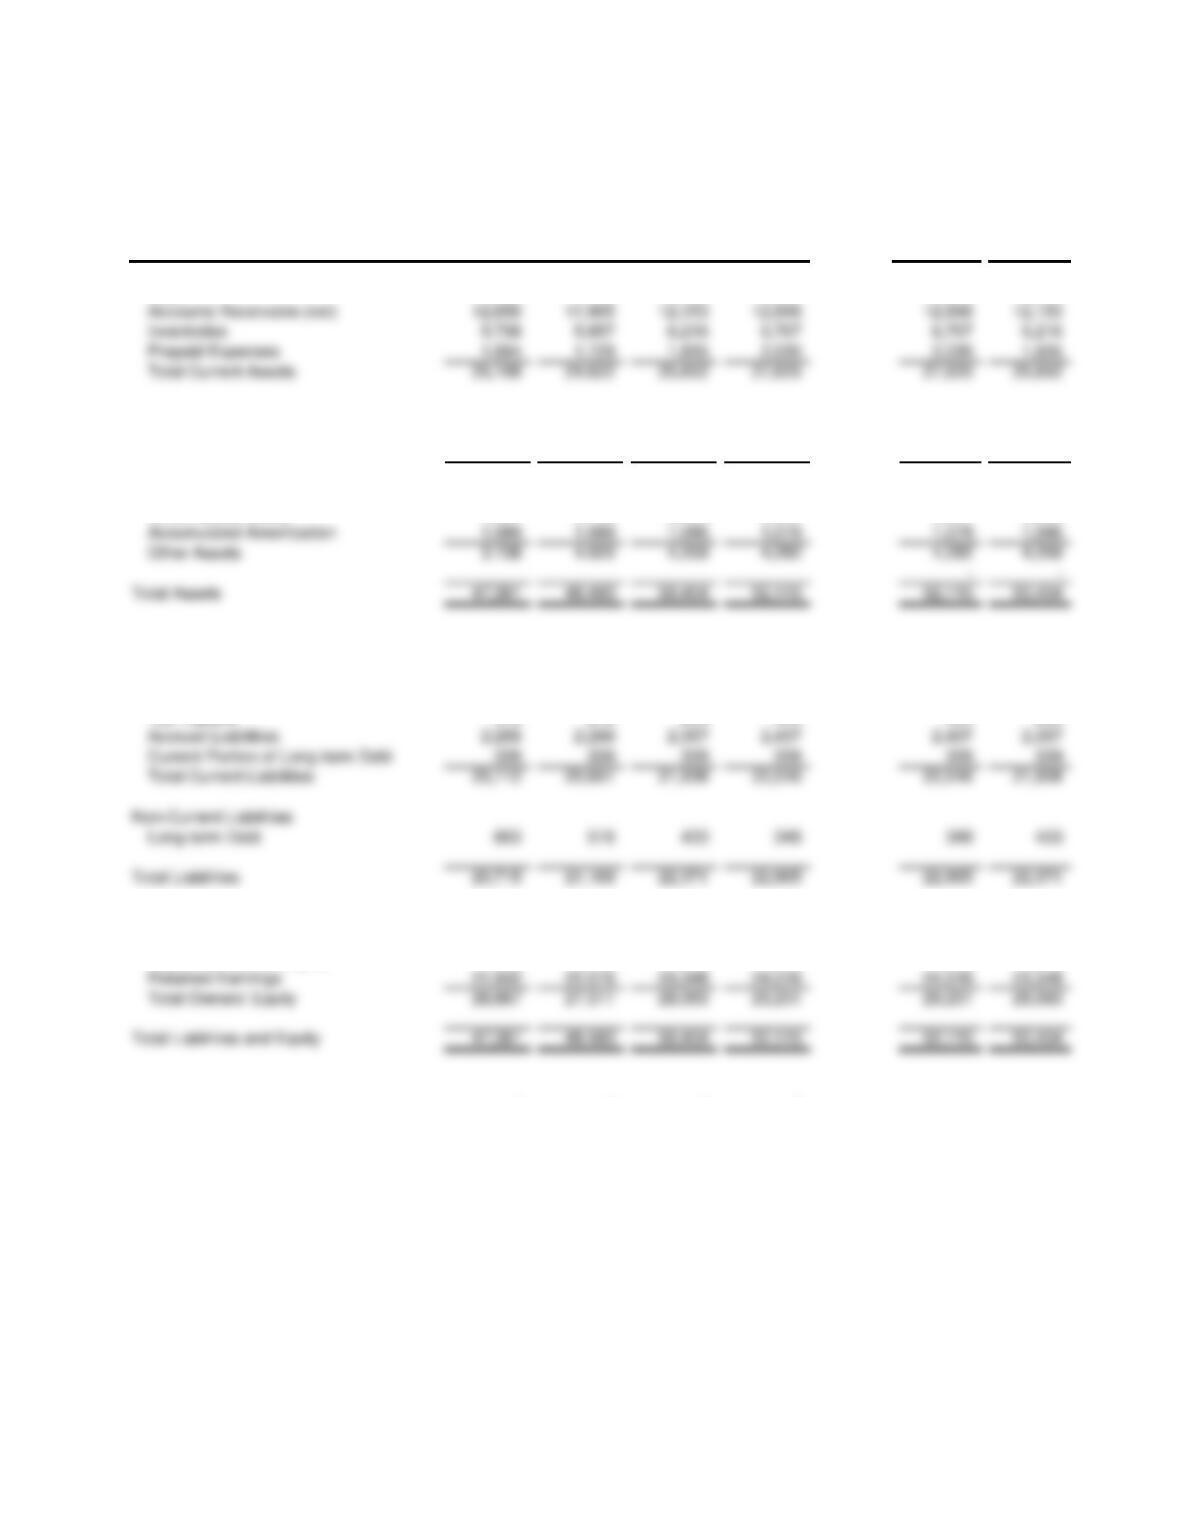
Balance Sheet Q1 Q2 Q3 Q4
2008 Pro
Forma
9 Months
Ended
9/30/08
Current Assets
Cash 5,026 5,130 5,448 5,930 5,930 5,448
Non-Current Assets
Plant, Property and Equipment 24,888 26,197 26,945 26,531 26,531 26,945
Less Accumulated Depreciation 6,352 6,359 6,353 6,323 6,323 6,353
18,535 19,838 20,592 20,208 20,208 20,592
– –
Other Assets Gross 4,827 5,109 5,295 5,361 5,361 5,295
Current Liabilities
Accounts Payable 4,159 4,241 4,348 4,496 4,496 4,348
Notes Payable 12,980 13,560 14,640 14,860 14,860 14,640
Tax Payable 379 212 253 384 384 253
Owners’ Equity
Common Stock 189 189 189 189 189 189
Additional Paid-in-Capital 4,546 4,546 4,546 4,546 4,546 4,546
– – – –
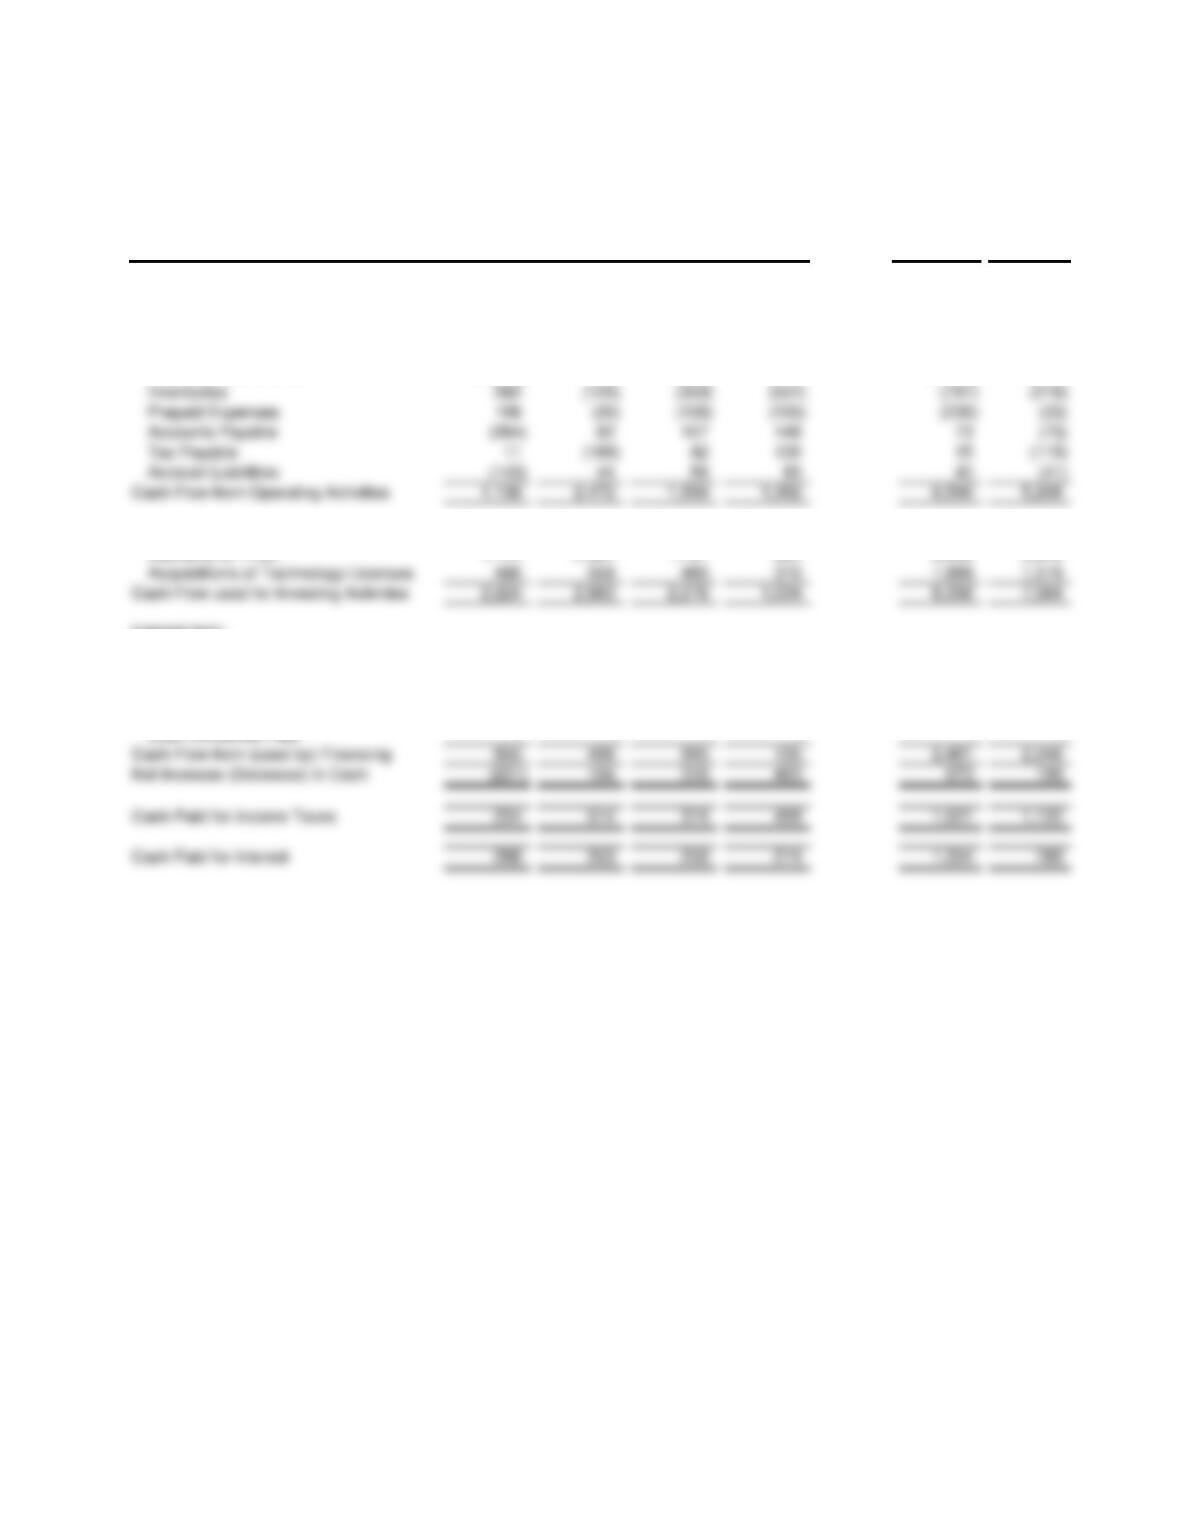
Statement of Cash Flows Q1 Q2 Q3 Q4
2008 Pro
Forma
9 Months
Ended
9/30/08
OPERATIONS:
Net Income 1,154 644 772 1,168 3,738 2,570
Adjustments to Reconcile:
Depretiation and Amortization 1,224 1,279 1,333 1,346 5,182 3,836
Changes in Operating Assets/Liabilities
Accounts Receivable (1,213) 744 (248) (744) (1,462) (717)
INVESTING:
Additions to PP&E 1,744 2,304 1,797 664 6,509 5,845
FINANCING:
Borrowing of Notes Payable 4,010 3,470 4,030 3,350 14,860 11,510
Repayments of Notes Payable (3,070) (2,890) (2,950) (3,130) (12,040) (8,910)
Long-term Borrowing – – – – – –
Repayment of Long-term Debts (85) (85) (85) (85) (339) (254)

Sales Forecast: 65,743$ In thousands
Growth Forecast: 10%
xSalary and Wages Current FTE
Total
Compensation
Expense
Estimated
Attrition
Estimated
Market
Adjustment
Requested
FTE
Anticipated
Need (Excess)
Estimated
Training
Expense
Estimated Total
Compensation
Expense
Direct Labor
Manufacturing
Overhead
Selling
Research &
Development
General &
Adminstrative
Manufacturing:
Management 4 524,600 – 3.0% 4 – – 540,338 – 540,338 –
Supervisory 8 806,400 1 2.0% 8 1 10,000 822,528 – 832,528 –
Management 5 2,227,400 – 2.0% 5 – – 2,271,948 – – – 2,271,948 –
Commissioned 4 1,379,840 1 1.5% 5 2 15,000 1,750,672 – – 1,750,672 – 15,000 –
Professional 6 938,880 – 2.7% 9 3 36,000 1,446,345 – – 361,586 – 1,120,758 –
Technical 10 449,800 2 3.0% 15 7 56,000 694,941 – – 694,941 – 56,000 –
25 4,995,920 3 34 12 107,000 6,163,906 – – 2,807,199 – 3,463,706 –
–
Finance Division: –
Management 5 1,312,200 – 3.0% 5 – – 1,351,566 – 135,157 – – 1,216,409 –
Professional 9 1,336,320 1 3.0% 9 1 2,000 1,376,410 – 619,384 – – 759,025 –
32 3,870,680 3 35 6 13,600 4,232,428 – 1,386,850 – – 2,859,178 –
–
Capital Spending
Manufacturing
Overhead
Selling
Research &
Development
General &
Adminstrative
xManufacturing:
Replacements 2,644,800 2,644,800
Additions 156,400
Licenses 20,110
Renewals 502,740 502,740
3,324,050 3,147,540 – – –
Engineering:
Replacements 847,800 847,800
Additions 55,400
Renewals 358,410 358,410
1,292,690 – – 1,206,210 –
Sales & Marketing:
Replacements 347,550 347,550
Additions 160,200
Finance Division:
Replacements 404,950 404,950
Additions 40,300
Software 4,200
Renewals 386,200 386,200
0.921530367
Overhead, Non-Compensation Related
Fixed Variable Total
Manufacturing
Overhead
Selling
Research &
Development
General &
Adminstrative
Manufacturing:
Indirect Materials 644,900 821,500 1,466,400 1,466,400 – – – –
Misc. 32,450 25,500 57,950 57,950 – – – –
1,998,050 921,820 2,919,870 2,919,870 – – – –
–
Maintenance 505,800 – 505,800 – – 505,800 – –
Ed. and Training 585,000 – 585,000 – – – 585,000 –
Misc. 42,280 3,700 45,980 – – 39,083 6,897 –
3,020,280 93,000 3,113,280 – – 2,184,883 928,397 –
–
Sales & Marketing: –
Shipping 54,800 1,611,400 1,666,200 – 1,666,200 – – –
Trade Exhibits 1,736,000 – 1,736,000 – 1,736,000 – – –
Ed. and Training 425,000 – 425,000 – – – 425,000 –
Market Analysis 158,000 – 158,000 – – – 158,000 –
Misc. 33,400 46,800 80,200 – 80,200 – – –
4,040,400 4,398,500 8,438,900 – 7,855,900 – 583,000 –
–
Finance Division: –
Ed. and Training 325,000 – 325,000 – – – 325,000 –
Contract Labor 105,000 160,000 265,000 – – – 265,000 –
Maintenance 203,000 – 203,000 – – – 203,000 –
Misc. 41,600 – 41,600 – – – 41,600 –
1,191,950 160,000 1,351,950 – – – 1,351,950 –
–
x
Budgeted Annual Income Statement (2009)
Revenues (net) 65,743$
Cost of Goods:
Direct Materials 12,200
Direct Labor 6,959
Mfg. Overhead 9,892 29,051
Gross Margin 36,692
Labor & Technical 92 6,568,800 4 2.0% 98 10 60,000 7,137,144 7,137,144 60,000 –
–
Management 4 1,056,300 – 3.5% 4 – – 1,093,271 – 109,327 – 765,289 218,654 –
Technical 11 1,057,980 1 2.6% 14 4 16,000 1,381,530 – – – 1,381,530 16,000 –
42 5,579,480 3 47 8 25,500 6,137,532 – 984,913 – 4,933,966 244,154 –
–
Sales & Marketing: –

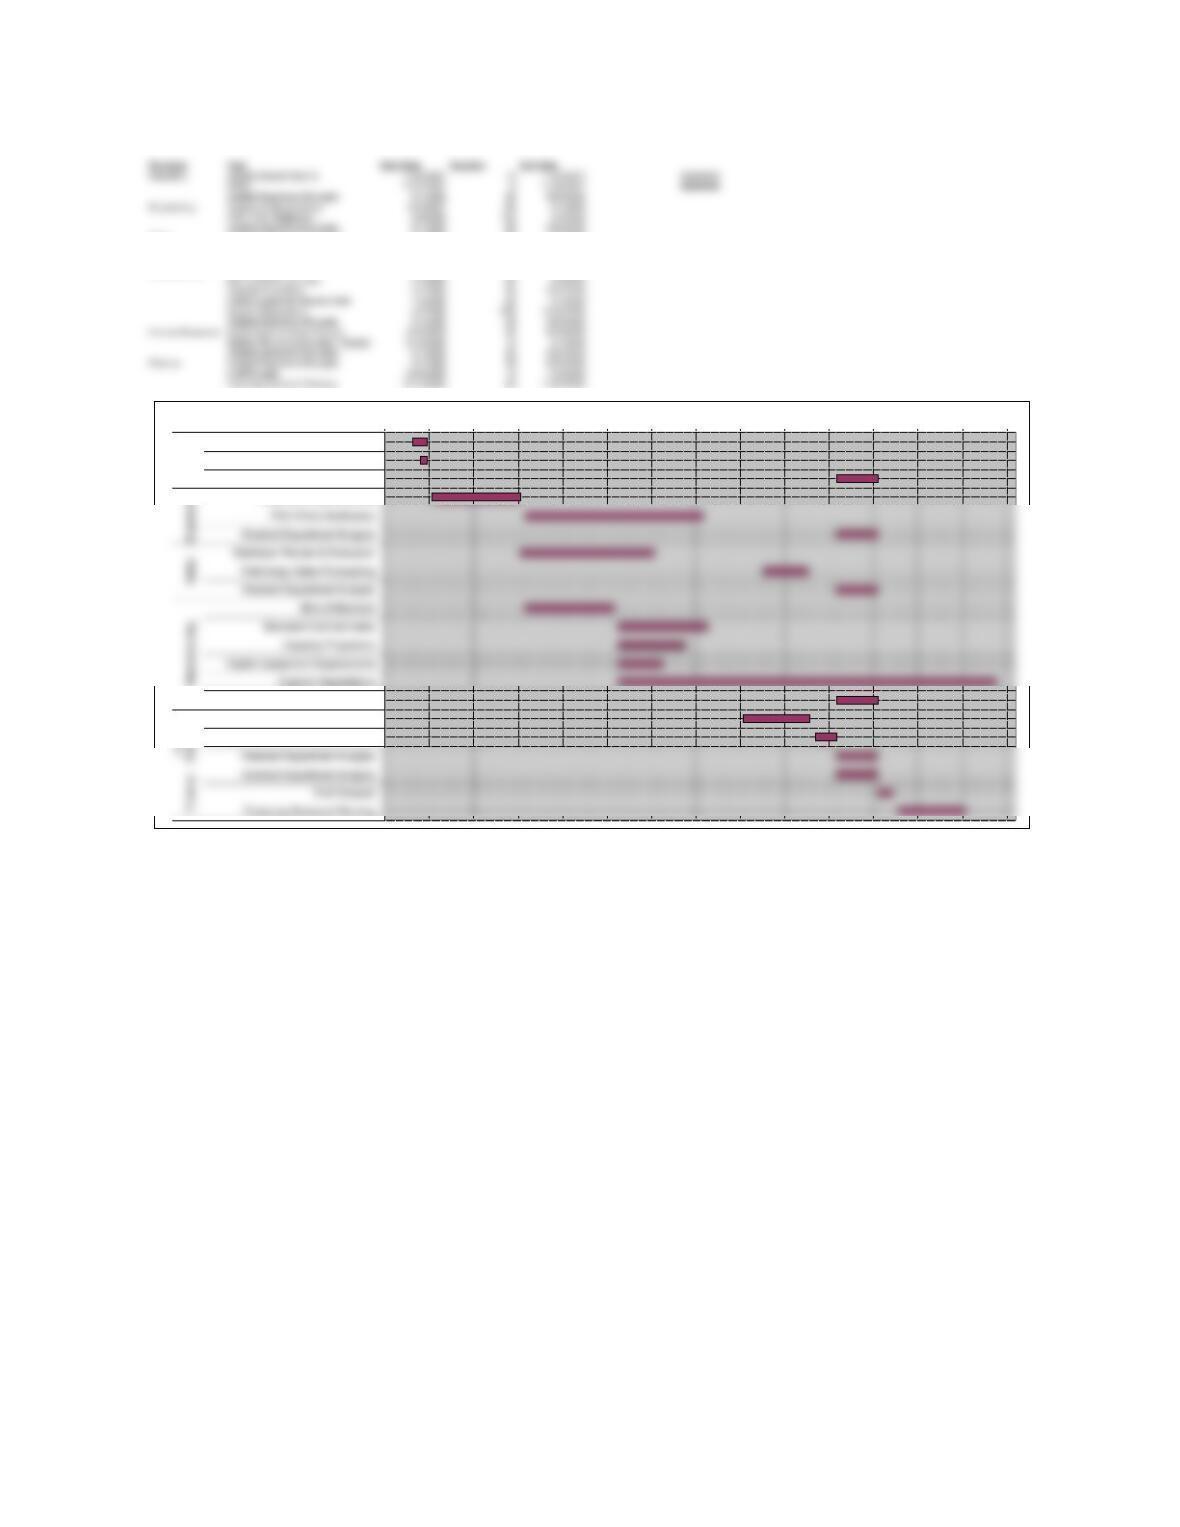
Sales Distributor Review & Evaluation 2/1/2008 90 5/1/2008
Preliminary Sales Forecasting 7/14/2008 30 8/13/2008
Detailed Department Budgets 9/1/2008 28 9/29/2008
Manufacturing Bills of Materials 2/4/2008 60 4/4/2008
Standard Cost Estimates 4/7/2008 60 6/6/2008
Capacity Projections 4/7/2008 45 5/22/2008
Capital Equipment Requirements 4/7/2008 30 5/7/2008
Supplier Negotiations 4/7/2008 255 12/18/2008
Detailed Department Budgets 9/1/2008 28 9/29/2008
Human Resources Market Salary & Wage Surveys 6/30/2008 45 8/14/2008
Staffing Plan & Compensation Budget 8/18/2008 14 9/1/2008
Detailed Department Budgets 9/1/2008 28 9/29/2008
Finance Detailed Department Budgets 9/1/2008 28 9/29/2008
Draft Budgets 9/29/2008 10 10/9/2008
Financing Review & Planning 10/13/2008 45 11/27/2008
Nov Dec Dec Jan Feb Mar Apr May Jun Jul Aug Sep Oct Nov Dec
Industry Analyst Reports
RSNA
Detailed Department Budgets
Features & Specifications
Detailed Department Budgets
Market Salary & Wage Surveys
Staffing Plan & Compensation Budget
MarketingEngineeringSalesManufacturing
Marketing Industry Analyst Reports 11/20/2007 10 11/30/2007 ########
Detailed Department Budgets 9/1/2008 28 9/29/2008
Engineering Features & Specifications 12/3/2007 60 2/1/2008
FDA 510(k) Notification 2/4/2008 120 6/3/2008
Detailed Department Budgets 9/1/2008 28 9/29/2008