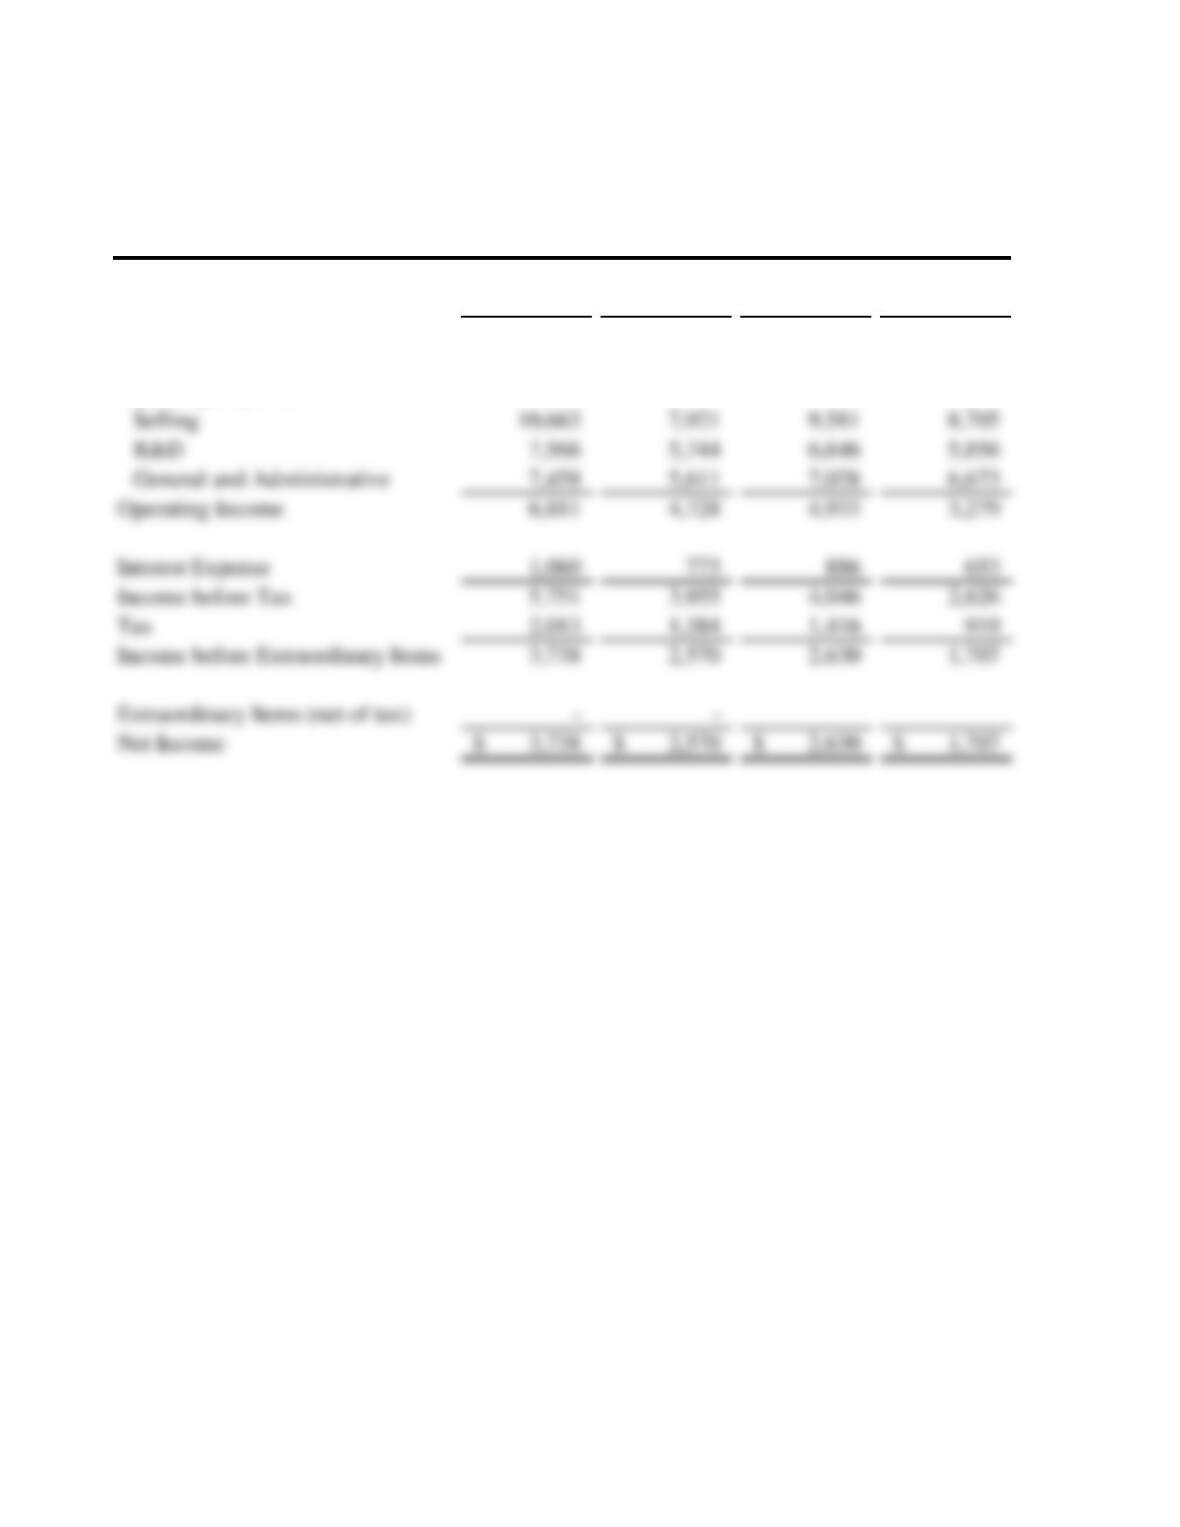
Income Statement
2008
(Pro Forma)
9 Months
Ended
9/30/08
2007 2006
Revenues (net) 59,766$ 44,227$ 52,994$ 47,443$
Cost of Goods Sold 27,269 20,224 24,806 22,930
Gross Margin 32,498 24,003 28,188 24,513
Operating Expenses
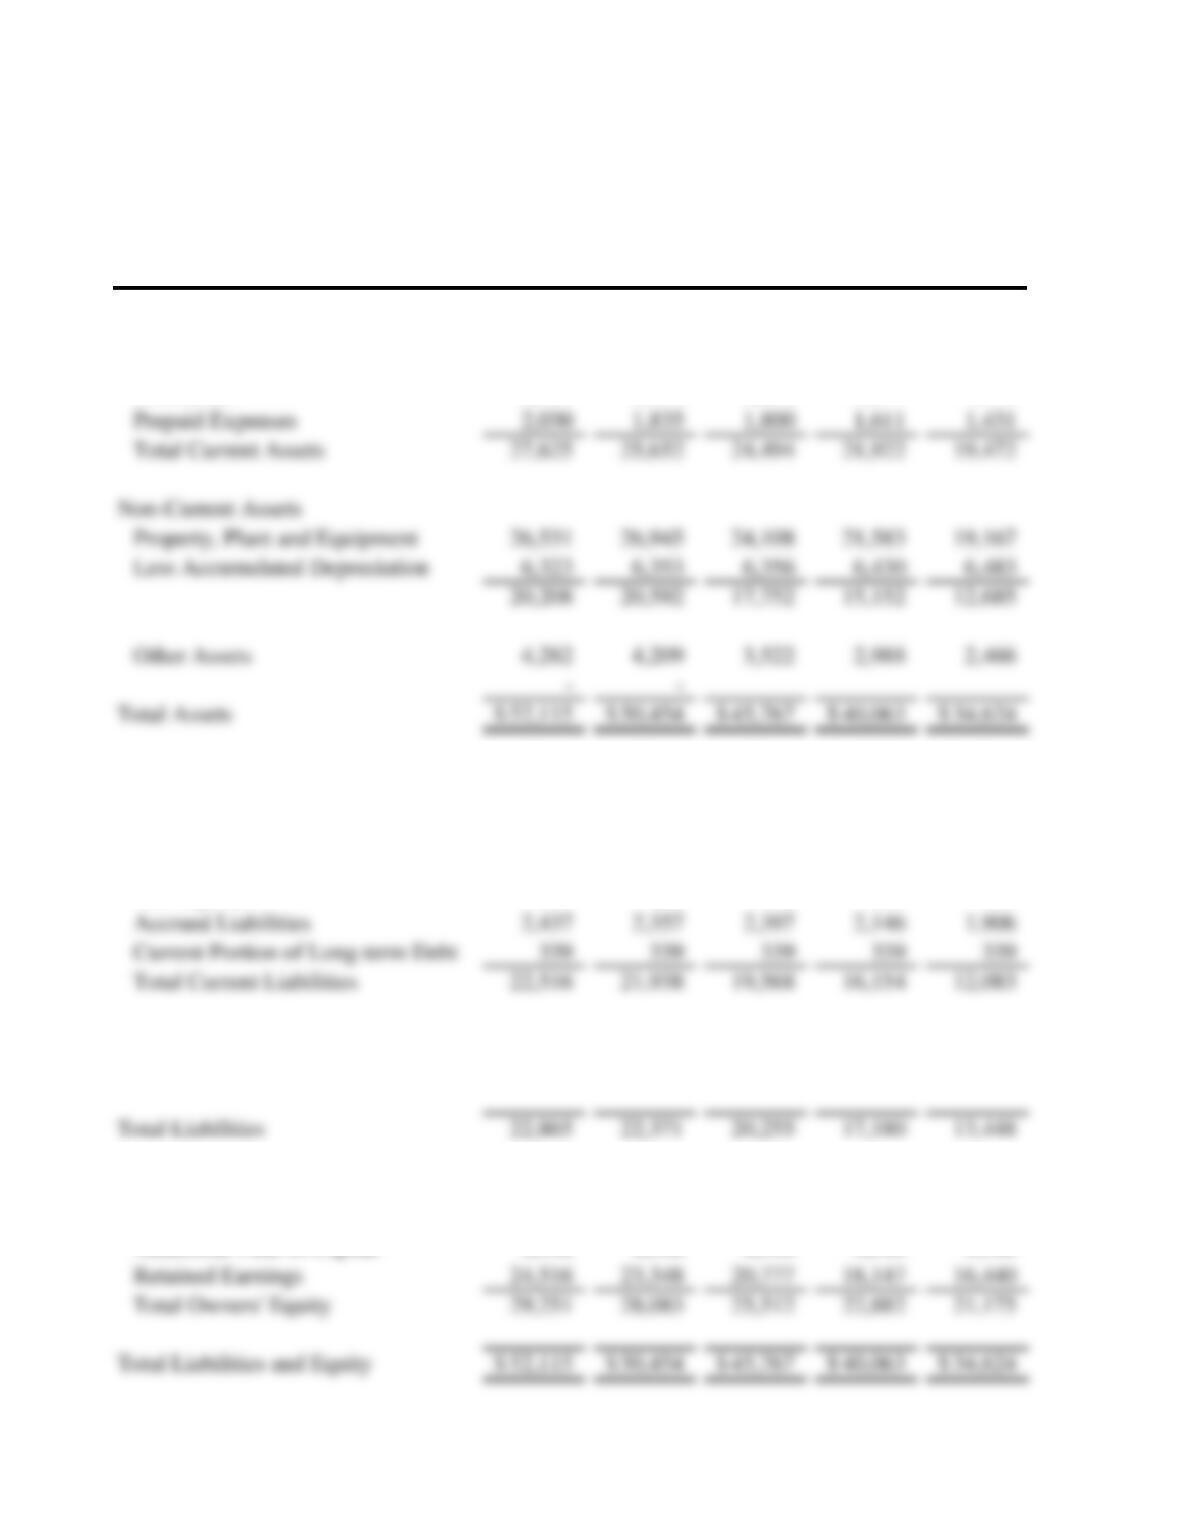
Balance Sheet
2008
(Pro
Forma)
9 Months
Ended
9/30/08
2007 2006 2005
Current Assets
Cash 5,930$ 5,448$ 5,258$ 4,701$ 4,178$
Accounts Receivable (net) 12,898 12,153 11,436 10,238 9,093
Inventories 6,767 6,216 6,000 5,371 4,770
Current Liabilities
Accounts Payable 4,496 4,348 4,423 3,960 3,516
Notes Payable 14,860 14,640 12,040 9,470 6,210
Tax Payable 384 253 368 239 111
Non-Current Liabilities
Long-term Debt 348 433 687 1,027 1,366
Owners’ Equity
Common Stock 189 189 189 189 189
Additional Paid-in-Capital 4,546 4,546 4,546 4,546 4,546
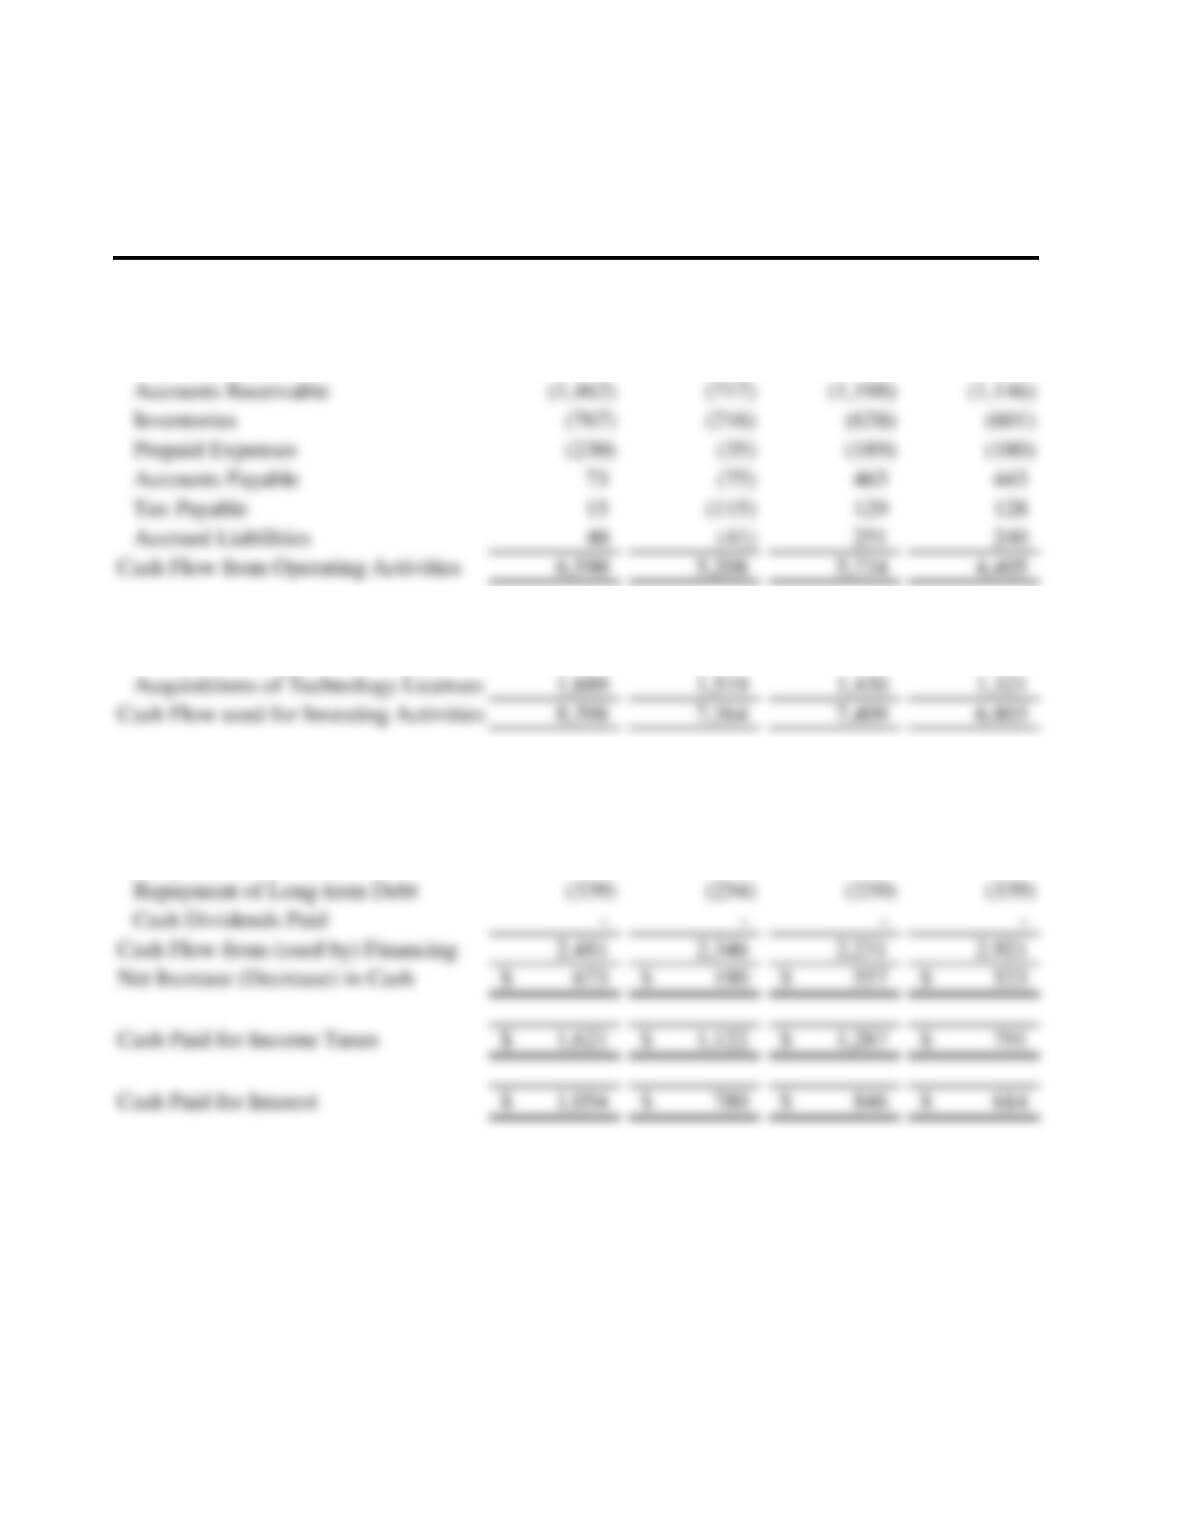
Statement of Cash Flows
2008
(Pro Forma)
9 Months
Ended
9/30/08
2007 2006
OPERATIONS:
Net Income 3,738$ 2,570$ 2,630$ 1,707$
Adjustments to Reconcile:
Depreciation and Amortization 5,182 3,836 4,275 3,813
INVESTING:
Additions to PP&E 6,509 5,845 5,978 5,482
FINANCING:
Borrowing of Notes Payable 14,860 11,510 12,040 9,470
Repayments of Notes Payable (12,040) (8,910) (9,470) (6,210)
Long-term Borrowing – – – –
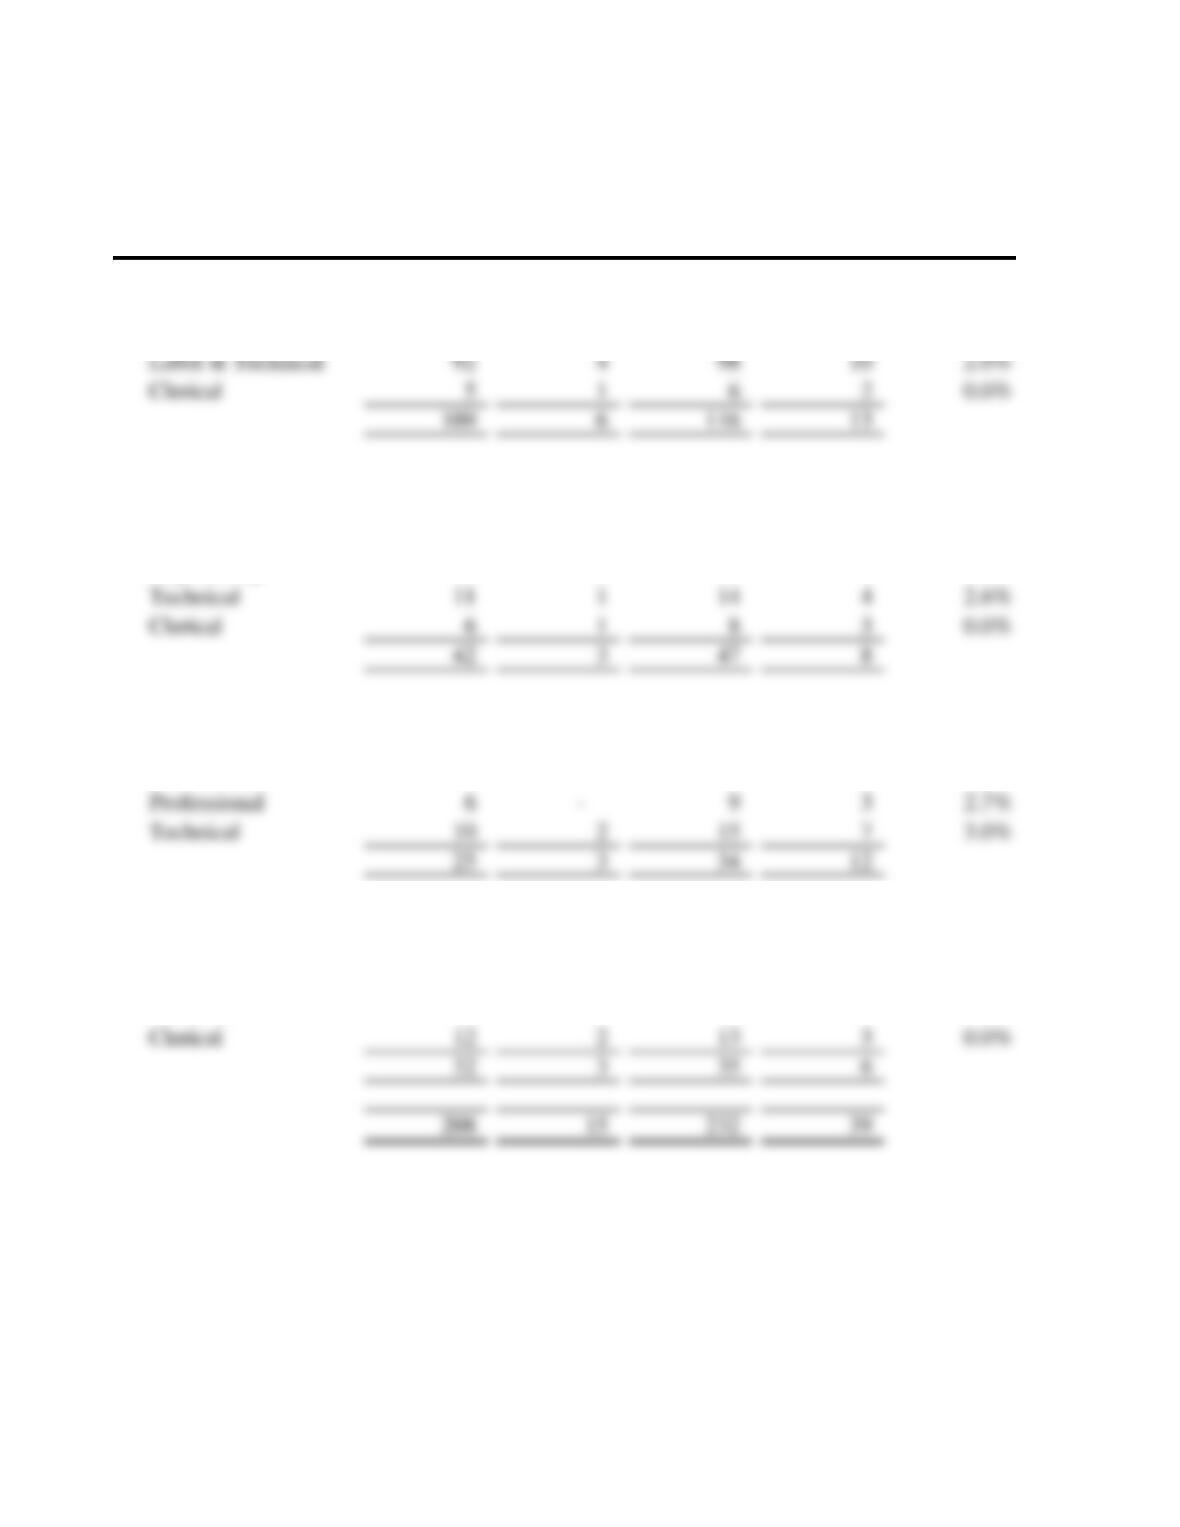
Staffing Budget
Current
FTE
Estimated
Attrition
Requested
FTE
Anticipated
Need
(Excess)
Estimated
Market
Adjustment
Manufacturing:
Management 4 – 4 – 3.0%
Supervisory 8 1 8 1 2.0%
Engineering:
Management 4 – 4 – 3.5%
Science 5 – 5 – 3.0%
Engineering 16 1 16 1 3.6%
Sales & Marketing:
Management 5 – 5 – 2.0%
Commissioned 4 1 5 2 1.5%
Finance Division:
Management 5 – 5 – 3.0%
Professional 9 1 9 1 3.0%
Technical 6 8 2 1.8%
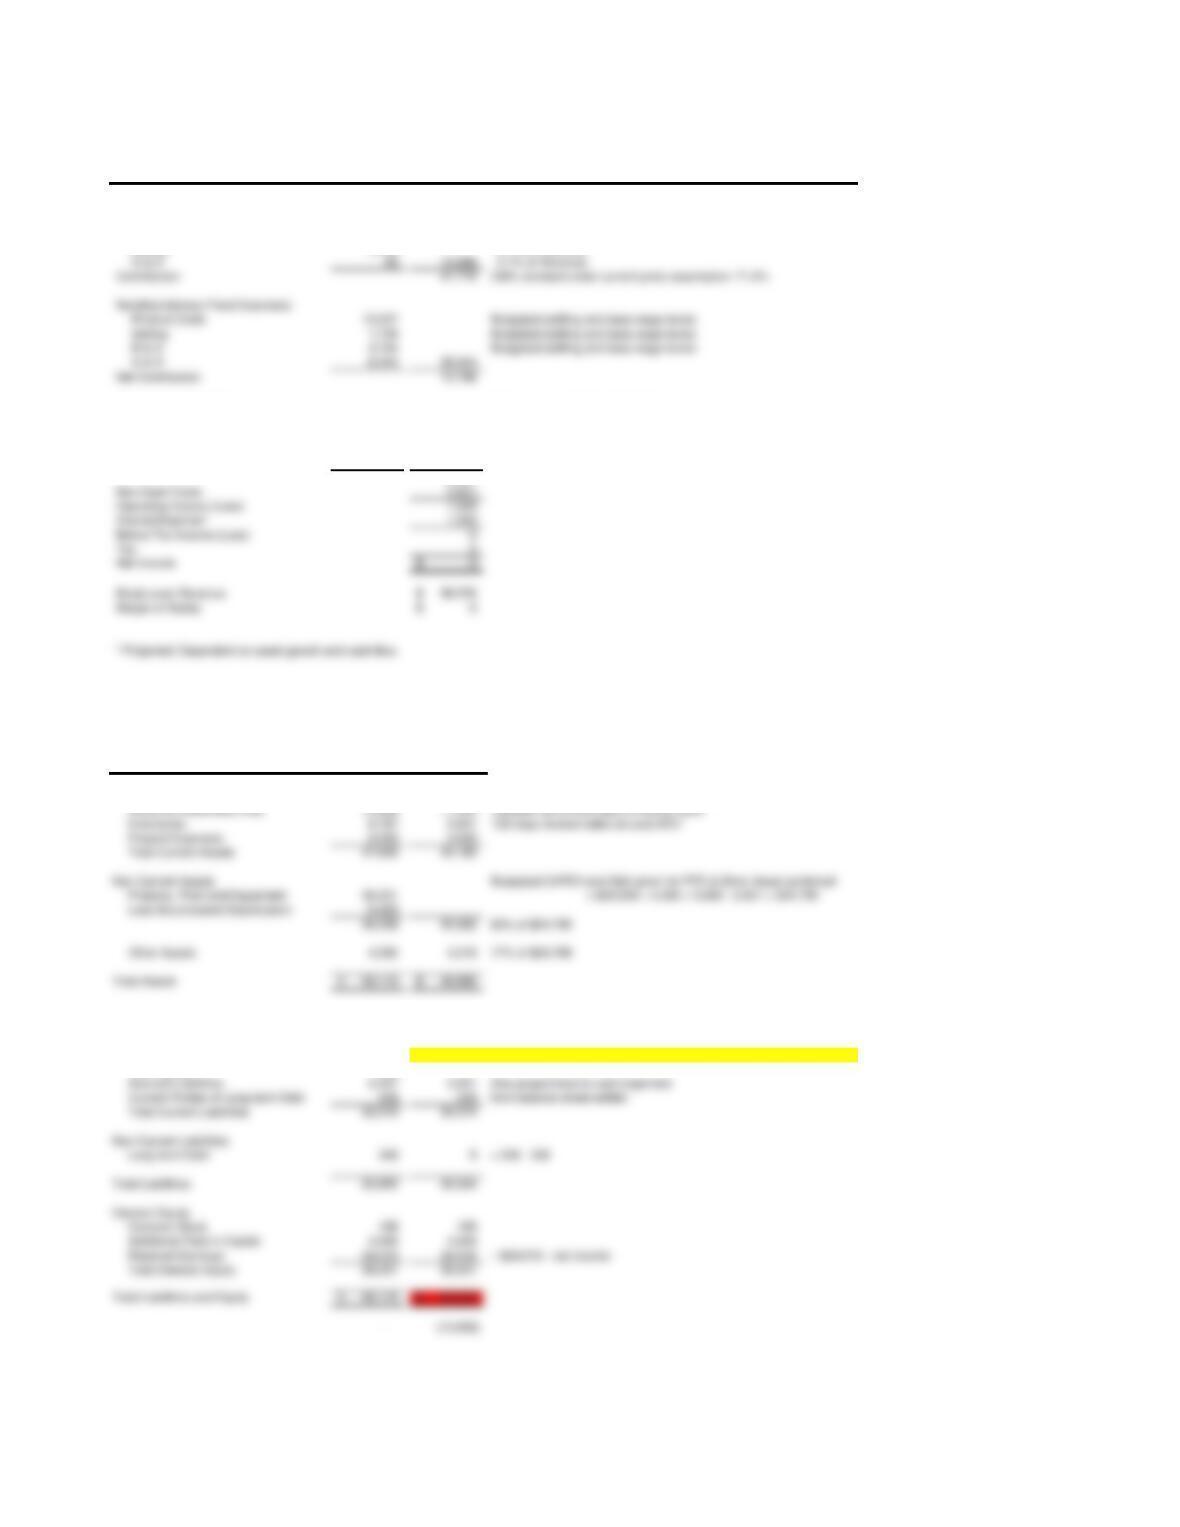
2009 Budgeted Income Summary
Comments & Analysis
Revenues (net) 65,743$ 10% Growth
Cost of Goods
Direct Materials 12,742
Operating Expense
Selling
Salary & Wages 2,807 Includes est. commissions of $965 + $190 mgmt. bonus
Research & Development
Salary & Wages 4,934 Includes $210 for management bonuses
Depr. & Amortization 1,712 Includes $430 on 2009 investments.
Gen. & Admin.
Salary & Wages 6,567 Includes $445 for management bonuses
Total % Variable Variable Fixed
Revenues (net) 65,743$ 100% 65,743$ –
Cost of Goods
Direct Materials 12,742 100% 12,742 –
Direct Labor 6,959 0% – 6,959
Mfg. Overhead – –
Operating Expense
Selling
Salary & Wages 2,807 34% 965 1,842
Marketing & Advertising 5,036 15% 755 4,281
Gen. & Admin.
Salary & Wages 6,567 0% – 6,567
Depr. & Amortization 791 0% – 791
2009 Contribution I/S Percentage
Revenues 58,796$ 100.0%
Variable Expenses:
Fixed Expenses:
Product Costs 16,345$
Selling 6,210
Dollars
Balance Sheet FYE 2008 FYE 2009
Current Assets
Cash 5,930$ 5,652$ “five weeks operating expenditures”
Accounts Receivable (net) 12,898 12,079 “between 60 and 80 days of trailing sales”
Current Liabilities
Accounts Payable 4,496 4,496
Notes Payable 14,860 13,867 This should be the plug (goal seek: A = L +OE)
Tax Payable 384 –
Accrued Liabilities 2,437 2,437
Current Portion of Long-term Debt 339 339 from balance sheet exhibit
Total Current Liabilities 22,516 21,140
Non-Current Liabilities
Long-term Debt 348 9 = 348 – 339
Total Liabilities 22,865 21,149
Owners’ Equity
Common Stock 189 189
Additional Paid-in-Capital 4,546 4,546
Retained Earnings 24,516 24,516 = $24,516 + 0 (break even => zero net income)
Total Owners’ Equity 29,251 29,251
– –
Prepaid Expenses 2,030 2,030
Total Current Assets 27,625 25,601
Non-Current Assets Budgeted CAPEX and D&A given for PPE & Other Asset combined
Property, Plant and Equipment 26,531 = $20,208 + 4,282 + 5,960 – 5,651 = $24,799
Less Accumulated Depreciation 6,323
Other Assets 4,282 4,336 17%
Statement of Cash Flows
2008
(Pro Forma)
2009
(Breakeven)
OPERATIONS:
Net Income 3,738$ –$ Breakeven net income is zero
Adjustments to Reconcile:
Depreciation and Amortization 5,182 5,651 Provided in the budget
INVESTING:
Additions to PP&E 6,509
Acquistitions of Technology Licenses
1,889
Cash Flow from (used by) Financing 2,481 (1,332)
2009 Contribution Income Statement Assumption – 14% – 50%
Revenues 58,576$ Breakeven at current price levels 51,399$ 29,883$
Variable Expenses:
Product Costs 12,032$ 20.5% of Revenue
Selling 4,768 8.1% of Revenue
Discretionary Fixed Expenses: Managers awarded budgeted bonuses
Product Costs 160
Selling 4,471
R & D 1,889
G & A 2,505 8,865
6,901
Non-Cash Costs 5,651
Operating Income (Loss) 1,250
Interest Expense* 1,250
Before Tax Income (Loss) 0
Break-even Revenue 58,576$
Margin of Safety 0$
Balance Sheet FYE 2008 FYE 2009
Current Assets
Cash 5,930$ 5,089$ “five weeks operating expenditures”
Accounts Receivable (net) 12,898 11,234 “between 60 and 80 days of trailing sales”
Prepaid Expenses 2,030 2,030
Total Current Assets 27,625 24,183
Non-Current Assets Budgeted CAPEX and D&A given for PPE & Other Asset combined
Less Accumulated Depreciation 6,323
Other Assets 4,282 4,216 17% of $24,799
Current Liabilities
Accounts Payable 4,496 3,858 Cash based on operating expense, A/R proportional to cash
Notes Payable 14,860 27,286 This should be the plug (goal seek: A = L + OE)
Tax Payable 384 –
Accrued Liabilities 2,437 2,091 Also proportional to cash/expenses
Current Portion of Long-term Debt 339 339 from balance sheet exhibit
Total Current Liabilities 22,516 33,574
Non-Current Liabilities
Long-term Debt 348 9 = 348 – 339
Total Liabilities 22,865 33,584
Owners’ Equity
Common Stock 189 189
Additional Paid-in-Capital 4,546 4,546
Total Owners’ Equity 29,251 29,251
G & A 66 16,866 0.1% of Revenue
Nondiscretionary Fixed Expenses:
Product Costs 13,037 Budgeted staffing and base wage levels
Selling 1,739 Budgeted staffing and base wage levels
R & D 4,724 Budgeted staffing and base wage levels
G & A 6,444 25,944
Net Contribution 15,766
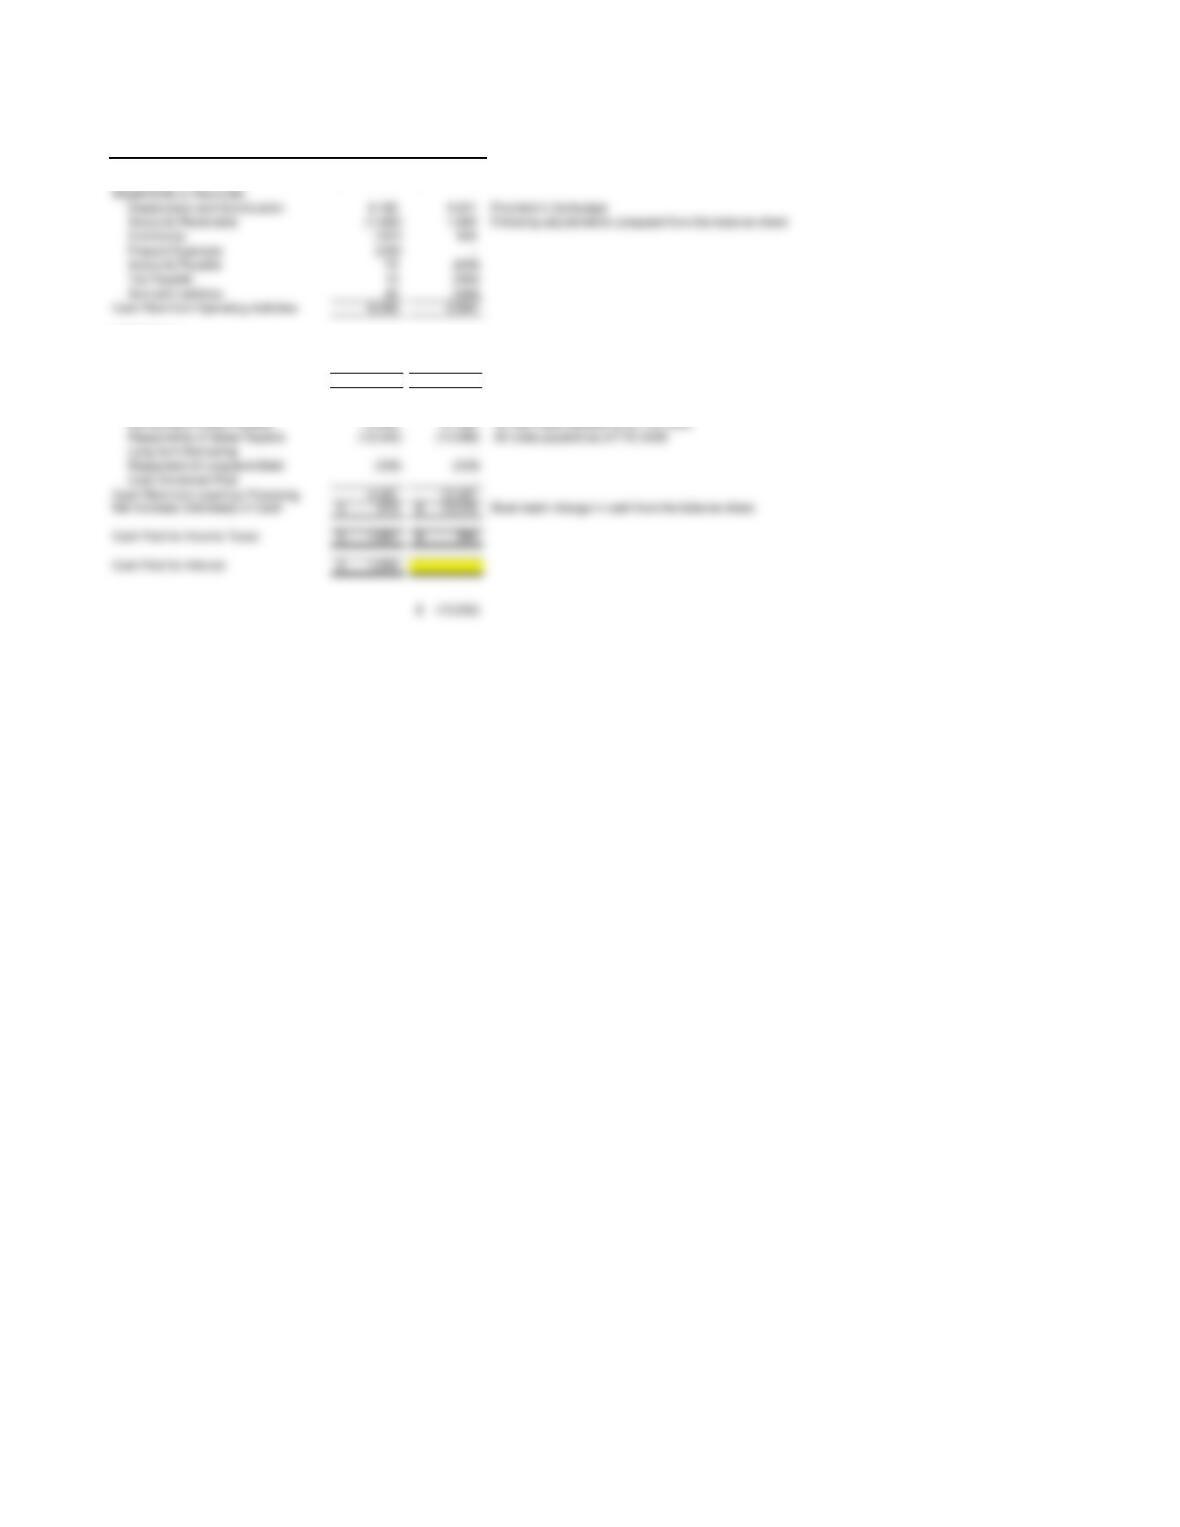
Statement of Cash Flows
2008 2009
OPERATIONS:
Net Income 3,738$ 0$
INVESTING:
Additions to PP&E 6,509
Acquistitions of Technology Licenses 1,889
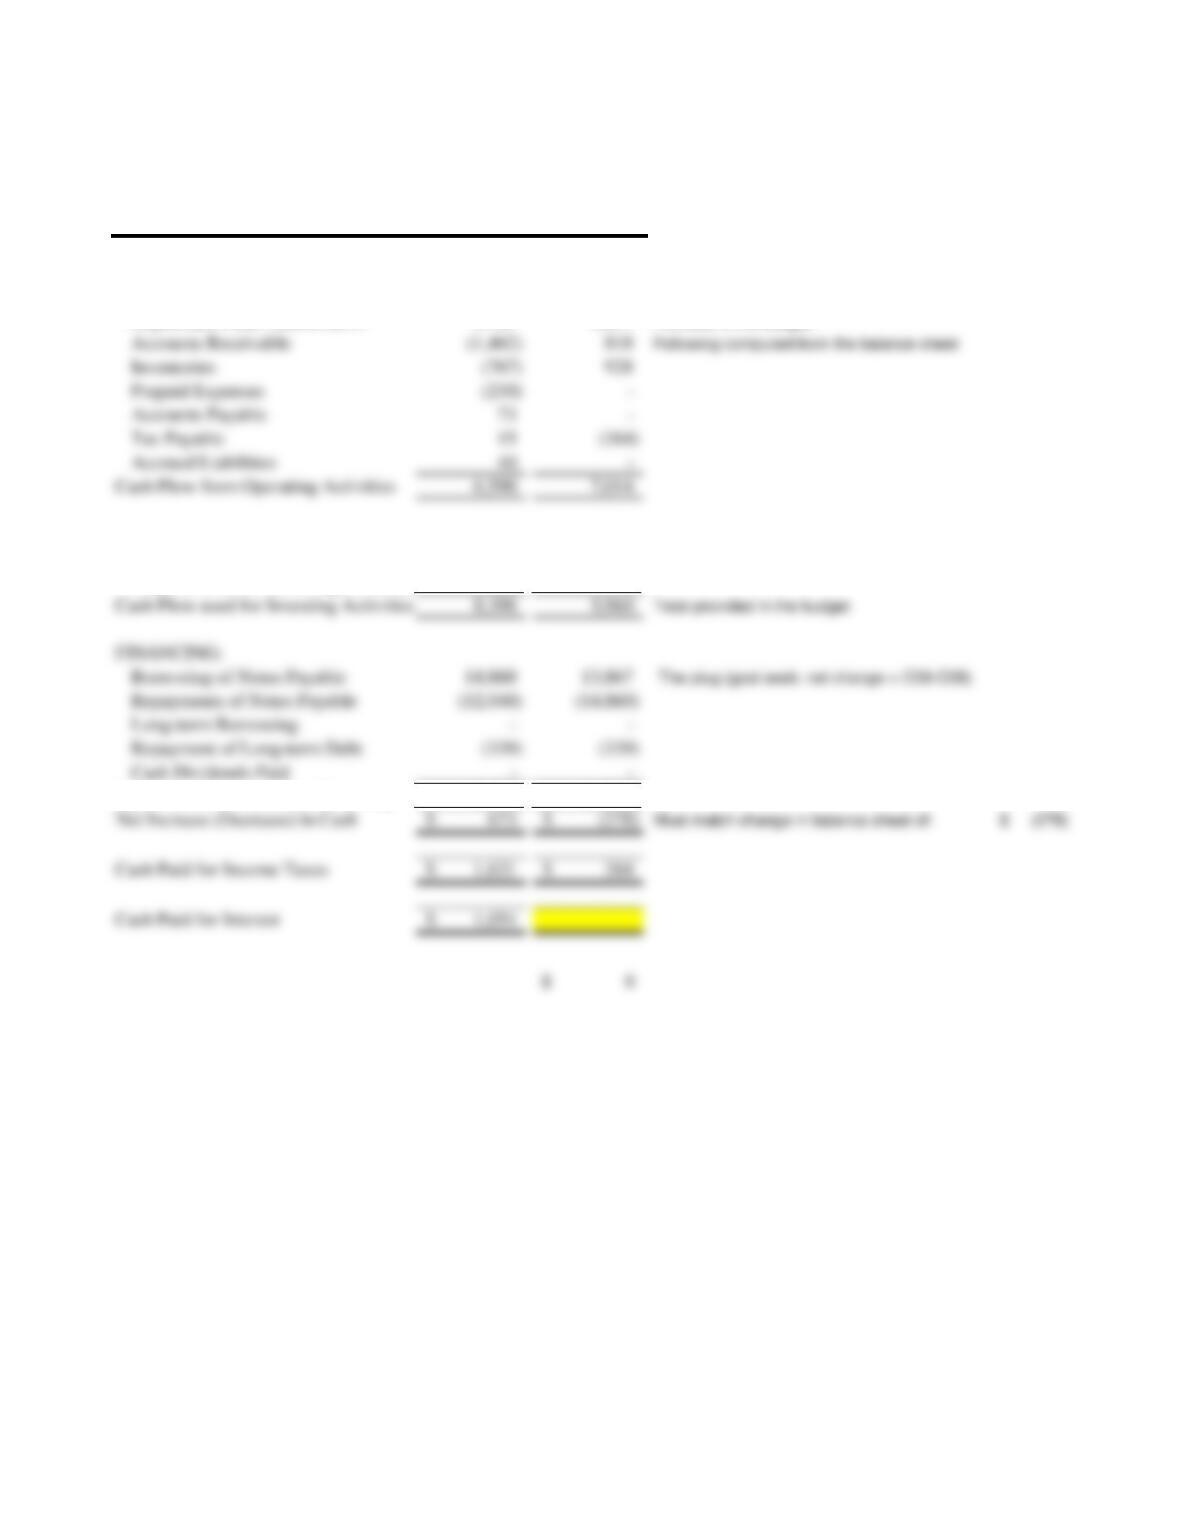
Cash Flow used for Investing Activities 8,398 5,960 Total provided in the budget
FINANCING:
Borrowing of Notes Payable 14,860 27,286 All new notes payable as of FYE 2009
Repayments of Notes Payable (12,040) (14,860) All notes payable as of FYE 2008
Long-term Borrowing – –
Repayment of Long-term Debt (339) (339)
Cash Dividends Paid – –
Cash Flow from (used by) Financing 2,481 12,087
Adjustments to Reconcile:
Depreciation and Amortization 5,182 5,651 Provided in the budget
Accounts Receivable (1,462) 1,664 Following adjustements computed from the balance sheet
Prepaid Expenses (230) –
Accounts Payable 73 (638)
Tax Payable 15 (384)
Accrued Liabilities 40 (346)
Cash Flow from Operating Activities 6,590 6,884