Business Communication: In Person, In Print, Online
INSTRUCTOR’S GUIDE
Chapter 9
Planning the Report and Managing Data
Overview
Data sources are selected by their relevance and accuracy; generally,
library searches are better than broad Internet searches to find sources
for reports. All secondary data sources—online sources and research
studies—should be evaluated.
Learning Objectives
• Find relevant sources for a report.
• Evaluate the quality of data.
• Develop a questionnaire and cover letter.
9e
Quick Links for Chapter 9
PPT Slides | Solutions to Exercises | Handouts | Video Suggestions | Company Examples | BizCom in the News
Teaching Suggestions
Resources
LO1: Find relevant sources for a report.
INTRODUCE the role business reports play in an organization and the
ways to collect data for reports.
• Search for more data on the question. Do other sources support
or contradict this study? What do you conclude from all of your
research?
14–week business: DISCUSS types of data used for business reports.
INSTRUCT students to select two or three recent reports written and
published by their company or a recent employer. Ask students to
analyze what types of data the authors used and in what combinations.
Encourage students to analyze the writers’ decisions and share their
Resources
LO2: Evaluate the quality of data.
INTRODUCE ways to evaluate various sources of data—print and
electronic.
• Research the product using credible sources.
• Prepare a list for your classmates about the credibility of each
source. Rank the sources from the most credible to the least
credible.
Resources
LO3: Develop a questionnaire and cover letter.
INTRODUCE the concept of a questionnaire as a common way to collect
primary data for a business report.
Resources
LO3: Develop a questionnaire and cover letter.
for the study?
• What would have been a better approach to draw valid
conclusions?
textbook to design a survey that would assess the effectiveness of the
new government initiative. Encourage students to pay attention to all
three components of constructing a questionnaire: content,
organization, and format.
INSTRUCT each team to draft a cover letter to a government
representative to persuade him or her to evaluate the initiative using
the questionnaire.
DISTRIBUTE PPT slides with the questionnaire analysis tasks. Ask
students to analyze the questions to determine why some are not
appropriate. Possible answers include:
1. Sensitive question (use check-off responses instead)
2. Overlapping responses (not mutually exclusive)
Resources
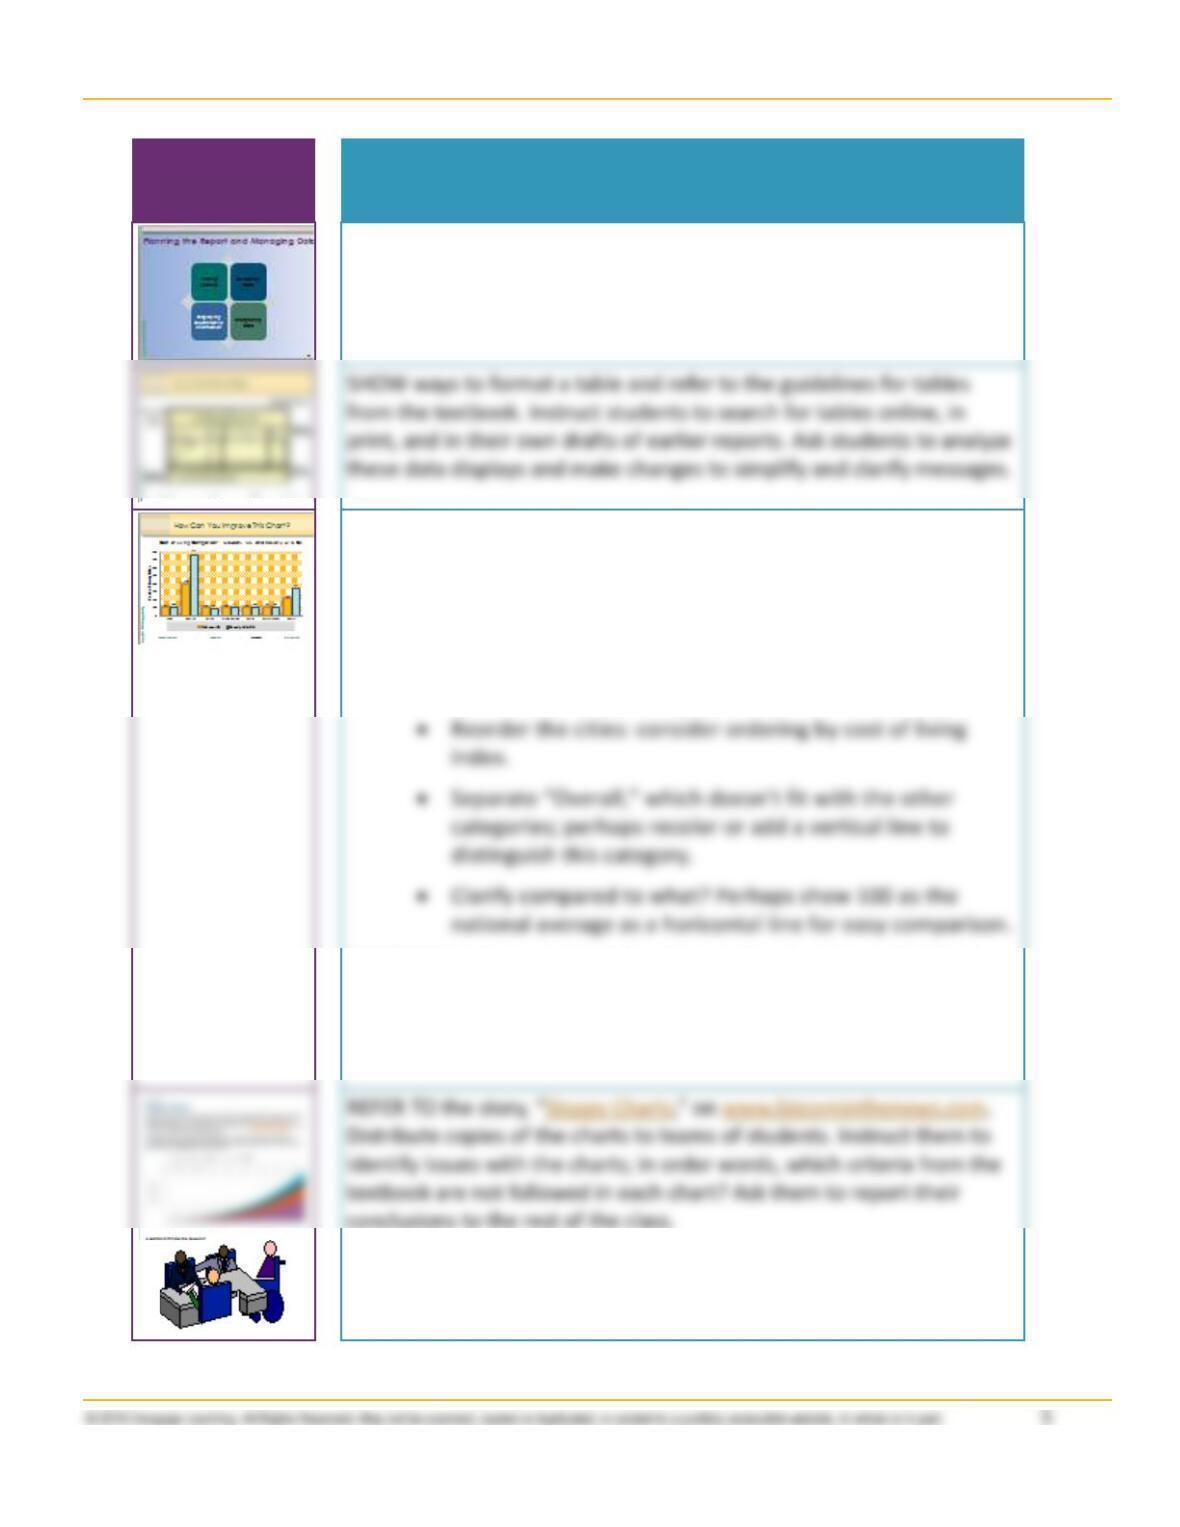
LO4: Construct tables and charts.
INTRODUCE the role visual aids play in a business report.
DISCUSS guidelines from the textbook for formatting an effective chart.
DISPLAY the PPT chart and ask students to critique it. Students may
identify the following areas for improvement:
• Remove chartjunk: garish bar design, garish background,
and shadow on the legend.
INSTRUCT students to search for charts online, in print, and in their
own drafts of earlier reports. Ask students to analyze these data
displays and make necessary changes to simplify the displays and make
the messages more clear.
INSTRUCT students to recreate their chart to meet business
communication principles.
Resources
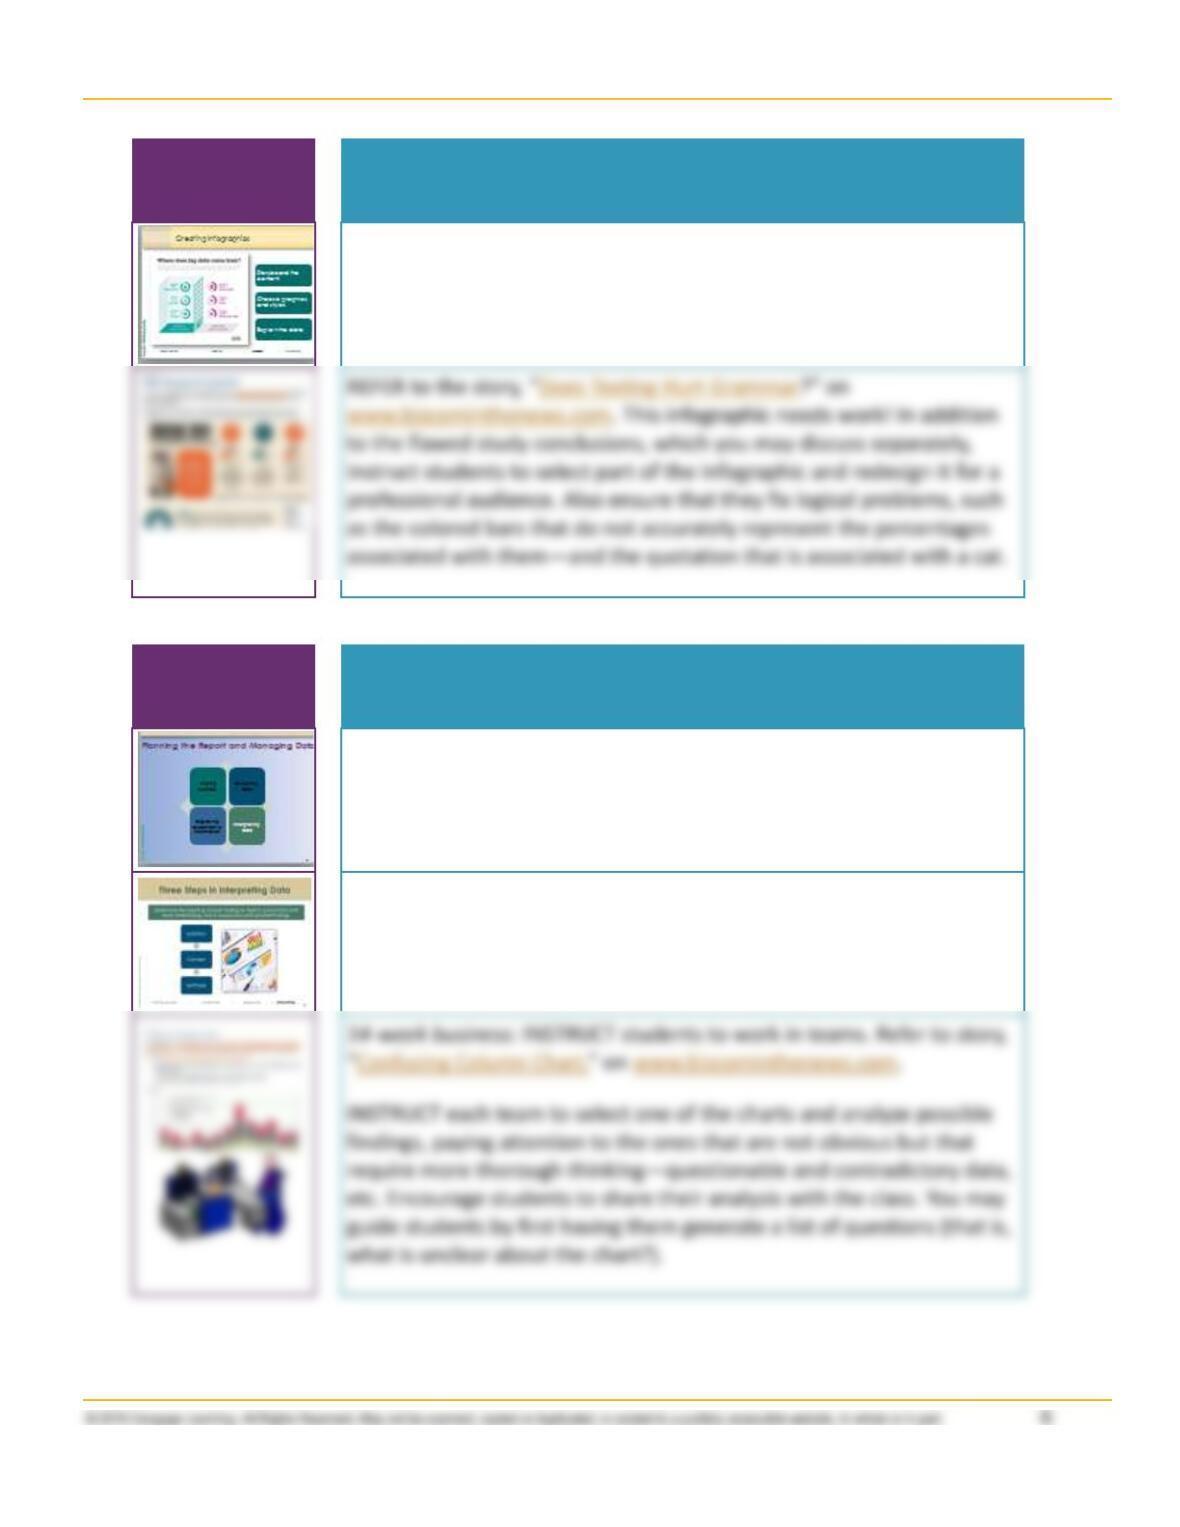
LO4: Construct tables and charts.
DISCUSS the value and increasing popularity of infographics.
professional audience. Also ensure that they fix logical problems, such
as the colored bars that do not accurately represent the percentages
associated with them—and the quotation that is associated with a cat.
Resources
LO5: Interpret data for the report reader.
INTRODUCE the importance and various ways of analyzing and
interpreting data.
DISTRIBUTE the handout “Three Steps in Interpreting Data.” Instruct
students to apply these three steps to interpreting a data display from
any business report. (An annual report could be a good source.)
Encourage students to share their observations with the class.
require more thorough thinking—questionable and contradictory data,
etc. Encourage students to share their analysis with the class. You may
guide students by first having them generate a list of questions (that is,
what is unclear about the chart?).
Solutions to Exercises
3Ps in Practice: Developing a Questionnaire About Online Search
Process
1. Brainstorm for 10 minutes. List every possible question you might ask the customers; at
this point, don’t worry about the wording of the questions or their sequence.
Students may identify questions about demographics, particular items at the site,
2. Review your questions. Are all of them necessary to get information about search
experience?
3. Edit your questions to ensure that they are clear and unbiased.
4. Arrange the questions in some logical order.
After students have arranged their questions in what seems to be a logical order, it will
5. Where possible, format each question with check–off responses, arranging the
responses in some logical order.
Guidelines for questionnaire questions presented in this chapter of the textbook should
be followed for this exercise.
6. Do any of the questions ask for sensitive information, or are any of them difficult to
answer? If so, how will you handle these questions?
Students may not have sensitive questions for this activity, but if they do (for example,
7. What information other than the questions themselves should you include on the
questionnaire?
The questionnaire should contain a descriptive title, clear directions, the name and
address of the researcher, and examples of any complex check-off responses.
Product
Students’ questionnaires should be evaluated on how well they have followed appropriate
guidelines for developing questionnaire questions.
1. Find relevant sources to support a business decision.
Students should begin by factoring the problem: determining what data they need to collect.
2. Compare search results on Google, Google Scholar, and a library
database.
Students should run their own analysis similar to Figure 4 in the chapter to evaluate the results
3. Find data to decide whether to open a store.
Student responses will vary depending on which databases they use. If you have people
available, remind students that a meeting with a professional librarian may be helpful.
4. Write a memo to improve accuracy in reporting.
This exercise will demonstrate if students understand the material presented for evaluating the
quality of data. Critique students’ memos based on the quality of writing and content.
5. Evaluate the quality of Internet resources.
Look to see that students have performed a thorough evaluation of the two Internet resources
6. Distinguish between high– and low–quality Internet sources.
Students can select any individual they admire. Students should learn to evaluate their resources
7. Evaluate studies for a report.
Students should look for scholarly research using library databases. Ensure that students were
8. Create a questionnaire about a new restaurant.
Questionnaires should be thoughtful and well written but short. Encourage students to begin by
brainstorming: what information do they hope to gain? The questionnaire should follow the
9. Write a cover letter for your questionnaire.
The cover letter must be a persuasive message to convince the reader to take the time to
10. Write a questionnaire about ice cream flavors.
Students should create a questionnaire that will collect all the necessary data requested in this
exercise. Questionnaires should follow the guidelines presented in the chapter concerning
content, organization, and format; individual questions should be neutral, have clear language,
and contain well–defined, mutually exclusive responses. Example questions are as follows:
a) What is your favorite flavor of ice cream?
__ Chocolate
b) What price would you be willing to pay for a single scoop of ice cream?
__Less than $2.00
c) What kinds of novelty ice cream items would you like to see offered at an ice
cream parlor? (Check all that apply.)
__Banana Splits
11. Write a questionnaire about a new store.
Students should begin with a brainstorming process, determining all of the information that
12. Convert your questionnaire to an online survey.
The online survey sites can be useful distribution methods for surveys. Have students analyze any
13. Create an online survey for your classmates.
Student responses will vary. Students need to spend adequate time brainstorming what
14. Evaluate your classmates’ online surveys.
15. Create a chart to compare data.
16. Evaluate charts in a business publication.
The charts selected by students will vary: some charts will be good examples, and other charts
17. Determine which type of visual is best.
a) A line chart should be used because you are showing the daily fluctuations of
sales (trend over time).
b) A pie chart should be used to show what percentage of the total fixed cost
each fixed–cost item is.
f) A table could be used, with the first column showing the previous year’s total
sales for each region, the second column showing each region’s total sales for
this year, and the third column showing the percent of increase or decrease
for each region compared to the previous year. A bar chart may work well to
show the comparisons for a few cities, with the average of all cities (or the
national average) shown as a horizontal line.
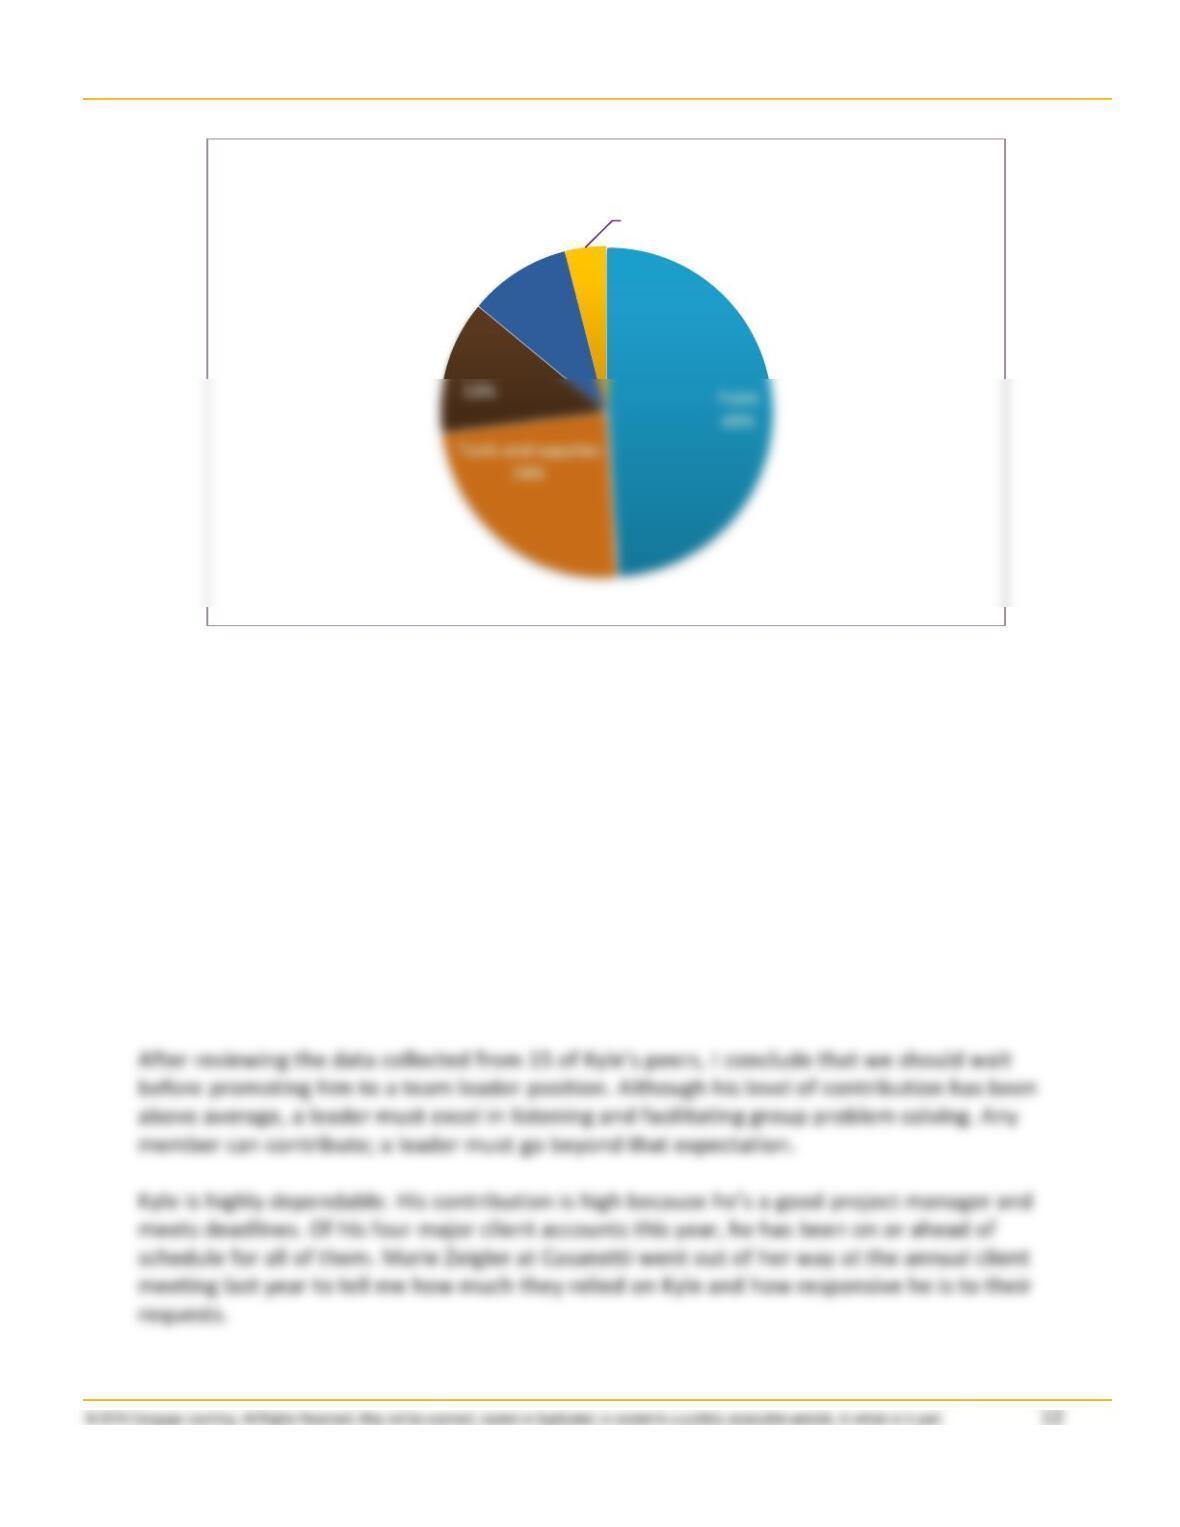
18. Construct a chart from data presented in a table.
This chart is intended to compare the revenue contribution of each product, where the sum of
the relative parts equals the whole. Students should begin slicing the pie at the 12 o’clock
position, beginning with the largest revenue contributor and ending with the smallest.
19. Create an infographic.
Infographics will vary based on the sets of data chosen by the group of students. Check the
clarity, accuracy, and design of their finished products.
20. Make sense of performance review data.
Based on the data provided in the table, it seems that Kyle Houston is best at contributing,
competent at facilitating group problem solving, and needs to work on listening. The email
that students compose to send to the manager should reflect this analysis with specific
examples that can be invented. An example email follows:
Marcie,
Stain
Wallpaper
10%
Home accents
4%
Revenue Contribution by Product
However, Kyle needs more work in listening and solving problems as a member of a team.
During a meeting with Mallow Reinforcements recently, Kyle interrupted both Jean and Larry
With more time and coaching, Kyle will be a great team leader in the future, but he’s not
ready yet.
Please let me know whether you would like more information or examples—and we can
certainly discuss this decision in person if you prefer.
Best regards,
Eric
21. Determine whether statements accurately represent data.
a) The majority of males and females believe Apex is an asset to the community, but
males rate Apex much higher than females do.
b) The table does not tell how many females—or males—did not respond to the
question; 22 percent of the females disagreed with the statement.
f) More females agreed with the statement than disagreed with it.
g) Four-fifths of the respondents indicated that they felt that Apex is an asset to the
community. However, we have no way of knowing how sampling was done to
determine whether the sample is representative of all residents.
j) The table does not indicate that “8 percent of the company” is not an asset to the
community; about 8 percent of the respondents believed the company is not an
asset to the community.
22. Evaluate the ethics of a television promotion.
Students should first list all of the benefits Dr. Oz and Dr. Roizen claim of chia seeds. Then,
they should find research to support or deny each claim. Here is one interesting source