Marshall School of Business
University of Southern California
Bank of the Desert
Teaching Note
Purpose of Case
The Bank of the Desert (BoD) case was written to provide students with a performance
evaluation setting that is close to being as complex as that which managers face in real world
settings. The case is supported by a database containing several pieces of annual performance-
related data (i.e., measures, targets) from 253 branches of a large bank.
To solve the performance evaluation questions posed in the assignment, the students have to
decide which pieces of data to use and how to weight them in evaluating the branches
performances. When managers decide to use a multi-measure approach in a results control
system, how can they judge whether any particular combination of measures (and their
weighting) is good or bad? That is the big question presented in this case. Students can think of
Merchant & Van der Stede, Management Control Systems, 3rd edition, Instructors Manual
349
Suggested Assignment Questions
The assignment is presented in two parts, relating to the (A) and (B) cases. Both assignments
require students to use the BoD database that is available on the publishers website.
The assignment provides students with a lot of hints as to how to do the analyses (see
BoD (A) case:
1. Using only the data in the DB1 worksheet in the BoD database, calculate the correlations
between:
a. The two performance measures that are included in the branch incentive system:
number of sales per FTE (column AH in the database) and cross-sell ratio (column AF).i
b. Each of these measures and total branch profits (column Y).
c. The percent of target achievement for the two measures included in the incentive
system.ii
What do these correlations tell you?
2. If you were the president of the Branch Network (Annette Lo), where would you focus your
attention? Which branches need the most help? We will focus our class discussion only on
3. Using the banks system for evaluating branch performances for the purpose of assigning
bonuses, evaluate the performances of the same five branches as listed in question 2.
a. Would the employees of any of these branches be given zero bonuses because their
branch failed to achieve its performance targets?iii

350
BoD (B) case:
1. Working with the data in Worksheet DB2 only, calculate the market opportunity for each of
2. Calculate the customer retention opportunity for each branch.v
3. Add the market opportunity and customer retention opportunities to calculate a total
4. Rank all the branches (from 1 to 253) based on their total performance opportunities. Like
5. Repeat the analyses described in questions #14, but this time do the analysis by branch
6. Based on what you know now, if you were the president of the Branch Network (Annette
Lo), where would you focus your attention? What branches can make the greatest
improvements in performance?
7. What should BoDs retail branch management team do now?
Case Analysis
This is a challenging case. A primary purpose of assigning the case is to enable the students to
have hands-on experience with the database. But the approach to the teaching of this case will
necessarily depend on the quality of the students preparation of the case and the database
analyses. To enhance preparation, this case can be assigned to groups of students. In groups,
Merchant & Van der Stede, Management Control Systems, 3rd edition, Instructors Manual
351
correlated with value creation is good, or congruent. But individual measures that are highly
correlated with each other are redundant.
a. 0.05. This shows that the two measures are assessing different things; they are independent.
b. The cross-sell correlation with total branch profit is 0.27. The sales correlation is 0.36.
c. 0.26. Achievement of targets on one dimension provides some indication of achievement of
targets on the other dimension, but that indication of success is not particularly high.
In question 2, students must go to columns AF through AI to get the metrics currently in use.
Column AF gives the number of actual cross sell / total retail account for each branch. Column
The second part of the assignment, that for the (B) case, asks student to focus on the new,
proposed measurement system. The DB3 worksheet shows the solution!43 Column BF shows the
percentage customer value mix opportunity and column BG the dollar customer value mix
Merchant & Van der Stede, Management Control Systems, 3rd edition, Instructors Manual
352
In class, the instructor can begin with a brief introduction of the case and clarification of some
Sufficiency metrics refer to level of performance that each branch should achieve based on the
pre-establish targets. Branches are judged to be performing sufficiently well if they meet pre-
established targets. Opportunity metrics reflect the level of performance that each branch should
An alternative approach to introducing the case is by comparison to the Balanced Scorecard
(BSC), a stylized approach to a basket-of-measures system. The BoD case focuses the students
on the key issues involved in a baskets-of-measures system, but in a less complex setting.
After the introduction, selected student groups can report their rankings and briefly discuss the
branches whose rankings change substantially from one system to another. We have provided
the instructor with separate rankings under each system as well as rankings across the three
The instructor can then guide the students to answer some of the assignment questions. The
students should be able to evaluate the proposed system, understand the advantages and
disadvantages of the two systems and anticipate certain implementation issues.
Some issues that might be raised in class:
What are the differences between the opportunity metrics and sufficiency metrics?
Sufficiency metrics are primarily extrapolations from the past. The branches are judged by the
extent to which they meet pre-established targets. However, such metrics are heavily influenced
by performance in the past. For example, large performance increases in the current year
relative to the past year might only indicate low starting points. Opportunity metrics reflect the
Merchant & Van der Stede, Management Control Systems, 3rd edition, Instructors Manual
353
level of performance that each branch should reasonably be able to reach given its size, location,
and operating conditions.
Evaluate and compare the existing and proposed system based on the following measurement
criteria: congruence, understandability, controllability, and precision. Would you recommend
the CEO of BoD change to the proposed system? Why or why not?
Congruence with firm value
Congruence means that the performance measures will indeed lead to the achievement of the
Under the current performance measurement system, the two performance metrics, number of
both product sales and cross-sell ratio, are both positively correlated with branch profit (r = 0.36
and 0.27, respectively). A multiple regression analysis also indicates that both measures have
Under the proposed system, both market opportunity and retention opportunity are positively
correlated with branch profit (r = 0.42 and 0.06, respectively). However, the correlation between
retention opportunity and profit is rather low. In a multiple regression, market opportunity is
Controllability
Controllability means that the managers should be able to influence the performance measures
through their actions, or that the performance measures do not include effects on performance
that are largely outside the managers control. At first sight, the current performance metrics
Merchant & Van der Stede, Management Control Systems, 3rd edition, Instructors Manual
354
Understandability
The current performance metrics are more conventional and easier to understand than the
proposed opportunity metrics. One reason is that market and retention opportunities are defined
Precision
Precision refers to the accuracy with which a given quantity can be measured. As the
opportunity metrics depend heavily on the accuracy of clustering, they are subject to more
errors than the current measures.
How do the rankings for the five branches differ under the different performance
measurement alternatives? How does this affect the allocation of bonuses/incentives?
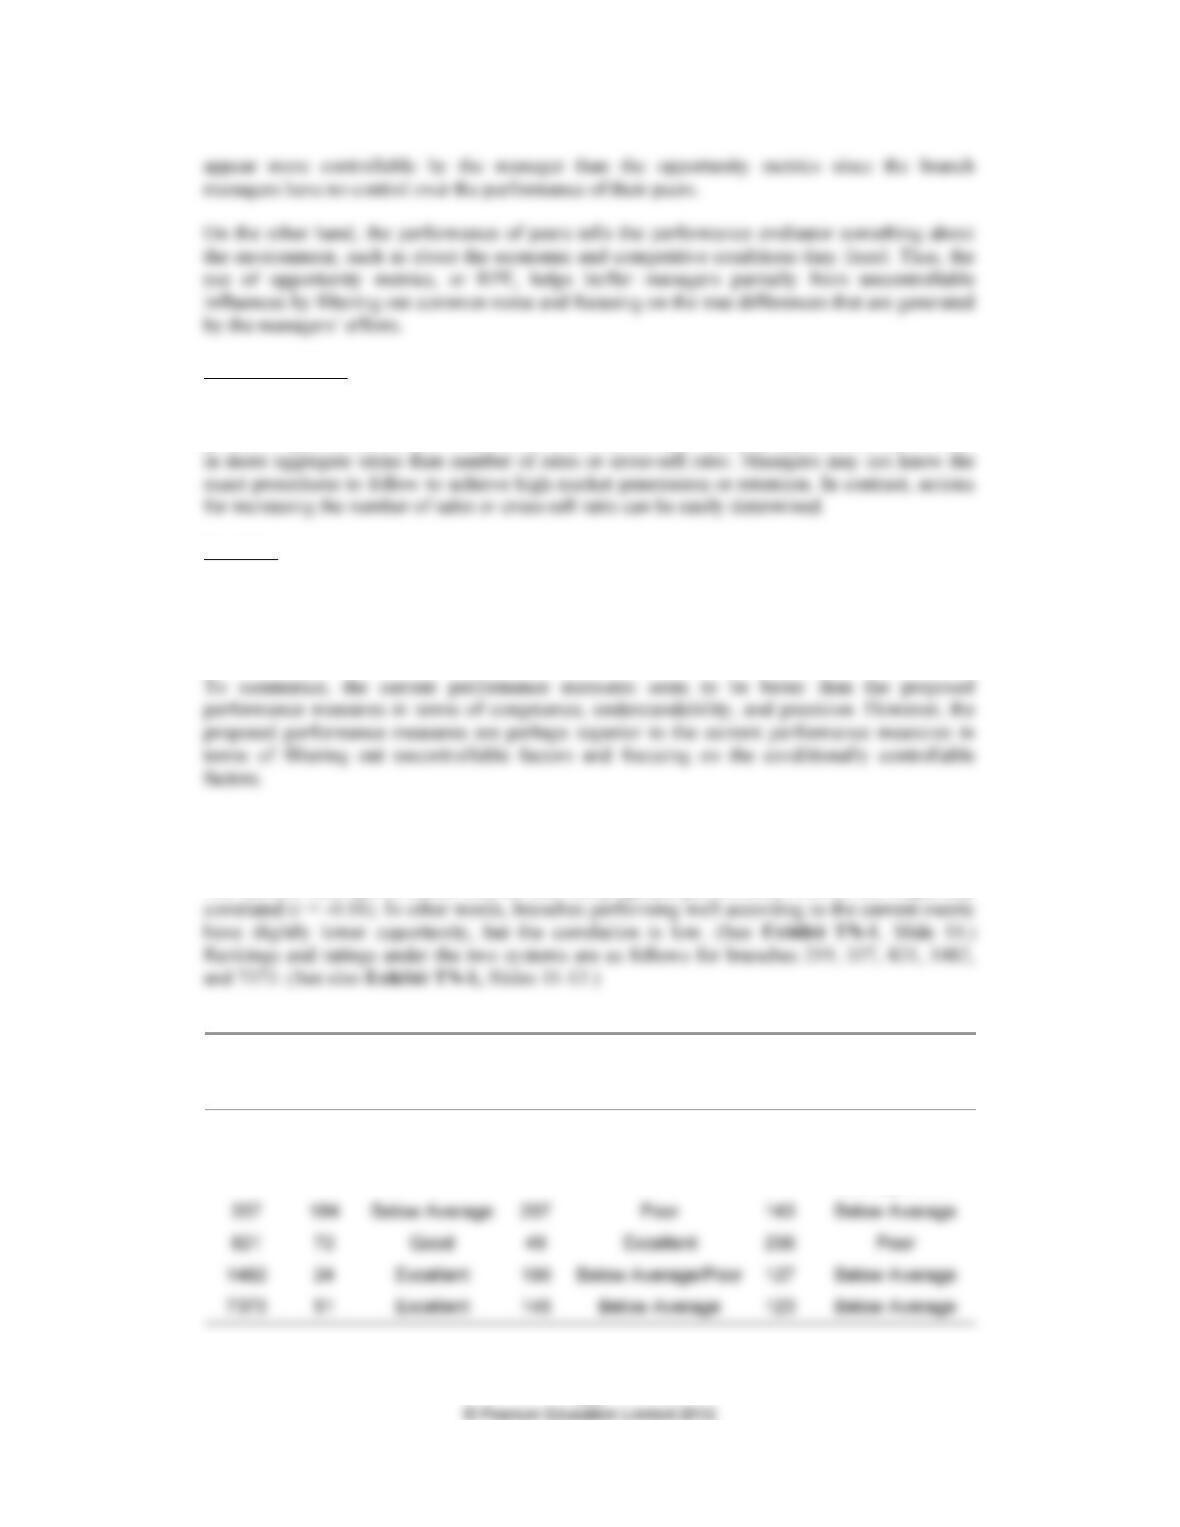
The current bank performance metrics and the proposed performance metrics are negatively
Current System
(75% Sales
25% Cross Sell)
Proposed System
(Overall sample
opportunity)
Proposed System
(Cluster-based
opportunity)
Branch Rank Rating Rank Rating Rank Rating
219 102 Good 226 Poor 193 Below
Average/Poor
355
1. The four ratings (Excellent, Good, Below Average, and Poor) correspond to the four
2. For some branches, rankings change dramatically when switched to the proposed
What should the bank managers do now?
If they follow the opportunity metrics analysis all the way through, most students will probably
be convinced that the banks managers should implement the new approach. It promises to
provide better evaluations, better focusing of attention, and better decision-making.
However, students should also understand that any of a number of problems might arise from
the implementation of the proposed system. First, bonus plans will have to be changed. Under
Third, managers may complain about the product cost data underlying these analyses. If the
product cost data are wrong, then all of the analyses following the use of those data are
questionable. Is the banks cost accounting system adequate for the purposes for which its data
are being used?
Fourth, when the opportunity is zero or negative, what would executives tell the branch

Merchant & Van der Stede, Management Control Systems, 3rd edition, Instructors Manual
356
Pedagogy
This case lends itself to different uses. It can be assigned as a student term project, or it can be
used to form the basis of discussion in either one or two class sessions.
In a single 75-minute class, we suggest a time plan like the following:
10 min. Talk about the company and introduce the proposed measurement system
including an explanation of difficult concepts.
Endnotes
i The Excel instruction for the calculation of a correlation coefficient is: CORREL(ARRAY1, ARRAY2) [under the fx button in
the toolbar of the Insert\Function menu].
ii Step 1: Calculate the percent achievement of the cross sell/total retail accounts target [Column AF Column AG].
Step 2: Calculate the percent achievement of the number of sales per FTE per day target [Column AH Column AI].
Step 3: Calculate the correlation coefficient between the two percent-achievement figures.
iv A) Calculation of Market Penetration Opportunity:
Dollar Market Penetration Opportunity = % Market Penetration Opportunity (Column BC) * Total number of HH served (Column Z) *
Average profit per HH (Column AB)
B) Calculation of Customer Value Mix Opportunity:
Step 1: Calculate the average percentage of households in the top two tiers across all the branches. (=AVERAGE (Column AU)).
Merchant & Van der Stede, Management Control Systems, 3rd edition, Instructors Manual
357
Step 4: Calculate the dollar amount of customer value mix opportunity using the following formula:
Dollar Customer Value Mix Opportunity = % Customer Value Mix Opportunity * Difference in customer profitability in top two
tiers and in bottom two tiers (Column AT) * Total number of HH served (Column Z)
C) Calculation of Market Opportunity:
Dollar Market Opportunity = Dollar Market Penetration Opportunity + Dollar Customer Value Mix Opportunity
v Step 1: Calculate the average percentage of retention across all the branches. (=AVERAGE(Column AV))
vi Step 1: Calculate the dollar amount of market penetration opportunity using the following formula:
Dollar Market Penetration Opportunity = % Market Penetration Opportunity (Column BC) * Total number of HH served (Column
Z) * Average profit per HH (Column AB)
Step 2: Sort the branches by the subsegment that each branch belongs to (Column AW).
Step 3: Calculate the average percentage of households in the top two tiers across the branches in the same subsegment.
Step 4: Calculate the benchmark for each branch by taking the maximum of the average percentage of households in the top two
tiers in the subsegment and the actual percentage of households in the top two tiers for each branch.
Step 8: Calculate the benchmark for each branch by taking the maximum of the average percentage of retention in the subsegment
and actual percentage of retention for each branch.
P
rofessors Kenneth A. Merchant, Wim A. Van der Stede, and research assistant Xiaoling (Clara) Chen prepared this case as a basis
f
or class discussion rather than to illustrate either effective or ineffective handling of an administrative situation.
Marshall School of Business
University of Southern California
Bank of the Desert
Appendix
Description of Contents of the Bank of the Desert Database
The Bank of the Desert databases provide detailed financial and operational information for
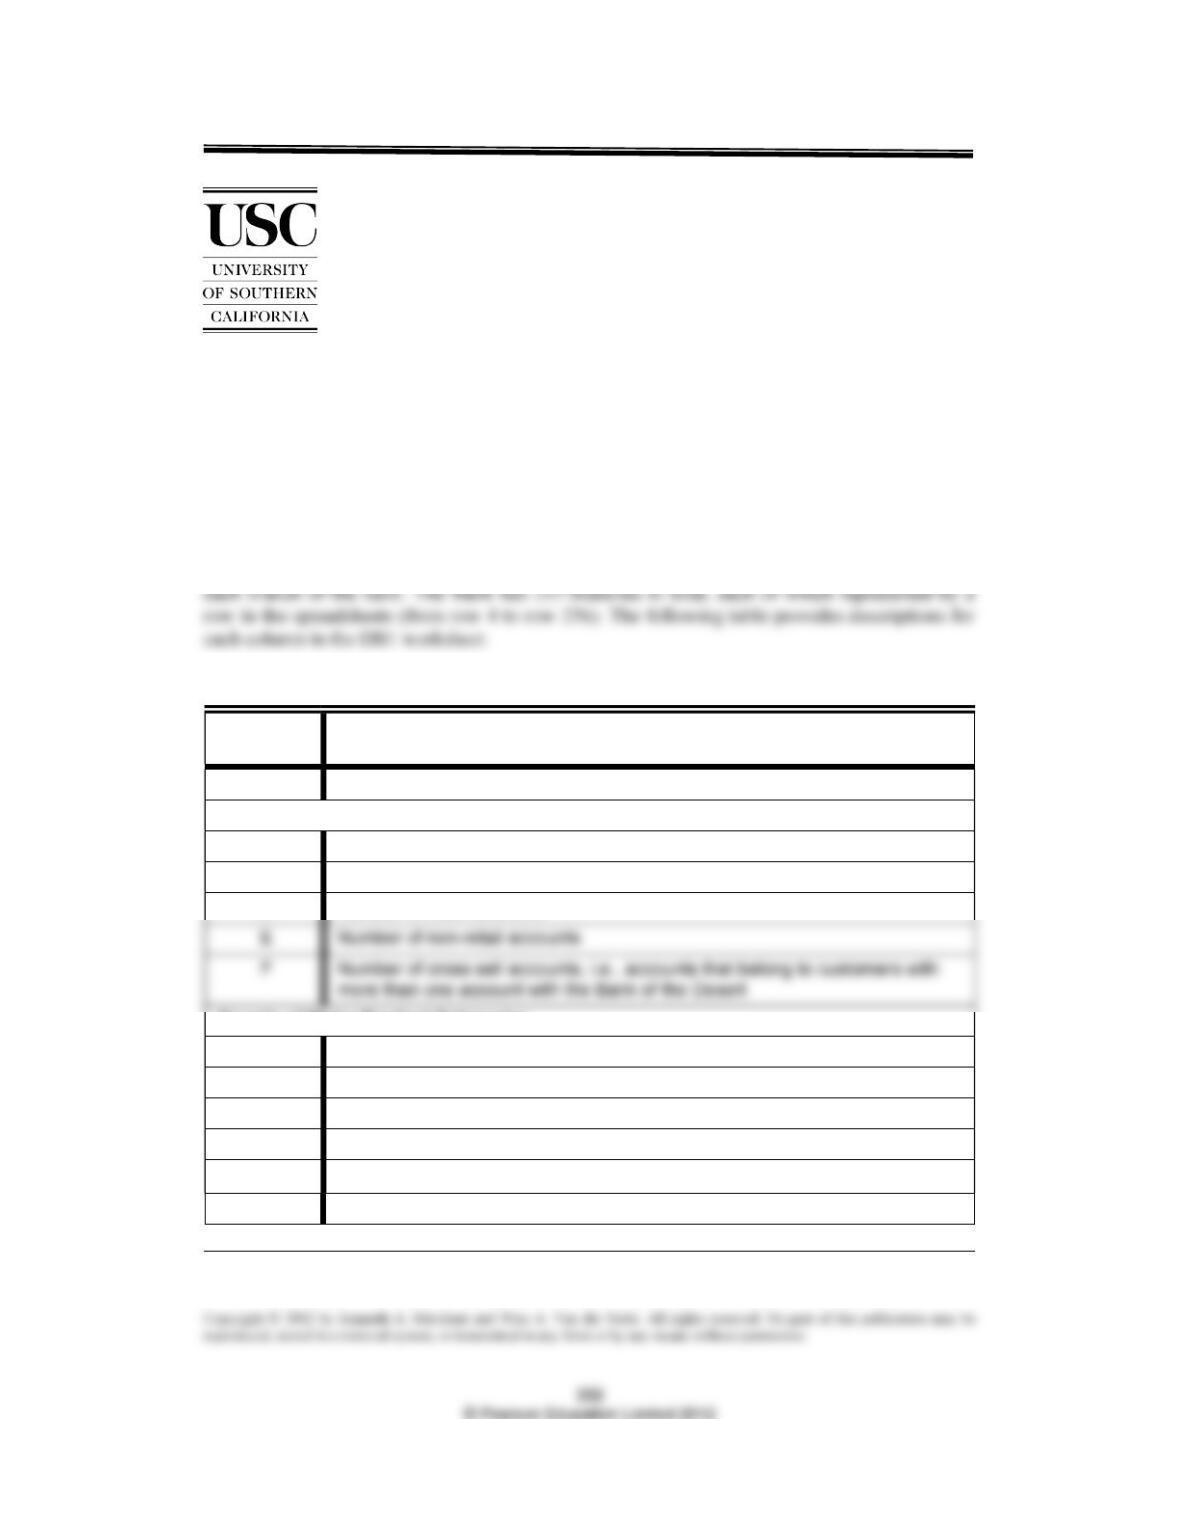
Table 1 Column Descriptions for DB1 Worksheet
Column
Reference
Column
Description
A Branch number
Accounts and Cross Sell
B Number of years the branch has been in operation
C Total deposit balances
D Number of retail accounts
Counts of Major Product Categories
G Number of ATM/Debit accounts
H Number of checking accounts
I Number of savings accounts
J Number of loan accounts
K Number of non-interest-bearing (NIB) accounts
L Number of other miscellaneous accounts
Merchant & Van der Stede, Management Control Systems, 3rd edition, Instructors Manual
359
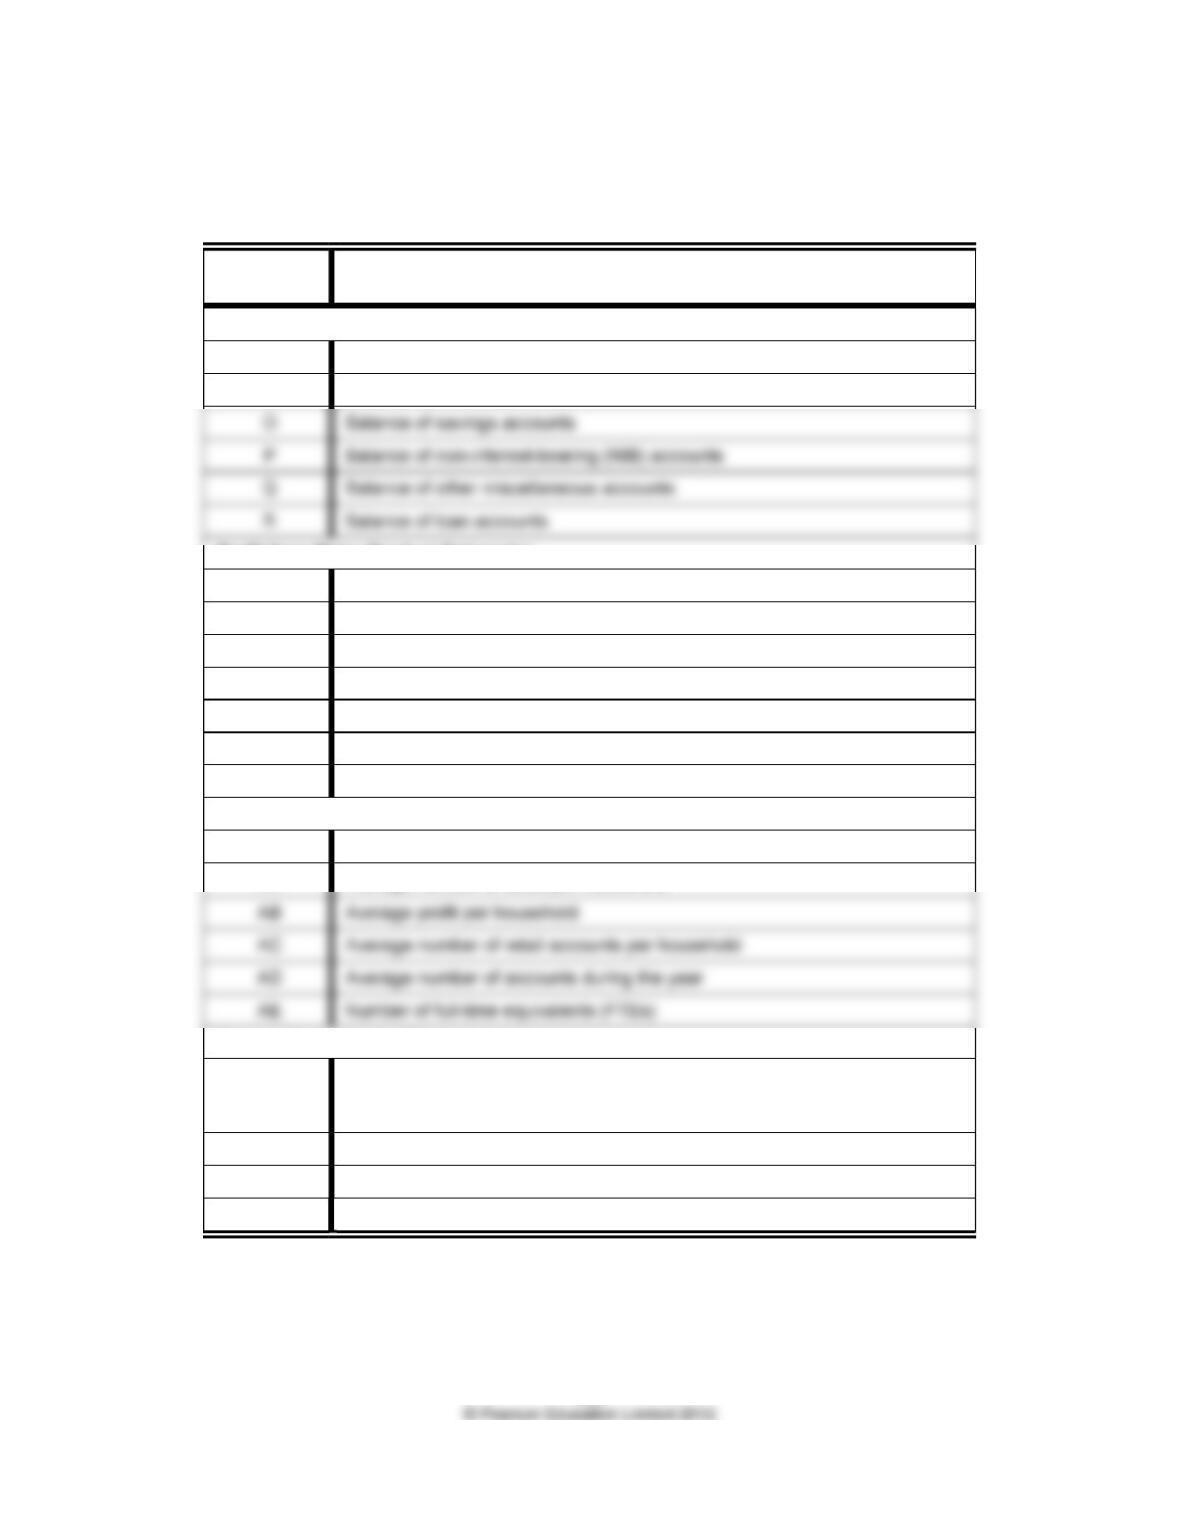
Table 1 (Cont.)
Column Descriptions for DB1 Worksheet
Column
Reference
Column
Description
Balances of Major Product Categories
M Balance of ATM/debit accounts
N Balance of checking accounts
Profit from Major Product Categories
S Profit from ATM/debit accounts
T Profit from checking accounts
U Profit from savings accounts
V Profit from non-interest-bearing (NIB) accounts
W Profit from other miscellaneous accounts
X Profit from loan accounts
Y Total profit from retail customers
Customer Information
Z Number of households that each branch currently serves
AA Average number of sales per household
Current Performance Measures
AF
Actual Cross Sell / Total Retail Accounts ratio, i.e., the number of cross sell
accounts (accounts owned by customers with more than one account with the
Bank) divided by the total number of retail accounts
AG Target Cross Sell/Total Retail Accounts ratio
AH Actual number of sales per full-time equivalents (FTE) per day
AI Target number of sales per full-time equivalents (FTE) per day
Merchant & Van der Stede, Management Control Systems, 3rd edition, Instructors Manual
360
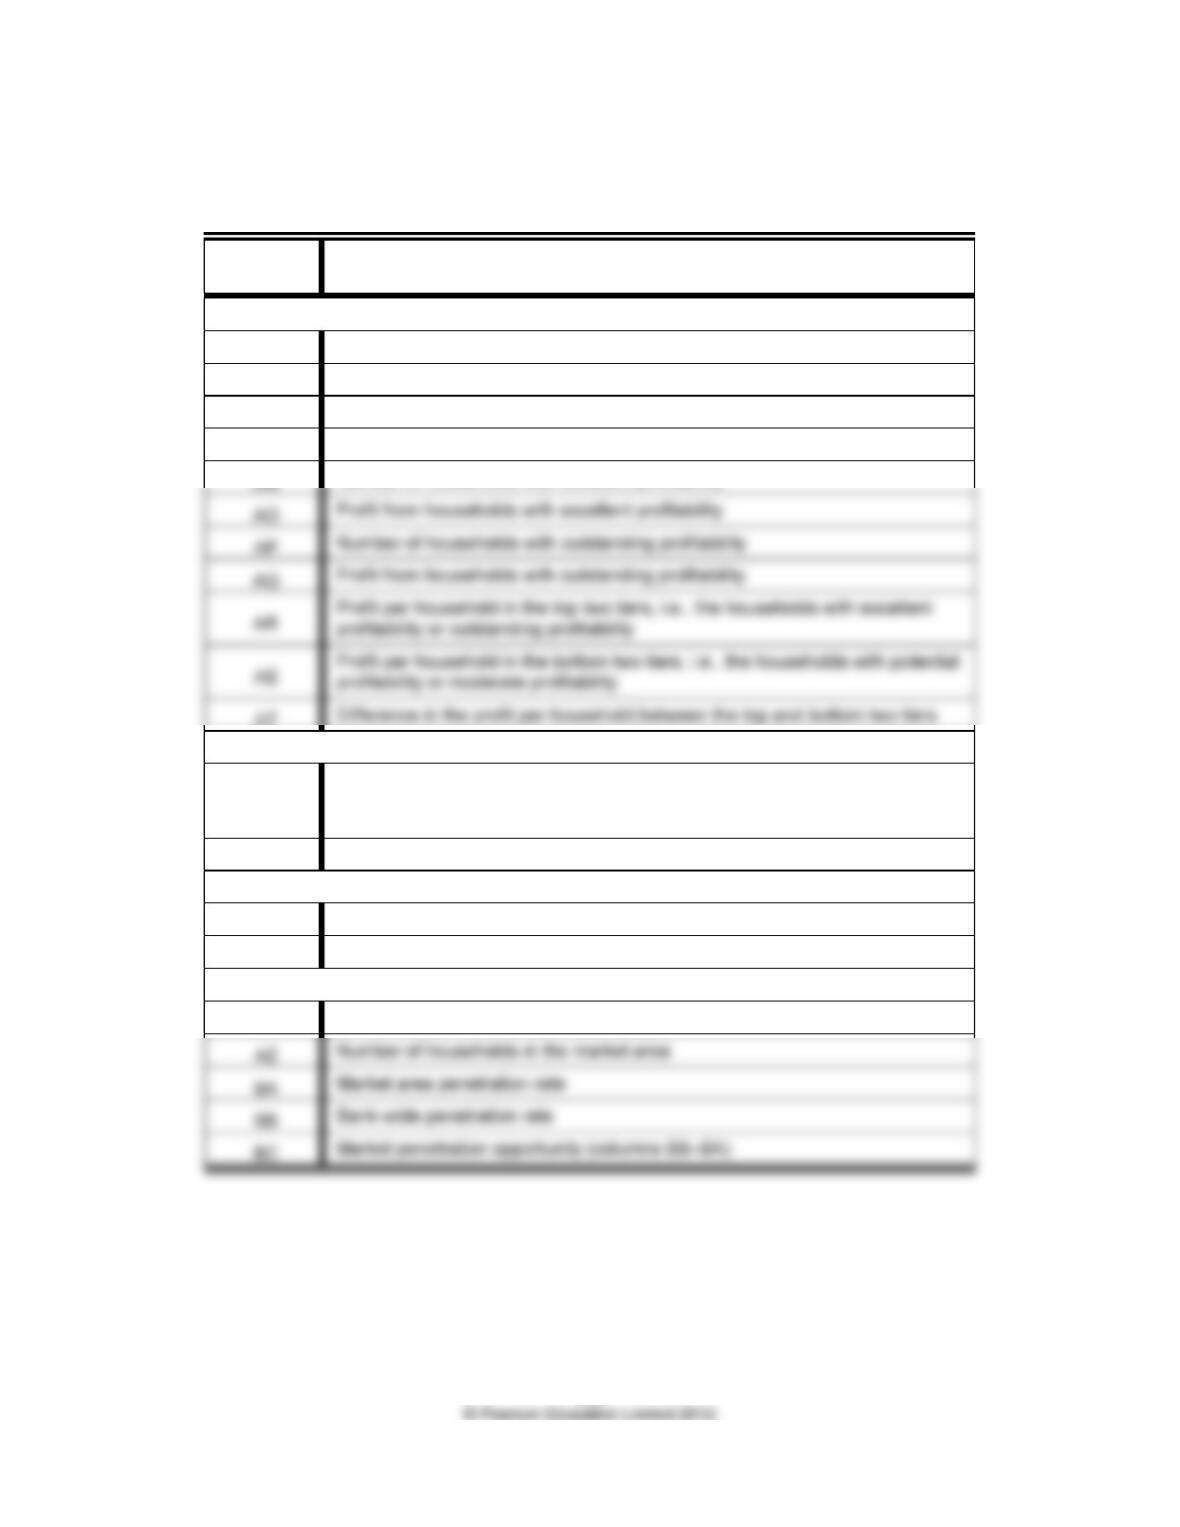
Table 2
Column Descriptions for Columns Added in DB2 Worksheet
Column
Reference
Column
Description
Customer Profitability Information
AJ Number of households with negative profitability
AK Profit from households with negative profitability
AL Number of households with moderate profitability
AM Profit from households with moderate profitability
AT Difference in the profit per household between the top and bottom two tiers
Opportunity Metrics Information
AU
Percentage of households in the top two tiers, i.e., the number of households
with excellent profitability and those with outstanding profitability divided by the
total number of households that each branch serves
AV Customer retention percentage
Cluster Information
AW Cluster code
AX Cluster name
Market Area Information
AY Market area number