S-88
1. Nucleotide Structure Which positions in the purine ring of a purine nucleotide in DNA have the
potential to form hydrogen bonds but are not involved in Watson-Crick base pairing?
2. Base Sequence of Complementary DNA Strands One strand of a double-helical DNA has the se-
quence (5⬘)GCGCAATATTTCTCAAAATATTGCGC(3⬘). Write the base sequence of the complementary
strand. What special type of sequence is contained in this DNA segment? Does the double-stranded
DNA have the potential to form any alternative structures?
3. DNA of the Human Body Calculate the weight in grams of a double-helical DNA molecule stretching
from the Earth to the moon (~320,000 km). The DNA double helix weighs about 1 ⫻10
⫺18
g per 1,000
nucleotide pairs; each base pair extends 3.4 Å. For an interesting comparison, your body contains
about 0.5 g of DNA!
Answer
Nucleotides and
Nucleic Acids
chapter 8
c08NucleotidesandNucleicAcids.qxd 12/6/12 4:57 PM Page S-88
4. DNA Bending Assume that a poly(A) tract five base pairs long produces a 20⬚bend in a DNA
strand. Calculate the total (net) bend produced in a DNA if the center base pairs (the third of five)
of two successive (dA)
5
tracts are located (a) 10 base pairs apart; (b) 15 base pairs apart. Assume
10 base pairs per turn in the DNA double helix.
5. Distinction between DNA Structure and RNA Structure Hairpins may form at palindromic
sequences in single strands of either RNA or DNA. How is the helical structure of a long and fully base-
paired (except at the end) hairpin in RNA different from that of a similar hairpin in DNA?
6. Nucleotide Chemistry The cells of many eukaryotic organisms have highly specialized systems that
specifically repair G–T mismatches in DNA. The mismatch is repaired to form a GqC (not AUT)
base pair. This G–T mismatch repair mechanism occurs in addition to a more general system that
repairs virtually all mismatches. Suggest why cells might require a specialized system to repair G–T
mismatches.
7. Denaturation of Nucleic Acids A duplex DNA oligonucleotide in which one of the strands has the
sequence TAATACGACTCACTATAGGG has a melting temperature (t
m
) of 59 °C. If an RNA duplex
oligonucleotide of identical sequence (substituting U for T) is constructed, will its melting tempera-
ture be higher or lower?
8. Spontaneous DNA Damage Hydrolysis of the N-glycosyl bond between deoxyribose and a purine
in DNA creates an AP site. An AP site generates a thermodynamic destabilization greater than that
created by any DNA mismatched base pair. This effect is not completely understood. Examine the
structure of an AP site (see Fig. 8–30b) and describe some chemical consequences of base loss.
9. Prediction of Nucleic Acid Structure from Its Sequence A part of a sequenced chromosome has
the sequence (on one strand) ATTGCATCCGCGCGTGCGCGCGCGATCCCGTTACTTTCCG. Which part
of this sequence is most likely to take up the Z conformation?
S-90 Chapter 8 Nucleotides and Nucleic Acids
10. Nucleic Acid Structure Explain why the absorption of UV light by double-stranded DNA increases
(the hyperchromic effect) when the DNA is denatured.
11. Determination of Protein Concentration in a Solution Containing Proteins and Nucleic
Acids The concentration of protein or nucleic acid in a solution containing both can be estimated by
using their different light absorption properties: proteins absorb most strongly at 280 nm and nucleic
acids at 260 nm. Estimates of their respective concentrations in a mixture can be made by measuring
the absorbance (A) of the solution at 280 nm and 260 nm and using the table that follows, which gives
R
280/260
, the ratio of absorbances at 280 and 260 nm; the percentage of total mass that is nucleic acid;
and a factor, F, that corrects the A
280
reading and gives a more accurate protein estimate. The protein
concentration (in mg/ml) ⫽F⫻A
280
(assuming the cuvette is 1 cm wide). Calculate the protein con-
centration in a solution of A
280
⫽0.69 and A
260
⫽0.94.
Proportion of
R
280/260
nucleic acid (%)
F
1.75 0.00 1.116
1.63 0.25 1.081
1.52 0.50 1.054
1.40 0.75 1.023
1.36 1.00 0.994
1.30 1.25 0.970
1.25 1.50 0.944
1.16 2.00 0.899
1.09 2.50 0.852
1.03 3.00 0.814
0.979 3.50 0.776
0.939 4.00 0.743
0.874 5.00 0.682
0.846 5.50 0.656
0.822 6.00 0.632
0.804 6.50 0.607
0.784 7.00 0.585
0.767 7.50 0.565
0.753 8.00 0.545
0.730 9.00 0.508
0.705 10.00 0.478
0.671 12.00 0.422
0.644 14.00 0.377
0.615 17.00 0.322
0.595 20.00 0.278
Chapter 8 Nucleotides and Nucleic Acids S-91
that protein.
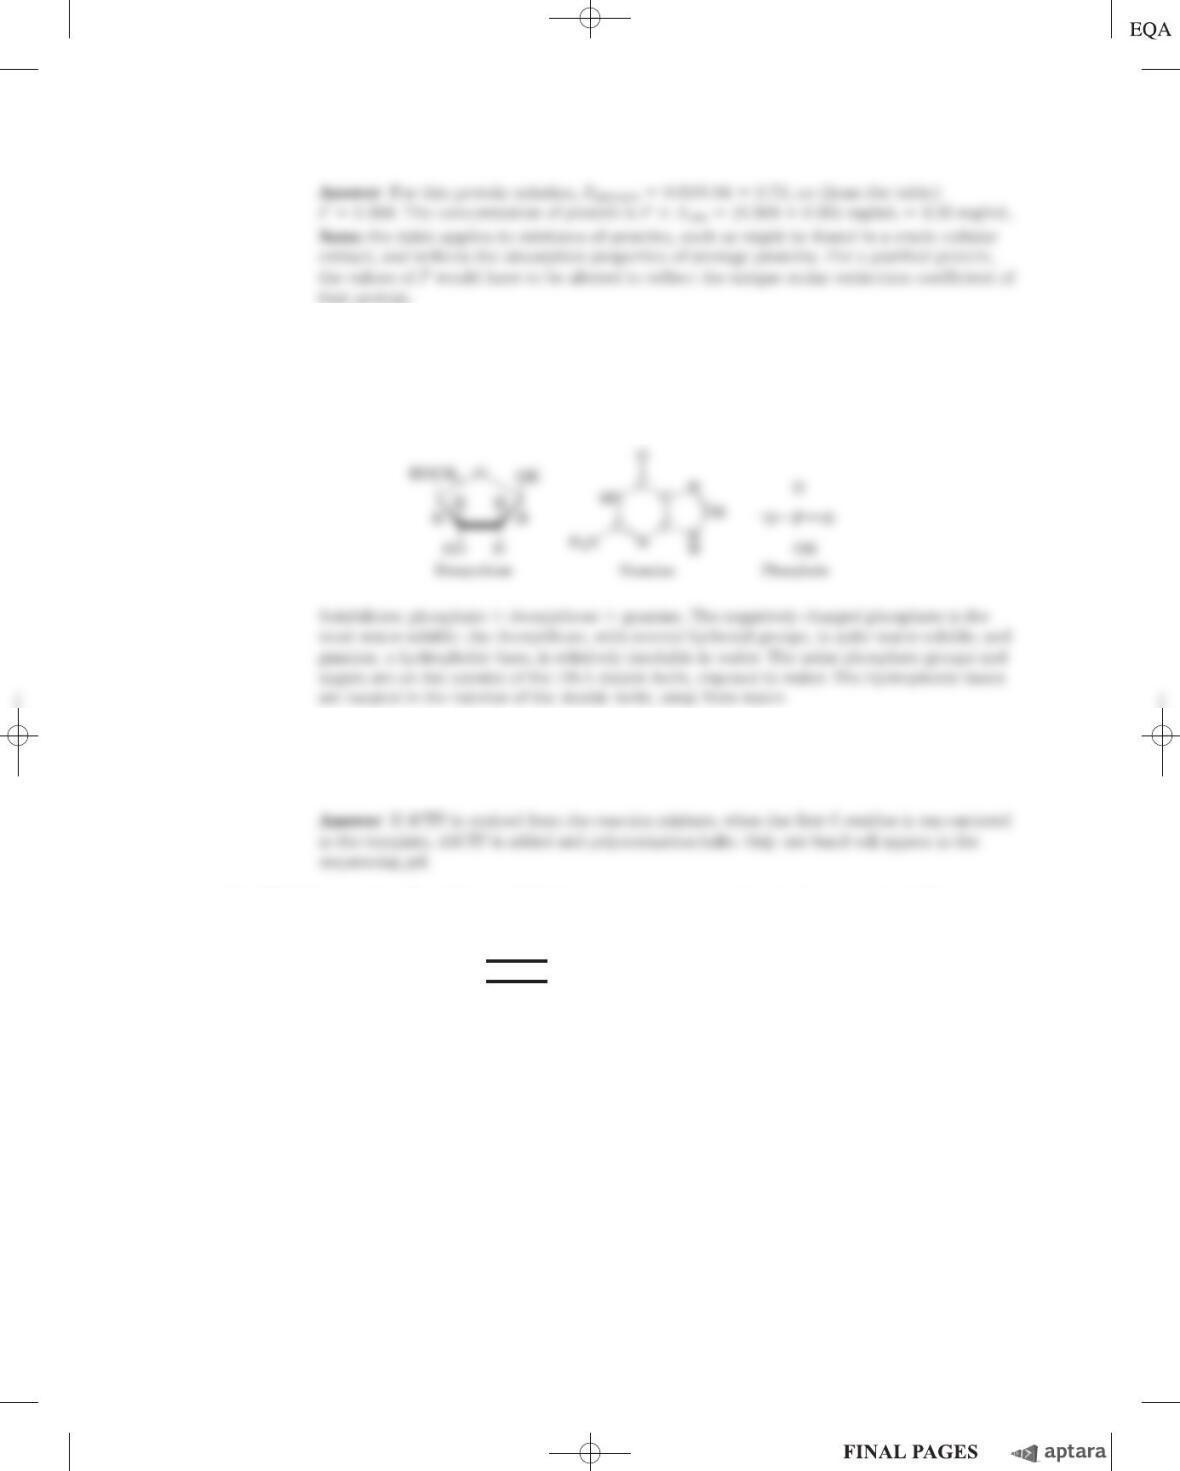
12. Solubility of the Components of DNA Draw the following structures and rate their relative
solubilities in water (most soluble to least soluble): deoxyribose, guanine, phosphate. How are these
solubilities consistent with the three-dimensional structure of double-stranded DNA?
Answer
*5⬘3⬘-OH
3⬘ATTACGCAAGGACATTAGAC—5⬘
13. Sanger Sequencing Logic In the Sanger (dideoxy) method for DNA sequencing, a small amount of a
dideoxynucleotide triphosphate—say, ddCTP—is added to the sequencing reaction along with a larger
amount of the corresponding dCTP. What result would be observed if the dCTP were omitted?
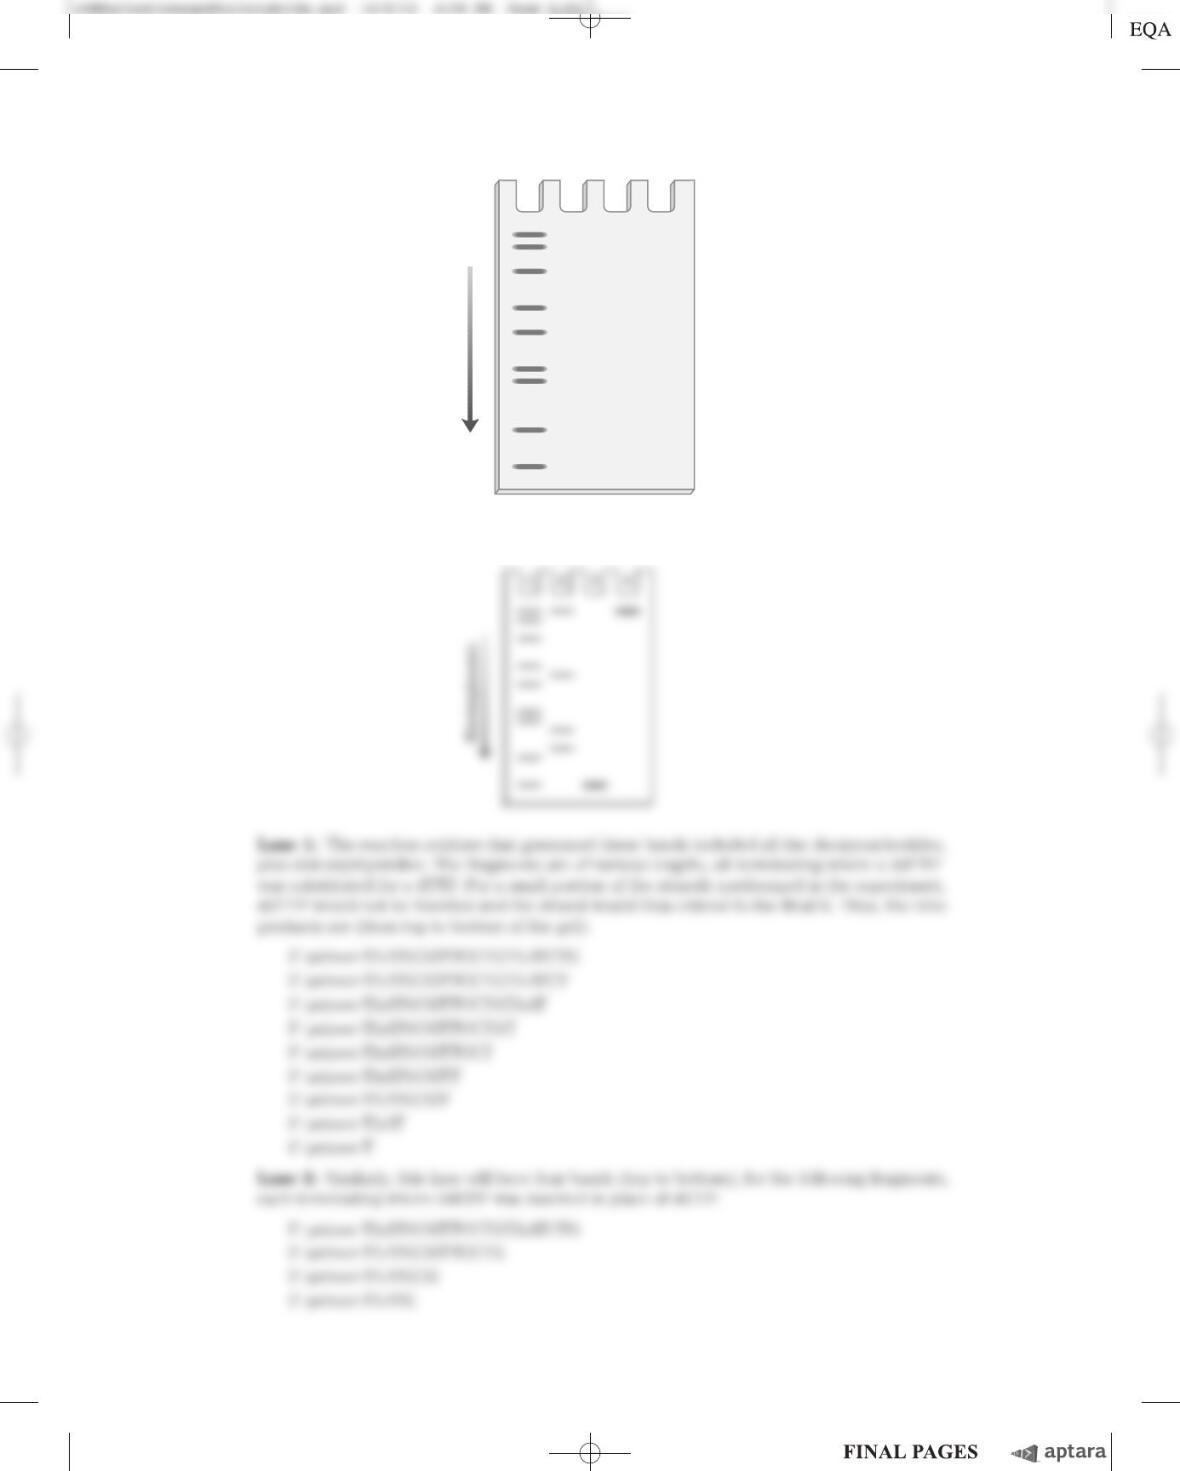
14. DNA Sequencing The following DNA fragment was sequenced by the Sanger method. The asterisk
indicates a fluorescent label.
A sample of the DNA was reacted with DNA polymerase and each of the nucleotide mixtures (in an
appropriate buffer) listed below. Dideoxynucleotides (ddNTPs) were added in relatively small
amounts.
1. dATP, dTTP, dCTP, dGTP, ddTTP
2. dATP, dTTP, dCTP, dGTP, ddGTP
3. dATP, dCTP, dGTP, ddTTP
4. dATP, dTTP, dCTP, dGTP
The resulting DNA was separated by electrophoresis on an agarose gel, and the fluorescent bands on
the gel were located. The band pattern resulting from nucleotide mixture 1 is shown on the next page.
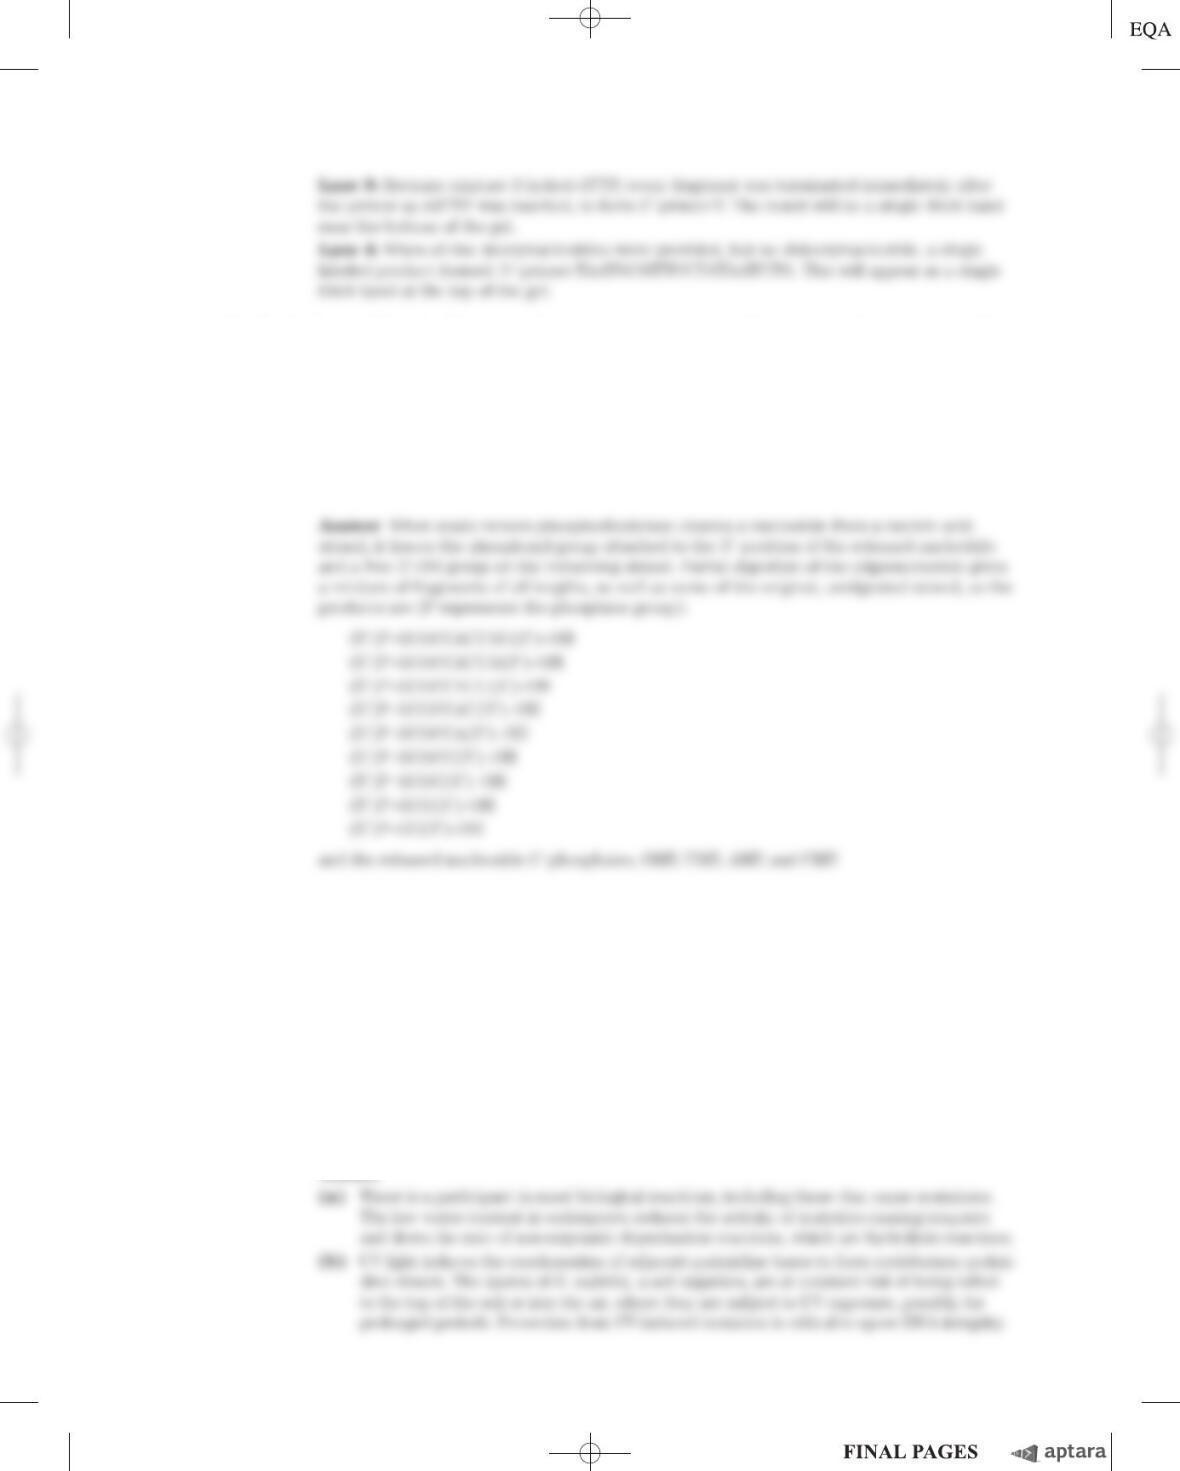
Assuming that all mixtures were run on the same gel, what did the remaining lanes of the gel look like?
c08NucleotidesandNucleicAcids.qxd 12/6/12 4:58 PM Page S-91
S-92 Chapter 8 Nucleotides and Nucleic Acids
Answer
Electrophoresis
1234
Chapter 8 Nucleotides and Nucleic Acids S-93
15. Snake Venom Phosphodiesterase An exonuclease is an enzyme that sequentially cleaves nucleotides
from the end of a polynucleotide strand. Snake venom phosphodiesterase, which hydrolyzes nucleotides
from the 3⬘end of any oligonucleotide with a free 3⬘-hydroxyl group, cleaves between the 3⬘hydroxyl of
the ribose or deoxyribose and the phosphoryl group of the next nucleotide. It acts on single-stranded
DNA or RNA and has no base specificity. This enzyme was used in sequence determination experiments
before the development of modern nucleic acid sequencing techniques. What are the products of partial
digestion by snake venom phosphodiesterase of an oligonucleotide with the following sequence?
(5⬘)GCGCCAUUGC(3⬘)–OH
16. Preserving DNA in Bacterial Endospores Bacterial endospores form when the environment is no
longer conducive to active cell metabolism. The soil bacterium Bacillus subtilis, for example, begins
the process of sporulation when one or more nutrients are depleted. The end product is a small, meta-
bolically dormant structure that can survive almost indefinitely with no detectable metabolism. Spores
have mechanisms to prevent accumulation of potentially lethal mutations in their DNA over periods of
dormancy that can exceed 1,000 years. B. subtilis spores are much more resistant than are the
organism’s growing cells to heat, UV radiation, and oxidizing agents, all of which promote mutations.
(a) One factor that prevents potential DNA damage in spores is their greatly decreased water con-
tent. How would this affect some types of mutations?
(b) Endospores have a category of proteins called small acid-soluble proteins (SASPs) that bind to
their DNA, preventing formation of cyclobutane-type dimers. What causes cyclobutane dimers,
and why do bacterial endospores need mechanisms to prevent their formation?
Answer
c08NucleotidesandNucleicAcids.qxd 12/6/12 4:58 PM Page S-93
S-94 Chapter 8 Nucleotides and Nucleic Acids
17. Oligonucleotide Synthesis In the scheme of Figure 8–35, each new base to be added to the
growing oligonucleotide is modified so that its 3⬘hydroxyl is activated and the 5⬘hydroxyl has a
dimethoxytrityl (DMT) group attached. What is the function of the DMT group on the incoming base?
Using the Web
18. The Structure of DNA Elucidation of the three-dimensional structure of DNA helped researchers
understand how this molecule conveys information that can be faithfully replicated from one genera-
tion to the next. To see the secondary structure of double-stranded DNA, go to the Protein Data Bank
website (www.pdb.org). Use the PDB identifiers listed below to retrieve the structure summaries for
the two forms of DNA. Open the structures using Jmol, and use the controls in the Jmol menu
(accessed with a control-click or by clicking on the Jmol logo in the lower right corner of the image
screen) to complete the following exercises. Refer to the Jmol help links as needed.
(a) Obtain the file for 141D, a highly conserved, repeated DNA sequence from the end of the HIV-1
(the virus that causes AIDS) genome. Display the molecule as a ball-and-stick structure and
color by element. Identify the sugar–phosphate backbone for each strand of the DNA duplex.
Locate and identify individual bases. Identify the 5⬘end of each strand. Locate the major and mi-
nor grooves. Is this a right- or left-handed helix?
(b) Obtain the file for 145D, a DNA with the Z conformation. Display the molecule as a ball-and-stick
structure and color by element. Identify the sugar–phosphate backbone for each strand of the
DNA duplex. Is this a right- or left-handed helix?
(c) To fully appreciate the secondary structure of DNA, view the molecules in stereo. On the
control menu, Select ⬎All, then Style ⬎Stereographic ⬎Cross-eyed viewing or Wall-eyed
viewing. You will see two images of the DNA molecule. Sit with your nose approximately
10 inches from the monitor and focus on the tip of your nose (cross-eyed) or the opposite
edges of the screen (wall-eyed). In the background you should see three images of the DNA
helix. Shift your focus to the middle image, which should appear three-dimensional. (Note
that only one of the two authors can make this work.)
Chapter 8 Nucleotides and Nucleic Acids S-95
Data Analysis Problem
19. Chargaff’s Studies of DNA Structure The chapter section “DNA Is a Double Helix That Stores
Genetic Information” includes a summary of the main findings of Erwin Chargaff and his coworkers,
listed as four conclusions (“Chargaff’s rules”; p. 278). In this problem, you will examine the data Char-
gaff collected in support of these conclusions.
In one paper, Chargaff (1950) described his analytical methods and some early results. Briefly, he
treated DNA samples with acid to remove the bases, separated the bases by paper chromatography, and
measured the amount of each base with UV spectroscopy. His results are shown in the three tables be-
low. The molar ratio is the ratio of the number of moles of each base in the sample to the number of
moles of phosphate in the sample—this gives the fraction of the total number of bases represented by
each particular base. The recovery is the sum of all four bases (the sum of the molar ratios); full recov-
ery of all bases in the DNA would give a recovery of 1.0.
Molar ratios in ox DNA
Thymus Spleen Liver
Base Prep. 1 Prep. 2 Prep. 3 Prep. 1 Prep. 2 Prep. 1
Adenine 0.26 0.28 0.30 0.25 0.26 0.26
Guanine 0.21 0.24 0.22 0.20 0.21 0.20
Cytosine 0.16 0.18 0.17 0.15 0.17
Thymine 0.25 0.24 0.25 0.24 0.24
Recovery 0.88 0.94 0.94 0.84 0.88
Molar ratios in human DNA
Sperm Thymus Liver
Base Prep. 1 Prep. 2 Prep. 1 Normal Carcinoma
Adenine 0.29 0.27 0.28 0.27 0.27
Guanine 0.18 0.17 0.19 0.19 0.18
Cytosine 0.18 0.18 0.16 0.15
Thymine 0.31 0.30 0.28 0.27
Recovery 0.96 0.92 0.91 0.87
Molar ratios in DNA of microorganisms
Yeast Avian tubercle bacilli
Base Prep. 1 Prep. 2 Prep. 1
Adenine 0.24 0.30 0.12
Guanine 0.14 0.18 0.28
Cytosine 0.13 0.15 0.26
Thymine 0.25 0.29 0.11
Recovery 0.76 0.92 0.77
c08NucleotidesandNucleicAcids.qxd 12/6/12 4:58 PM Page S-95
S-96 Chapter 8 Nucleotides and Nucleic Acids
(a) Based on these data, Chargaff concluded that “no differences in composition have so far been
found in DNA from different tissues of the same species.” This corresponds to conclusion 2 in
this chapter. However, a skeptic looking at the data above might say, “They certainly look differ-
ent to me!” If you were Chargaff, how would you use the data to convince the skeptic to change
her mind?
(b) The base composition of DNA from normal and cancerous liver cells (hepatocarcinoma) was not
distinguishably different. Would you expect Chargaff’s technique to be capable of detecting a dif-
ference between the DNA of normal and cancerous cells? Explain your reasoning.
As you might expect, Chargaff’s data were not completely convincing. He went on to improve his
techniques, as described in his 1951 paper, in which he reported molar ratios of bases in DNA from a
variety of organisms:
Source A:G T:C A:T G:C Purine:pyrimidine
Ox 1.29 1.43 1.04 1.00 1.1
Human 1.56 1.75 1.00 1.00 1.0
Hen 1.45 1.29 1.06 0.91 0.99
Salmon 1.43 1.43 1.02 1.02 1.02
Wheat 1.22 1.18 1.00 0.97 0.99
Yeast 1.67 1.92 1.03 1.20 1.0
Haemophilus
influenzae
type c 1.74 1.54 1.07 0.91 1.0
E. coli
K-12 1.05 0.95 1.09 0.99 1.0
Avian tubercle
bacillus 0.4 0.4 1.09 1.08 1.1
Serratia
marcescens
0.7 0.7 0.95 0.86 0.9
Bacillus schatz
0.7 0.6 1.12 0.89 1.0
(c) According to Chargaff, as stated in conclusion 1 in this chapter, “The base composition of DNA
generally varies from one species to another.” Provide an argument, based on the data presented
so far, that supports this conclusion.
(d) According to conclusion 4, “In all cellular DNAs, regardless of the species . . . A ⫹G ⫽T ⫹C.”
Provide an argument, based on the data presented so far, that supports this conclusion.
Part of Chargaff’s intent was to disprove the “tetranucleotide hypothesis”; this was the idea that DNA
was a monotonous tetranucleotide polymer (AGCT)
n
and therefore not capable of containing sequence in-
formation. Although the data presented above show that DNA cannot be simply a tetranucleotide—if so, all
samples would have molar ratios of 0.25 for each base—it was still possible that the DNA from different or-
ganisms was a slightly more complex, but still monotonous, repeating sequence.
To address this issue, Chargaff took DNA from wheat germ and treated it with the enzyme de-
oxyribonuclease for different time intervals. At each time interval, some of the DNA was converted to
small fragments; the remaining, larger fragments he called the “core.” In the table below, the “19%
core” corresponds to the larger fragments left behind when 81% of the DNA was degraded; the “8%
core” corresponds to the larger fragments left after 92% degradation.
Base Intact DNA 19% Core 8% Core
Adenine 0.27 0.33 0.35
Guanine 0.22 0.20 0.20
Cytosine 0.22 0.16 0.14
Thymine 0.27 0.26 0.23
Recovery 0.98 0.95 0.92
Chapter 8 Nucleotides and Nucleic Acids S-97
(e) How would you use these data to argue that wheat germ DNA is not a monotonous repeating
sequence?
Answer
c08NucleotidesandNucleicAcids.qxd 12/6/12 4:58 PM Page S-97