The Foundations
of Biochemistry
chapter 1
S-1
1. The Size of Cells and Their Components
(a) If you were to magnify a cell 10,000-fold (typical of the magnification achieved using an electron
microscope), how big would it appear? Assume you are viewing a “typical” eukaryotic cell with a
cellular diameter of 50 mm.
(b) If this cell were a muscle cell (myocyte), how many molecules of actin could it hold? Assume
the cell is spherical and no other cellular components are present; actin molecules are spherical,
with a diameter of 3.6 nm. (The volume of a sphere is 4/3 pr
3
.)
(c) If this were a liver cell (hepatocyte) of the same dimensions, how many mitochondria could it
hold? Assume the cell is spherical; no other cellular components are present; and the
mitochondria are spherical, with a diameter of 1.5 mm.
(d) Glucose is the major energy-yielding nutrient for most cells. Assuming a cellular concentration of
1 m
M
(i.e., 1 millimole/L), calculate how many molecules of glucose would be present in our
hypothetical (and spherical) eukaryotic cell. (Avogadro’s number, the number of molecules in 1
mol of a nonionized substance, is 6.02 10
23
.)
(e) Hexokinase is an important enzyme in the metabolism of glucose. If the concentration of hexokinase
in our eukaryotic cell is 20 m
M
, how many glucose molecules are present per hexokinase molecule?
Answer
(b) The radius of a globular actin molecule is 3.6 nm/2 1.8 nm; the volume of the
c01TheFoundationsofBiochemistry.qxd 12/6/12 4:09 PM Page S-1
S-2 Chapter 1 The Foundations of Biochemistry
2. Components of E. coli E. coli cells are rod-shaped, about 2 mm long and 0.8 mm in diameter. The
volume of a cylinder is pr
2
h, where his the height of the cylinder.
(a) If the average density of E. coli (mostly water) is 1.1 10
3
g/L, what is the mass of a single cell?
(b) E. coli has a protective cell envelope 10 nm thick. What percentage of the total volume of the
bacterium does the cell envelope occupy?
(c) E. coli is capable of growing and multiplying rapidly because it contains some 15,000 spherical
ribosomes (diameter 18 nm), which carry out protein synthesis. What percentage of the cell
volume do the ribosomes occupy?
Answer
c01TheFoundationsofBiochemistry.qxd 12/6/12 4:09 PM Page S-2
3. Genetic Information in E. Coli DNA The genetic information contained in DNA consists of a
linear sequence of coding units, known as codons. Each codon is a specific sequence of three deoxyri-
bonucleotides (three deoxyribonucleotide pairs in double-stranded DNA), and each codon codes for a
single amino acid unit in a protein. The molecular weight of an E. coli DNA molecule is about
3.1 10
9
g/mol. The average molecular weight of a nucleotide pair is 660 g/mol, and each nucleotide
pair contributes 0.34 nm to the length of DNA.
(a) Calculate the length of an E. coli DNA molecule. Compare the length of the DNA molecule with
the cell dimensions (see Problem 2). How does the DNA molecule fit into the cell?
(b) Assume that the average protein in E. coli consists of a chain of 400 amino acids. What is the
maximum number of proteins that can be coded by an E. coli DNA molecule?
Answer
4. The High Rate of Bacterial Metabolism Bacterial cells have a much higher rate of metabolism
than animal cells. Under ideal conditions some bacteria double in size and divide every 20 min,
whereas most animal cells under rapid growth conditions require 24 hours. The high rate of bacterial
metabolism requires a high ratio of surface area to cell volume.
(a) Why does surface-to-volume ratio affect the maximum rate of metabolism?
(b) Calculate the surface-to-volume ratio for the spherical bacterium Neisseria gonorrhoeae (diameter
0.5 mm), responsible for the disease gonorrhea. Compare it with the surface-to-volume ratio for a
globular amoeba, a large eukaryotic cell (diameter 150 mm). The surface area of a sphere is 4pr
2
.
Answer
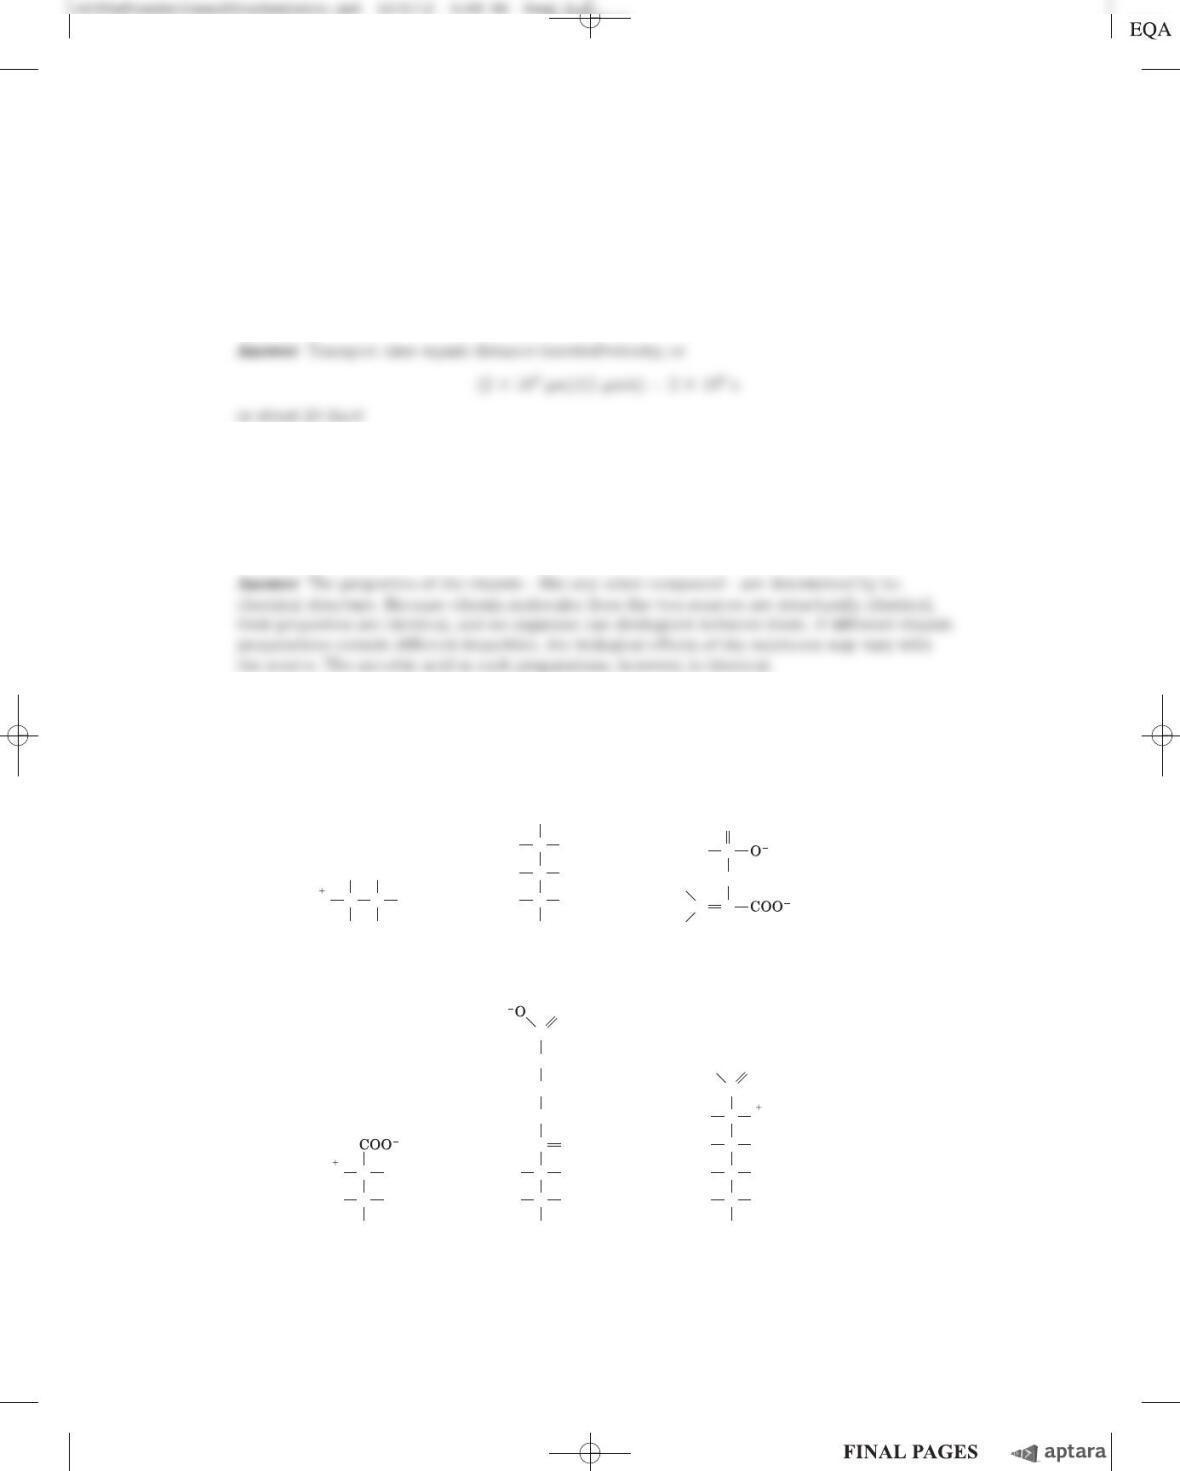
5. Fast Axonal Transport Neurons have long thin processes called axons, structures specialized for
conducting signals throughout the organism’s nervous system. Some axonal processes can be as long
as 2 m—for example, the axons that originate in your spinal cord and terminate in the muscles of your
toes. Small membrane-enclosed vesicles carrying materials essential to axonal function move along mi-
crotubules of the cytoskeleton, from the cell body to the tips of the axons. If the average velocity of a
vesicle is 1 mm/s, how long does it take a vesicle to move from a cell body in the spinal cord to the
axonal tip in the toes?
6. Is Synthetic Vitamin C as Good as the Natural Vitamin? A claim put forth by some purveyors of
health foods is that vitamins obtained from natural sources are more healthful than those obtained by
chemical synthesis. For example, pure
L
-ascorbic acid (vitamin C) extracted from rose hips is better
than pure
L
-ascorbic acid manufactured in a chemical plant. Are the vitamins from the two sources dif-
ferent? Can the body distinguish a vitamin’s source?
7. Identification of Functional Groups Figures 1–16 and 1–17 show some common functional groups
of biomolecules. Because the properties and biological activities of biomolecules are largely deter-
mined by their functional groups, it is important to be able to identify them. In each of the compounds
below, circle and identify by name each functional group.
S-4 Chapter 1 The Foundations of Biochemistry
H
H
Ethanolamine
(a)
C
H
H
COHH3N
Glycerol
(b)
H
H
COH
HCOH
HCOH
H
Threonine, an
amino acid
(d)
H
CH3
COH
CH
Pantothenate,
a vitamin
(e)
H3C
CH2OH
CCH
3
HCOH
CO
NH
Phosphoenolpyruvate,
an intermediate in
glucose metabolism
(c)
CC
O
HO P
O
H
H
CH2
CH2
C
O
D-Glucosamine
(f )
H
CH2OH
COH
HCOH
HO CH
HCNH
3
C
O
H
H3N
Answer
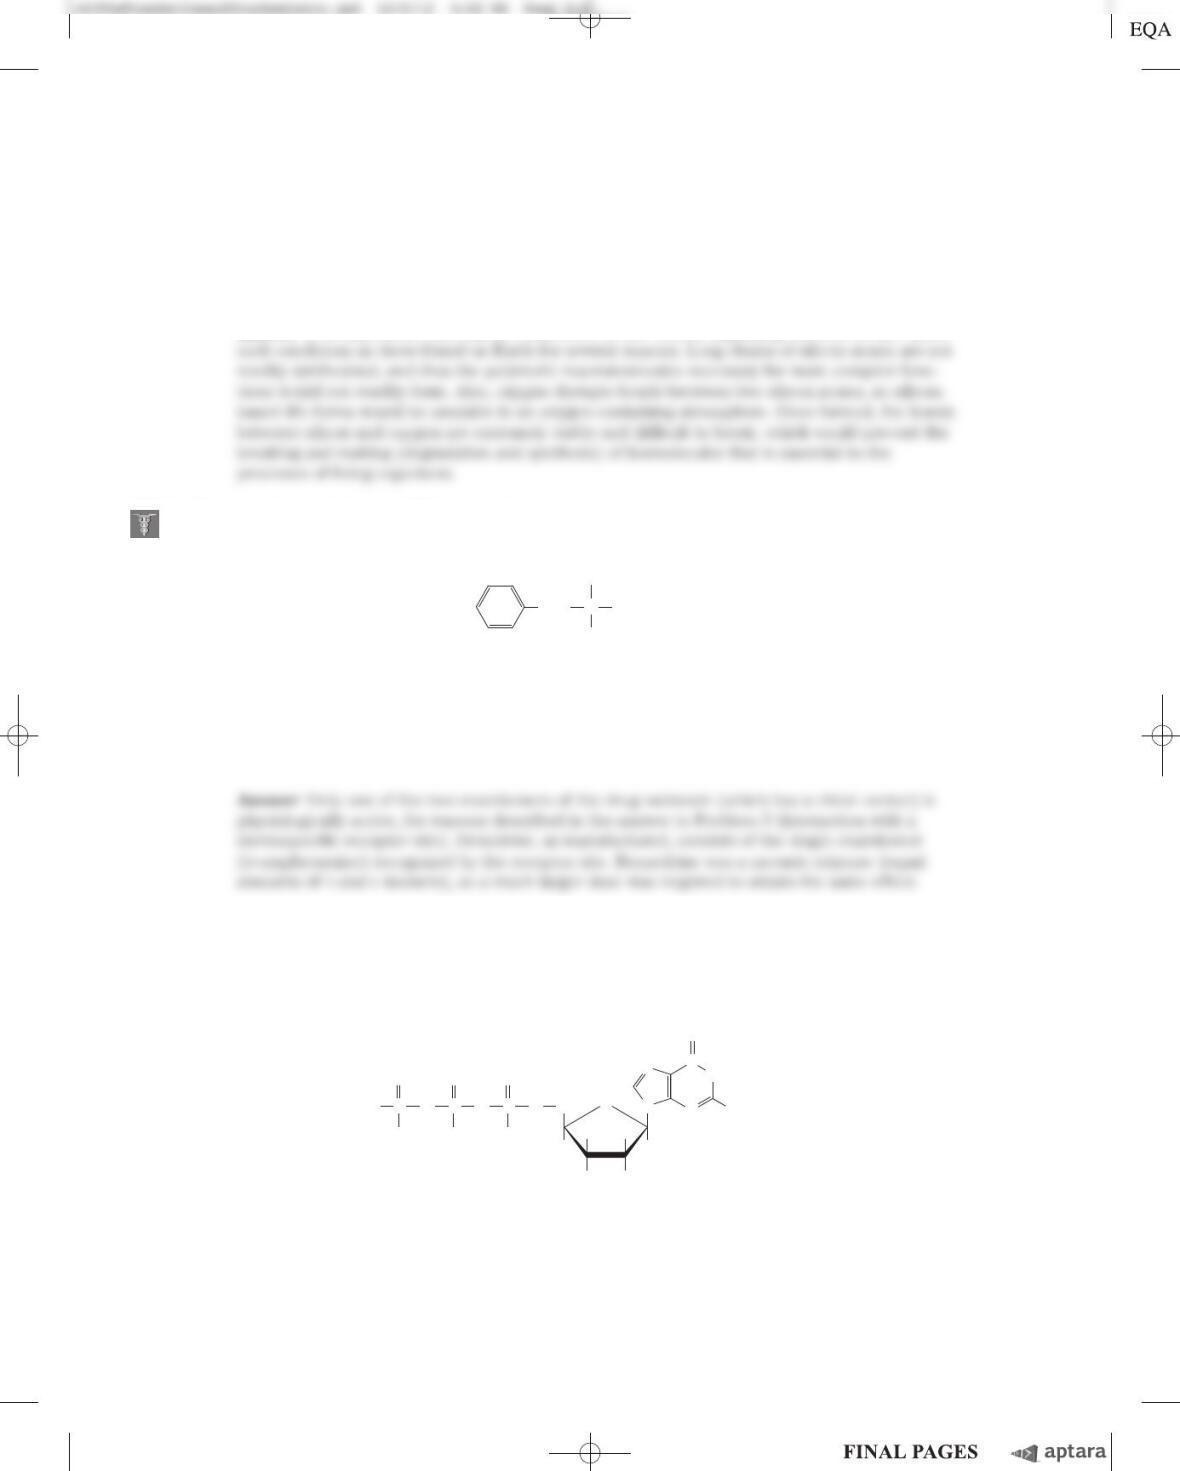
8. Drug Activity and Stereochemistry The quantitative differences in biological activity between the
two enantiomers of a compound are sometimes quite large. For example, the
D
isomer of the drug iso-
proterenol, used to treat mild asthma, is 50 to 80 times more effective as a bronchodilator than the
L
isomer. Identify the chiral center in isoproterenol. Why do the two enantiomers have such radically
different bioactivity?
9. Separating Biomolecules In studying a particular biomolecule (a protein, nucleic acid, carbohy-
drate, or lipid) in the laboratory, the biochemist first needs to separate it from other biomolecules in
the sample—that is, to purify it. Specific purification techniques are described later in the text. How-
ever, by looking at the monomeric subunits of a biomolecule, you should have some ideas about the
characteristics of the molecule that would allow you to separate it from other molecules. For example,
how would you separate (a) amino acids from fatty acids and (b) nucleotides from glucose?
Answer
(a) Amino acids and fatty acids have carboxyl groups, whereas only the amino acids have amino
(b) A nucleotide molecule has three components: a nitrogenous organic base, a five-carbon
Chapter 1 The Foundations of Biochemistry S-5
OH
H
Isoproterenol
C
HO
CH2
H
N
CH3
C CH3
H
HO
c01TheFoundationsofBiochemistry.qxd 12/6/12 4:10 PM Page S-5
10. Silicon-Based Life? Silicon is in the same group of the periodic table as carbon and, like carbon, can
form up to four single bonds. Many science fiction stories have been based on the premise of silicon-
based life. Is this realistic? What characteristics of silicon make it less well adapted than carbon as the
central organizing element for life? To answer this question, consider what you have learned about car-
bon’s bonding versatility, and refer to a beginning inorganic chemistry textbook for silicon’s bonding
properties.
Answer It is improbable that silicon could serve as the central organizing element for life under
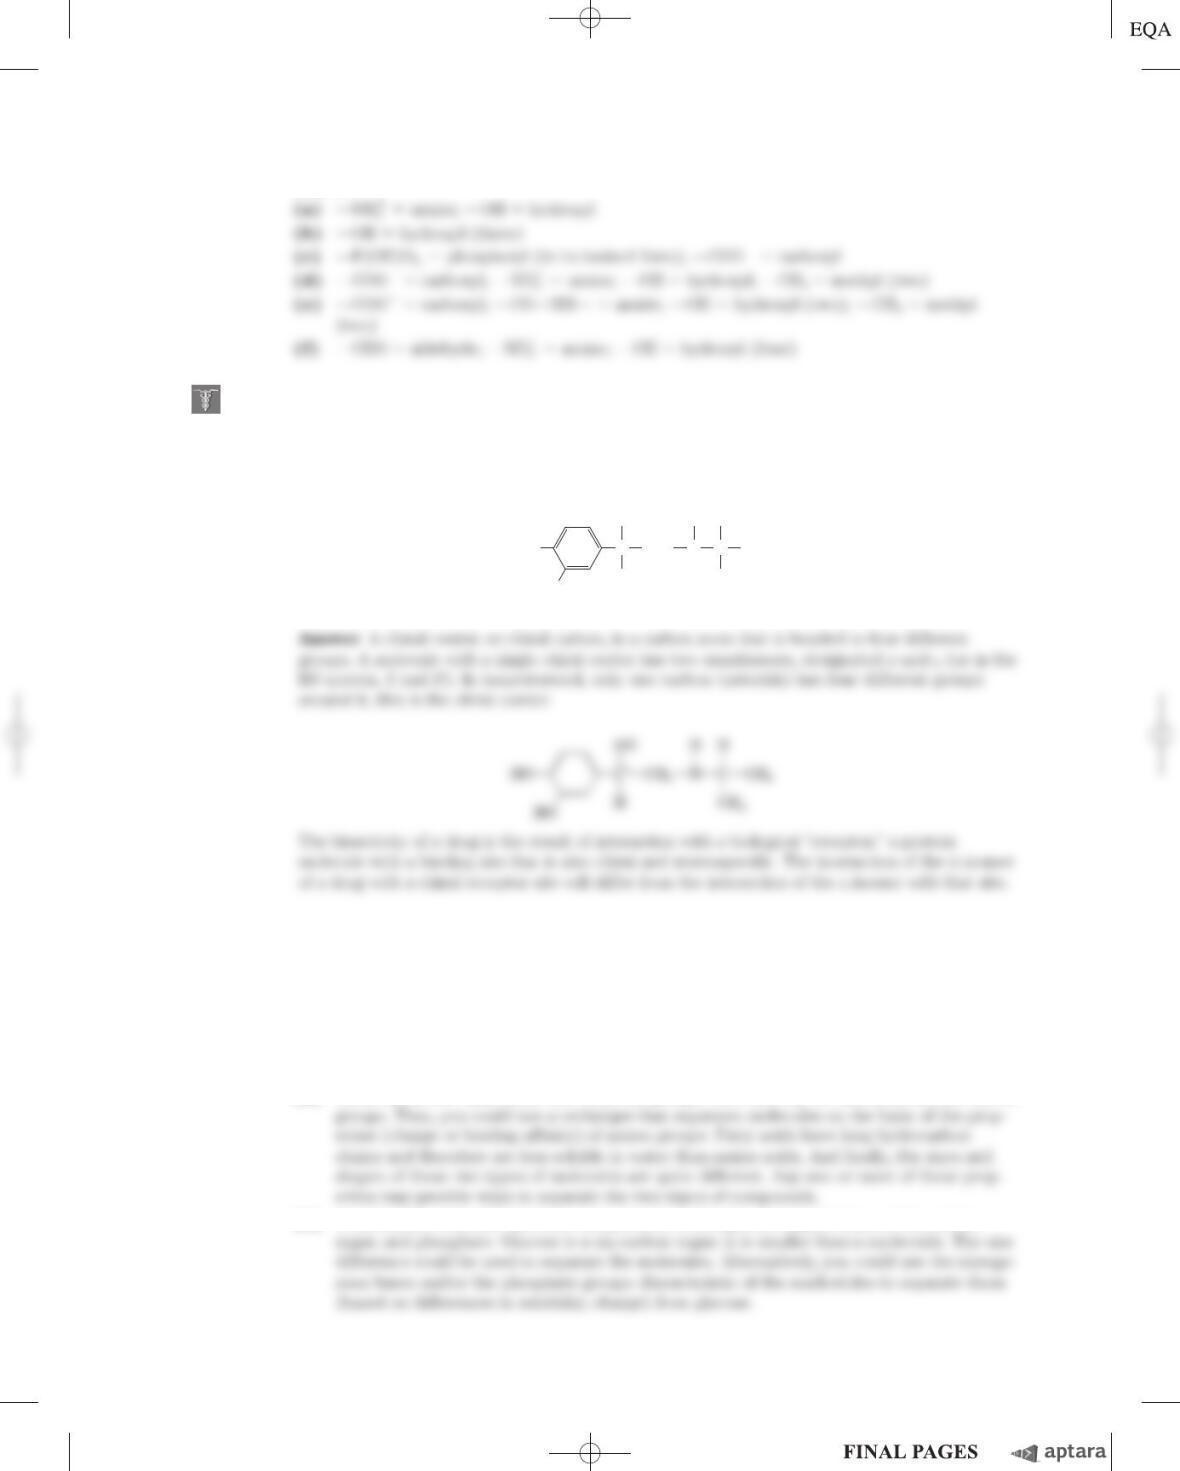
11. Drug Action and Shape of Molecules Some years ago two drug companies marketed a drug under
the trade names Dexedrine and Benzedrine. The structure of the drug is shown below.
The physical properties (C, H, and N analysis, melting point, solubility, etc.) of Dexedrine and
Benzedrine were identical. The recommended oral dosage of Dexedrine (which is still available)
was 5 mg/day, but the recommended dosage of Benzedrine (no longer available) was twice that.
Apparently, it required considerably more Benzedrine than Dexedrine to yield the same physiologi-
cal response. Explain this apparent contradiction.
12. Components of Complex Biomolecules Figure 1–10 shows the major components of complex bio-
molecules. For each of the three important biomolecules below (shown in their ionized forms at physi-
ological pH), identify the constituents.
(a) Guanosine triphosphate (GTP), an energy-rich nucleotide that serves as a precursor to RNA:
S-6 Chapter 1 The Foundations of Biochemistry
CCH2CH3
NH2
H
N
C
O
O
O
OP OP ON
NNH
NH2
OP CH2
O
O
O
O
HH
HH
OH OH
O
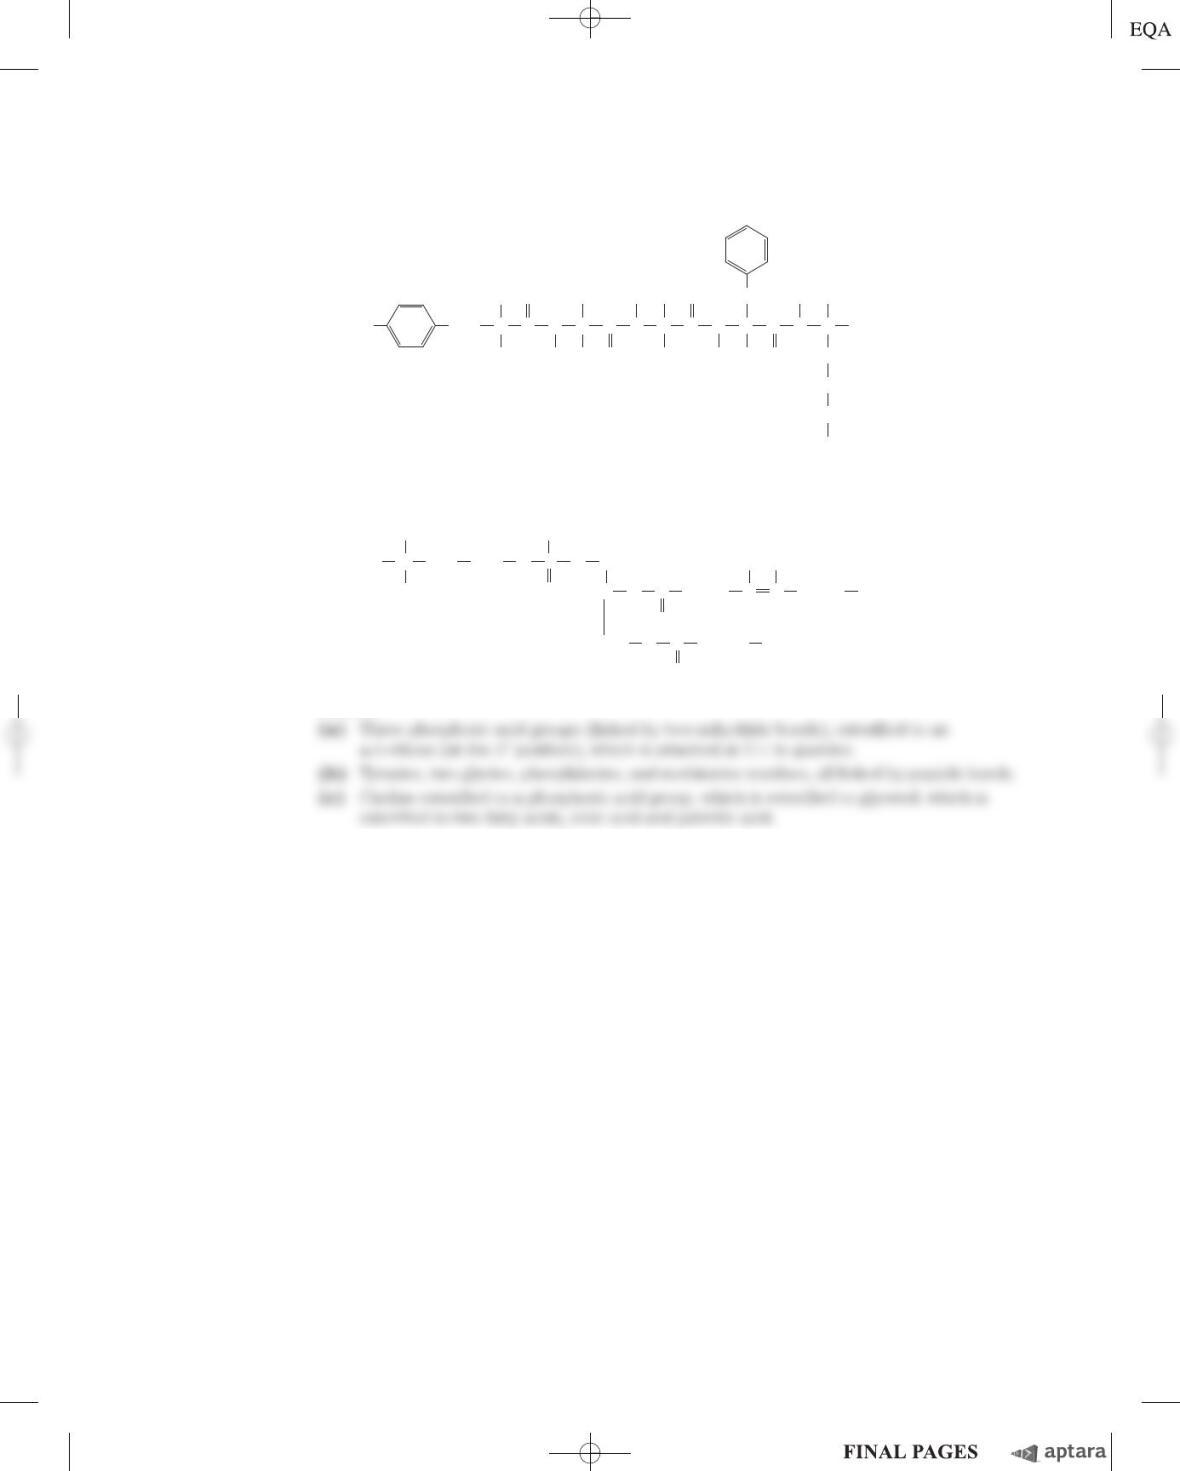
(b) Methionine enkephalin, the brain’s own opiate:
(c) Phosphatidylcholine, a component of many membranes:
Answer
13. Determination of the Structure of a Biomolecule An unknown substance, X, was isolated from
rabbit muscle. Its structure was determined from the following observations and experiments. Qualita-
tive analysis showed that X was composed entirely of C, H, and O. A weighed sample of X was com-
pletely oxidized, and the H
2
O and CO
2
produced were measured; this quantitative analysis revealed
that X contained 40.00% C, 6.71% H, and 53.29% O by weight. The molecular mass of X, determined
by mass spectrometry, was 90.00 u (atomic mass units; see Box 1–1). Infrared spectroscopy showed
that X contained one double bond. X dissolved readily in water to give an acidic solution; the solution
demonstrated optical activity when tested in a polarimeter.
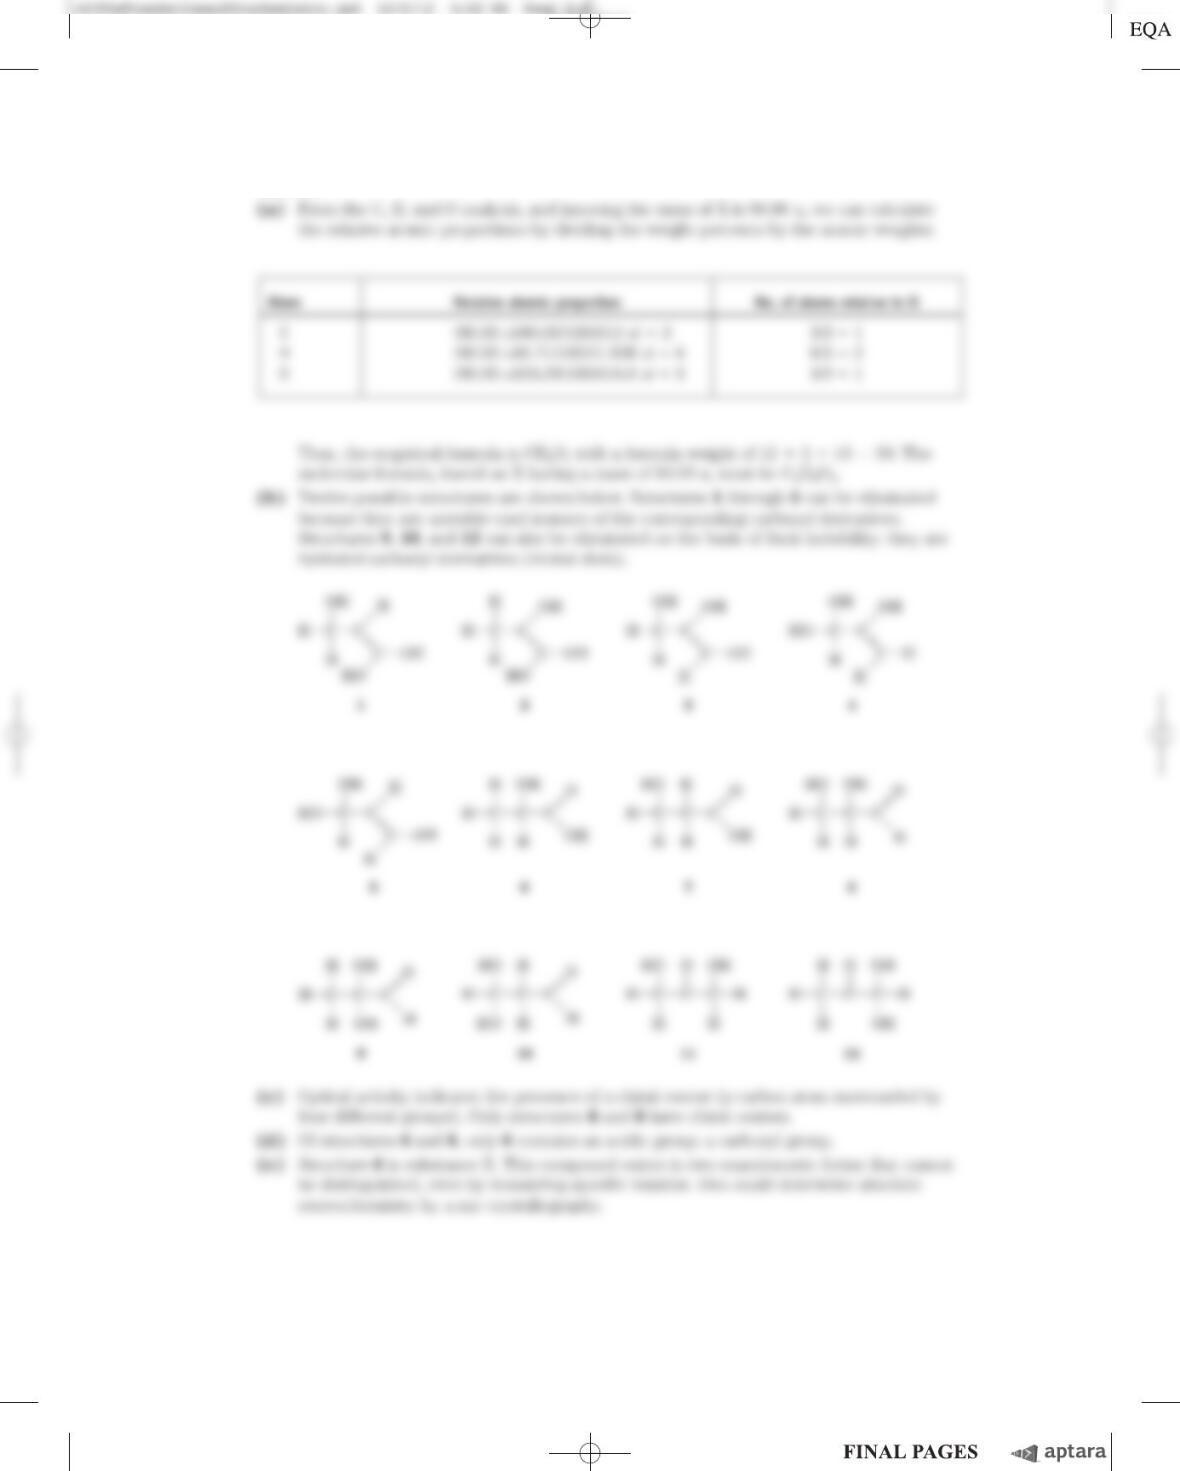
(a) Determine the empirical and molecular formula of X.
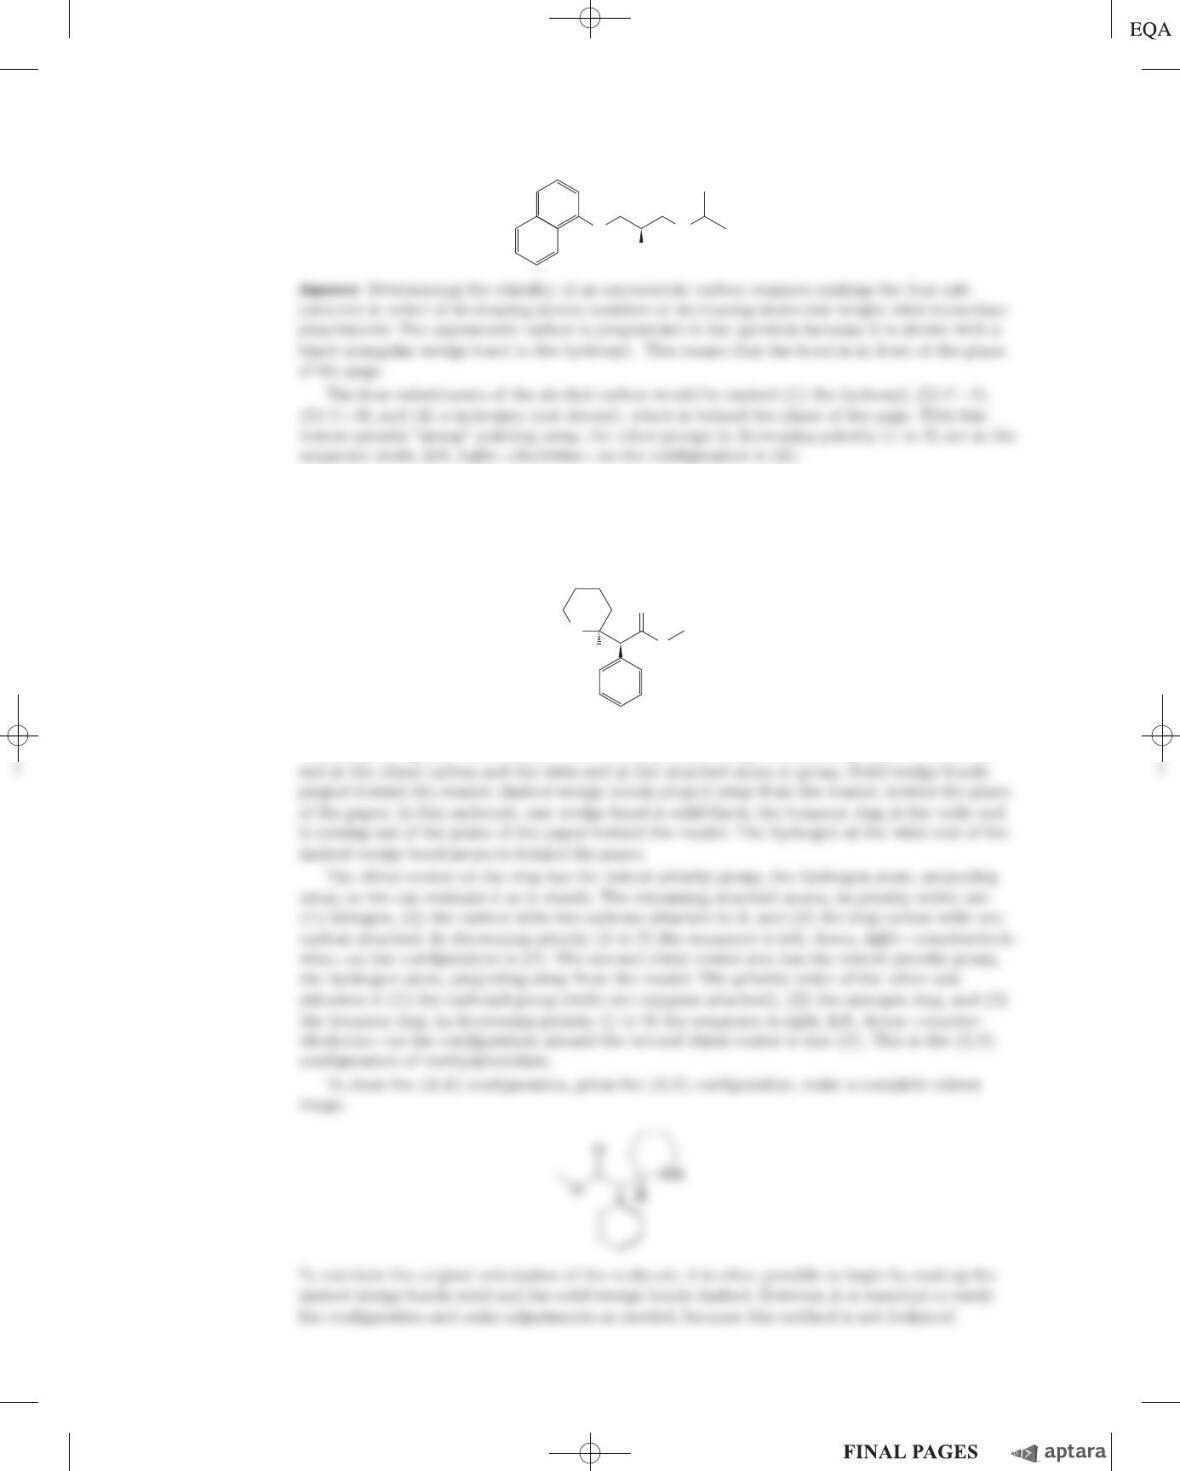
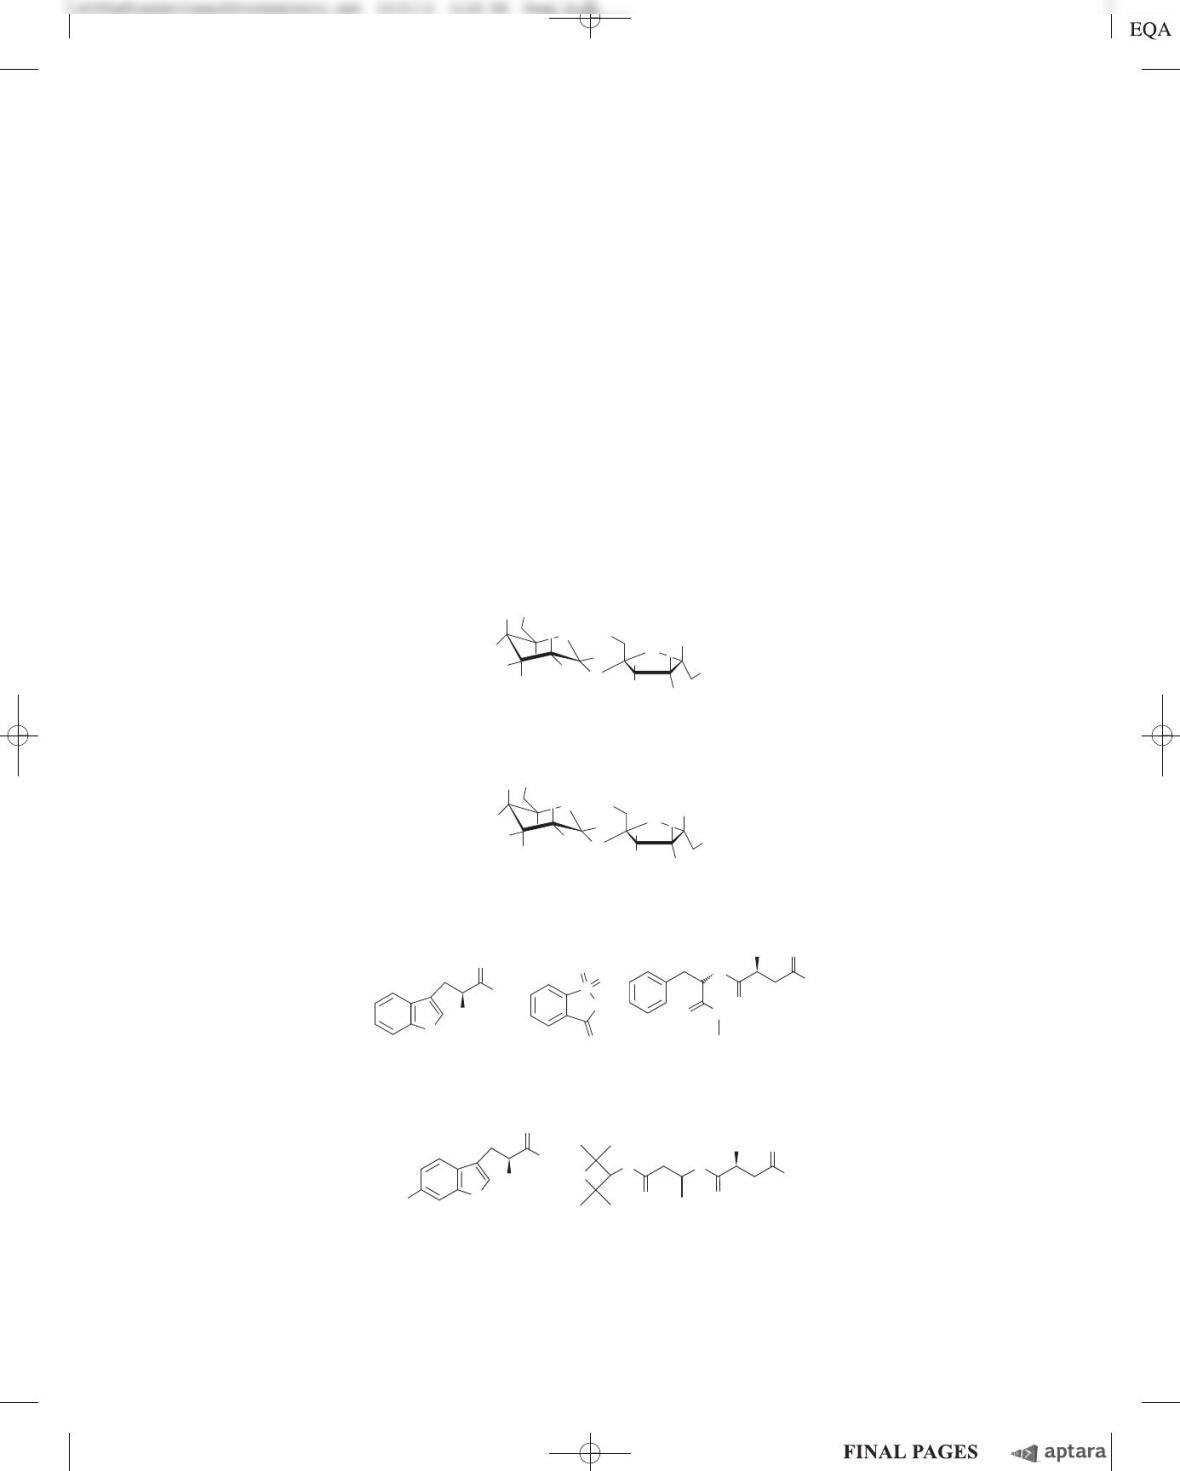
(b) Draw the possible structures of X that fit the molecular formula and contain one double bond.
Consider only linear or branched structures and disregard cyclic structures. Note that oxygen
makes very poor bonds to itself.
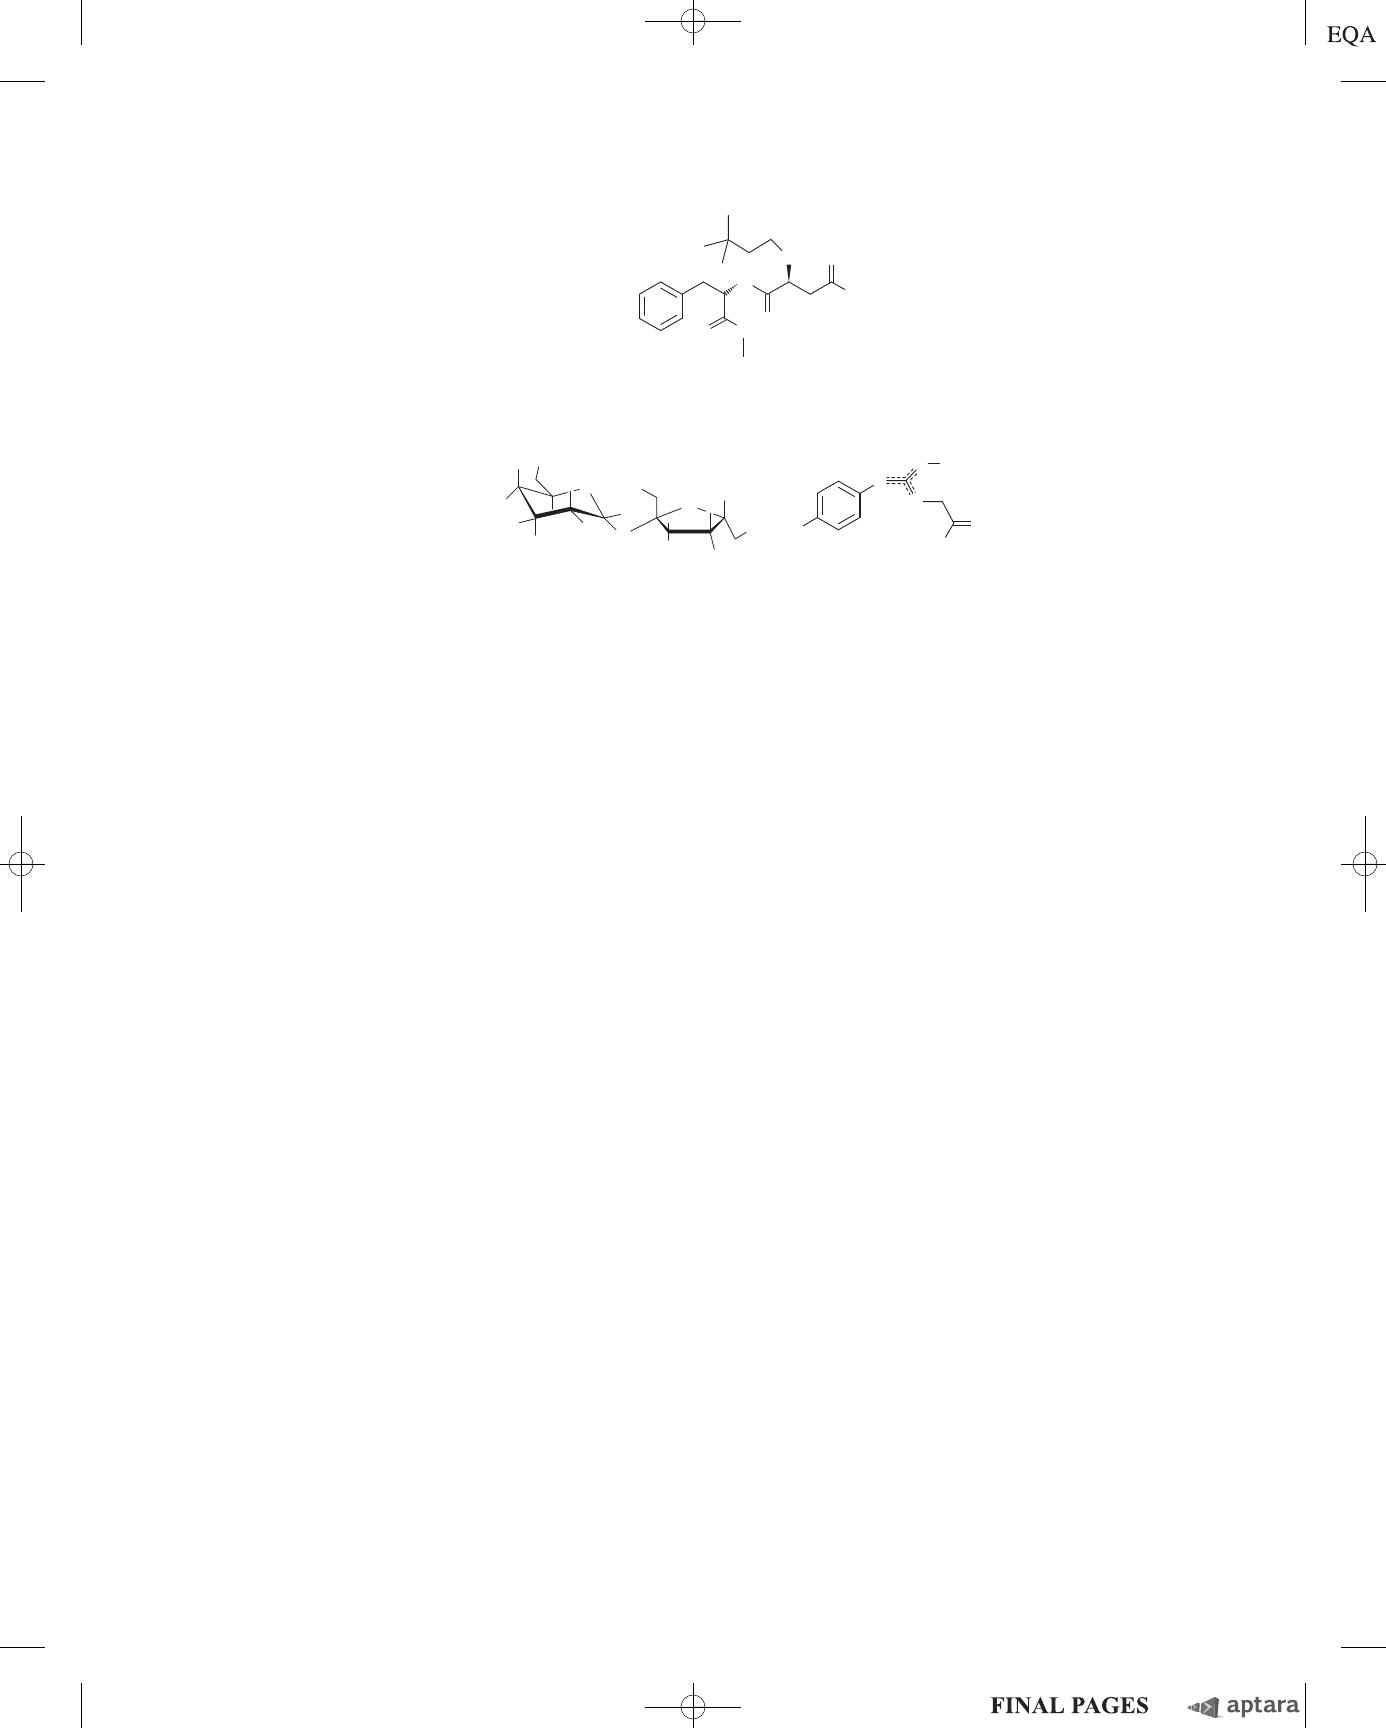
(c) What is the structural significance of the observed optical activity? Which structures in (b) are
consistent with the observation?
(d) What is the structural significance of the observation that a solution of X was acidic? Which
structures in (b) are consistent with the observation?
(e) What is the structure of X? Is more than one structure consistent with all the data?
Chapter 1 The Foundations of Biochemistry S-7
CH3
CH3
CH3
CH2CH2
HC
CH2CH3
C (CH2)14
O
OC CC(CH2)7(CH2)7CH3
CH2O OP
N
O
O
H H
O
O
CH2
HO C C CNC N CCNCCNC COO
HHO
NH2HHHO
H H H H
H H
OCH
2
CH2
CH2
CH3
S
O
c01TheFoundationsofBiochemistry.qxd 12/6/12 4:10 PM Page S-7
Answer
S-8 Chapter 1 The Foundations of Biochemistry
14. Naming Stereoisomers with One Chiral Carbon Using the RS System Propranolol is a chiral
com-
pound. (R)-Propranolol is used as a contraceptive; (S)-propranolol is used to treat hypertension. Identify
the chiral carbon in the structure below. Is this the (R) or the (S) isomer? Draw the other isomer.
15. Naming Stereoisomers with Two Chiral Carbons Using the RS System The (R,R) isomer of
methylphenidate (Ritalin) is used to treat attention deficit hyperactivity disorder (ADHD). The (S,S)
isomer is an antidepressant. Identify the two chiral carbons in the structure below. Is this the (R,R) or
the (S,S) isomer? Draw the other isomer.
Chapter 1 The Foundations of Biochemistry S-9
O
OH
N
H
O
O
H
HN
Answer The asymmetric carbons can be identified by the presence of the wedge-shaped bonds
indicating the spatial relationship of the bound groups. Wedge bonds always have the narrow
c01TheFoundationsofBiochemistry.qxd 12/6/12 4:10 PM Page S-9
Data Analysis Problem
16. Interaction of Sweet-Tasting Molecules with Taste Receptors Many compounds taste sweet to
humans. Sweet taste results when a molecule binds to the sweet receptor, one type of taste recep-
tor, on the surface of certain tongue cells. The stronger the binding, the lower the concentration re-
quired to saturate the receptor and the sweeter a given concentration of that substance tastes. The
standard free-energy change, G, of the binding reaction between a sweet molecule and a sweet re-
ceptor can be measured in kilojoules or kilocalories per mole.
Sweet taste can be quantified in units of “molar relative sweetness” (MRS), a measure that com-
pares the sweetness of a substance to the sweetness of sucrose. For example, saccharin has an MRS of
161; this means that saccharin is 161 times sweeter than sucrose. In practical terms, this is measured
by asking human subjects to compare the sweetness of solutions containing different concentrations of
each compound. Sucrose and saccharin taste equally sweet when sucrose is at a concentration 161
times higher than that of saccharin.
(a) What is the relationship between MRS and the Gof the binding reaction? Specifically, would a
more negative Gcorrespond to a higher or lower MRS? Explain your reasoning.
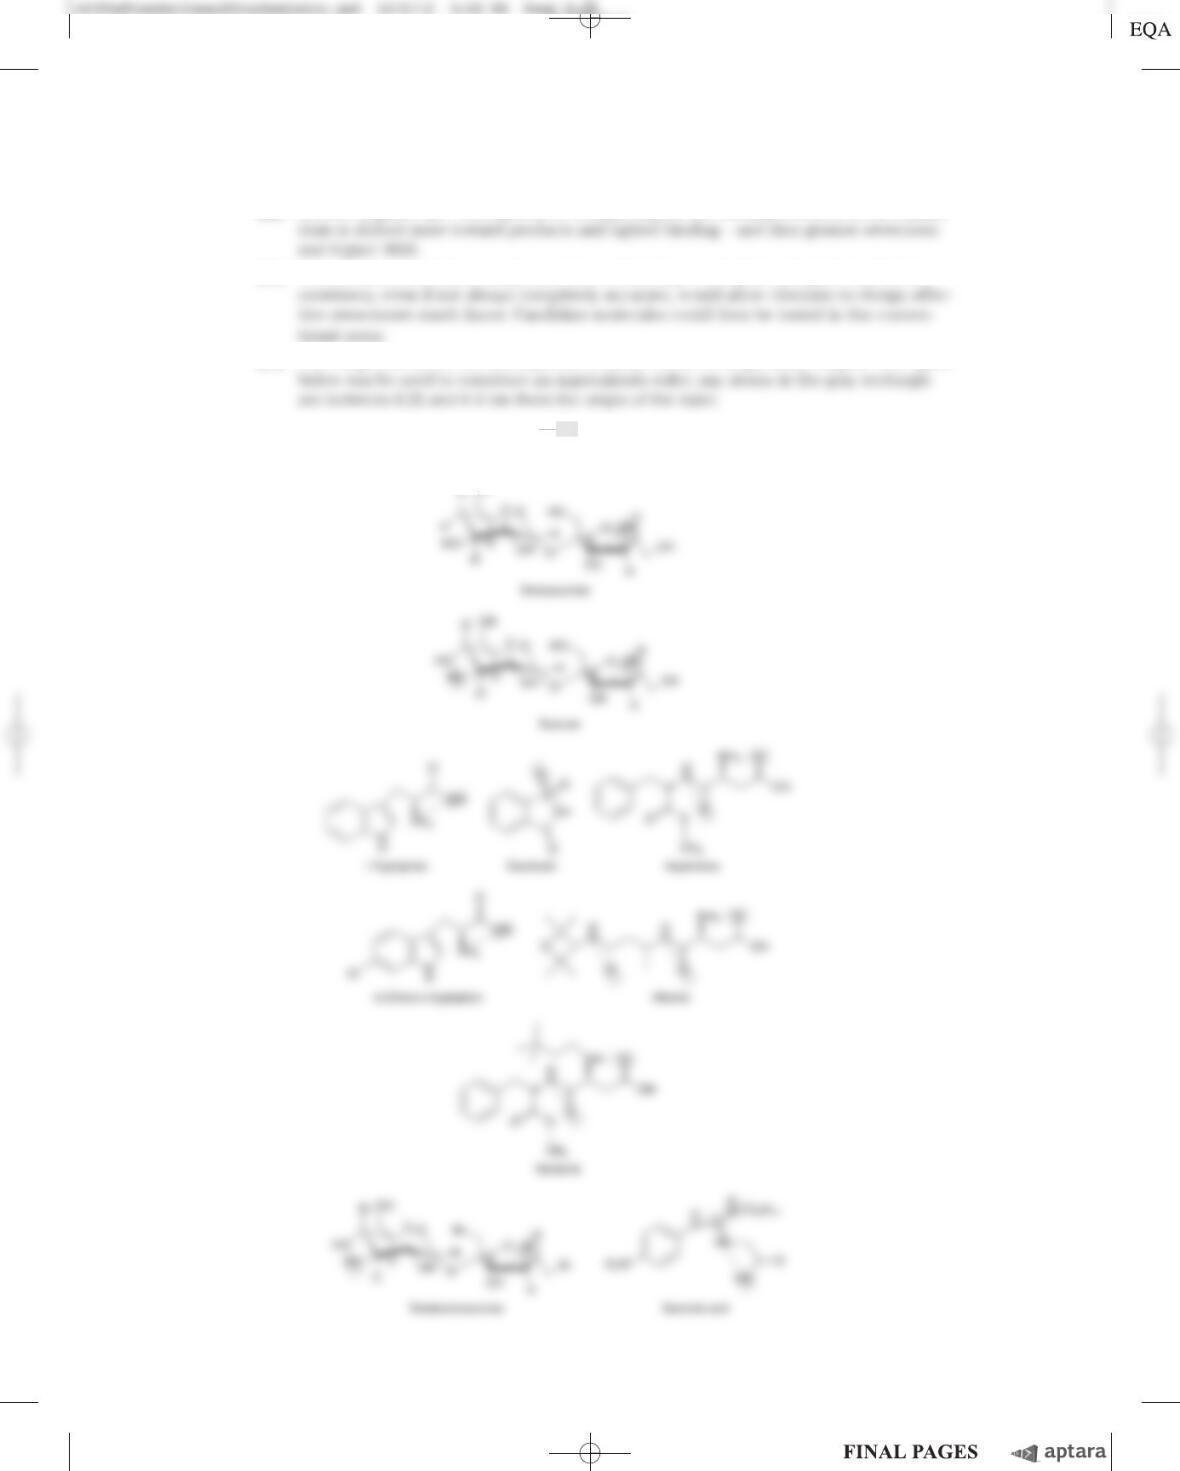
Shown below are the structures of 10 compounds, all of which taste sweet to humans. The MRS
and Gfor binding to the sweet receptor are given for each substance.
S-10 Chapter 1 The Foundations of Biochemistry
Deoxysucrose
MRS 0.95
ΔG° 6.67 kcal/mol
H
H
H
H
H
H
H
H
O
O
H
OH
OH
OH
OH
OH
HO
HO
O
Sucrose
MRS 1
ΔG° 6.71 kcal/mol
H
H
HO
H
H
H
H
H
O
O
H
OH
OH
OH
OH
OH
HO
HO
O
D-Tryptophan
MRS 21
ΔG° 8.5 kcal/mol
OH
N
H
O
NH2
Saccharin
MRS 161
ΔG° 9.7 kcal/mol
SO
O
O
NH
Aspartame
MRS 172
ΔG° 9.7 kcal/mol
H
N
O
O
O
O
OH
CH3
NH2
6-Chloro-D-tryptophan
MRS 906
ΔG° 10.7 kcal/mol
OH
Cl N
H
O
NH2
Alitame
MRS 1,937
ΔG° 11.1 kcal/mol
H
N
H
N
O
O
OH
NH2
O
S
Chapter 1 The Foundations of Biochemistry S-11
Neotame
MRS 11,057
ΔG° 12.1 kcal/mol
H
N
O
O
O
O
OH
CH3
NH
Tetrabromosucrose
MRS 13,012
ΔG° 12.2 kcal/mol
H
Br
HO
H
H
H
H
H
O
O
H
Br
B
r
OH
OH
OH
HO
Br
O
Sucronic acid
MRS 200,000
ΔG
° 13.8 kcal/mol
H
N
H
N
O2N
C9H17
HN
HO
O
+
Morini, Bassoli, and Temussi (2005) used computer-based methods (often referred to as “in
silico” methods) to model the binding of sweet molecules to the sweet receptor.
(b) Why is it useful to have a computer model to predict the sweetness of molecules, instead of a
human- or animal-based taste assay?
In earlier work, Schallenberger and Acree (1967) had suggested that all sweet molecules include
an “AH-B” structural group, in which “A and B are electronegative atoms separated by a distance of
greater than 2.5 Å [0.25 nm] but less than 4 Å [0.4 nm]. H is a hydrogen atom attached to one of the
electronegative atoms by a covalent bond” (p. 481).
(c) Given that the length of a “typical” single bond is about 0.15 nm, identify the AH-B group(s) in
each of the molecules shown above.
(d) Based on your findings from (c), give two objections to the statement that “molecules containing
an AH-B structure will taste sweet.”
(e) For two of the molecules shown above, the AH-B model can be used to explain the difference in
MRS and G. Which two molecules are these, and how would you use them to support the AH-B
model?
(f) Several of the molecules have closely related structures but very different MRS and Gvalues.
Give two such examples, and use these to argue that the AH-B model is unable to explain the
observed differences in sweetness.
In their computer-modeling study, Morini and coauthors used the three-dimensional structure of
the sweet receptor and a molecular dynamics modeling program called GRAMM to predict the Gof
binding of sweet molecules to the sweet receptor. First, they “trained” their model—that is, they re-
fined the parameters so that the Gvalues predicted by the model matched the known Gvalues for
one set of sweet molecules (the “training set”). They then “tested” the model by asking it to predict
the Gvalues for a new set of molecules (the “test set”).
(g) Why did Morini and colleagues need to test their model against a different set of molecules from
the set it was trained on?
(h) The researchers found that the predicted Gvalues for the test set differed from the actual val-
ues by, on average, 1.3 kcal/mol. Using the values given with the structures above, estimate the
resulting error in MRS values.
c01TheFoundationsofBiochemistry.qxd 12/6/12 4:10 PM Page S-11
S-12 Chapter 1 The Foundations of Biochemistry
Answer
(a) A more negative G° corresponds to a larger K
eq
for the binding reaction, so the equilib-
(b) Animal-based sweetness assays are time-consuming. A computer program to predict
(c) The range 0.25 to 0.4 nm corresponds to about 1.5 to 2.5 single-bond lengths. The figure
There are many possible AH-B groups in the molecules; a few are shown here.
OH
Chapter 1 The Foundations of Biochemistry S-13
c01TheFoundationsofBiochemistry.qxd 12/6/12 4:10 PM Page S-13