CHAPTER 16 Financial Statement Analysis
E 16-37
=
E 16-38
= 0.1858, or 18.58%
2. The return on sales ratio illustrates the number of cents from each sales
dollar that is left over after covering all expenses, including production costs
(in cost of goods sold), period costs of the current period (such as supplies,
=
Return on Sales1.
0.63
Net Income
=Sales
$2,100,000
$11,300,000
=
=$16,400,000
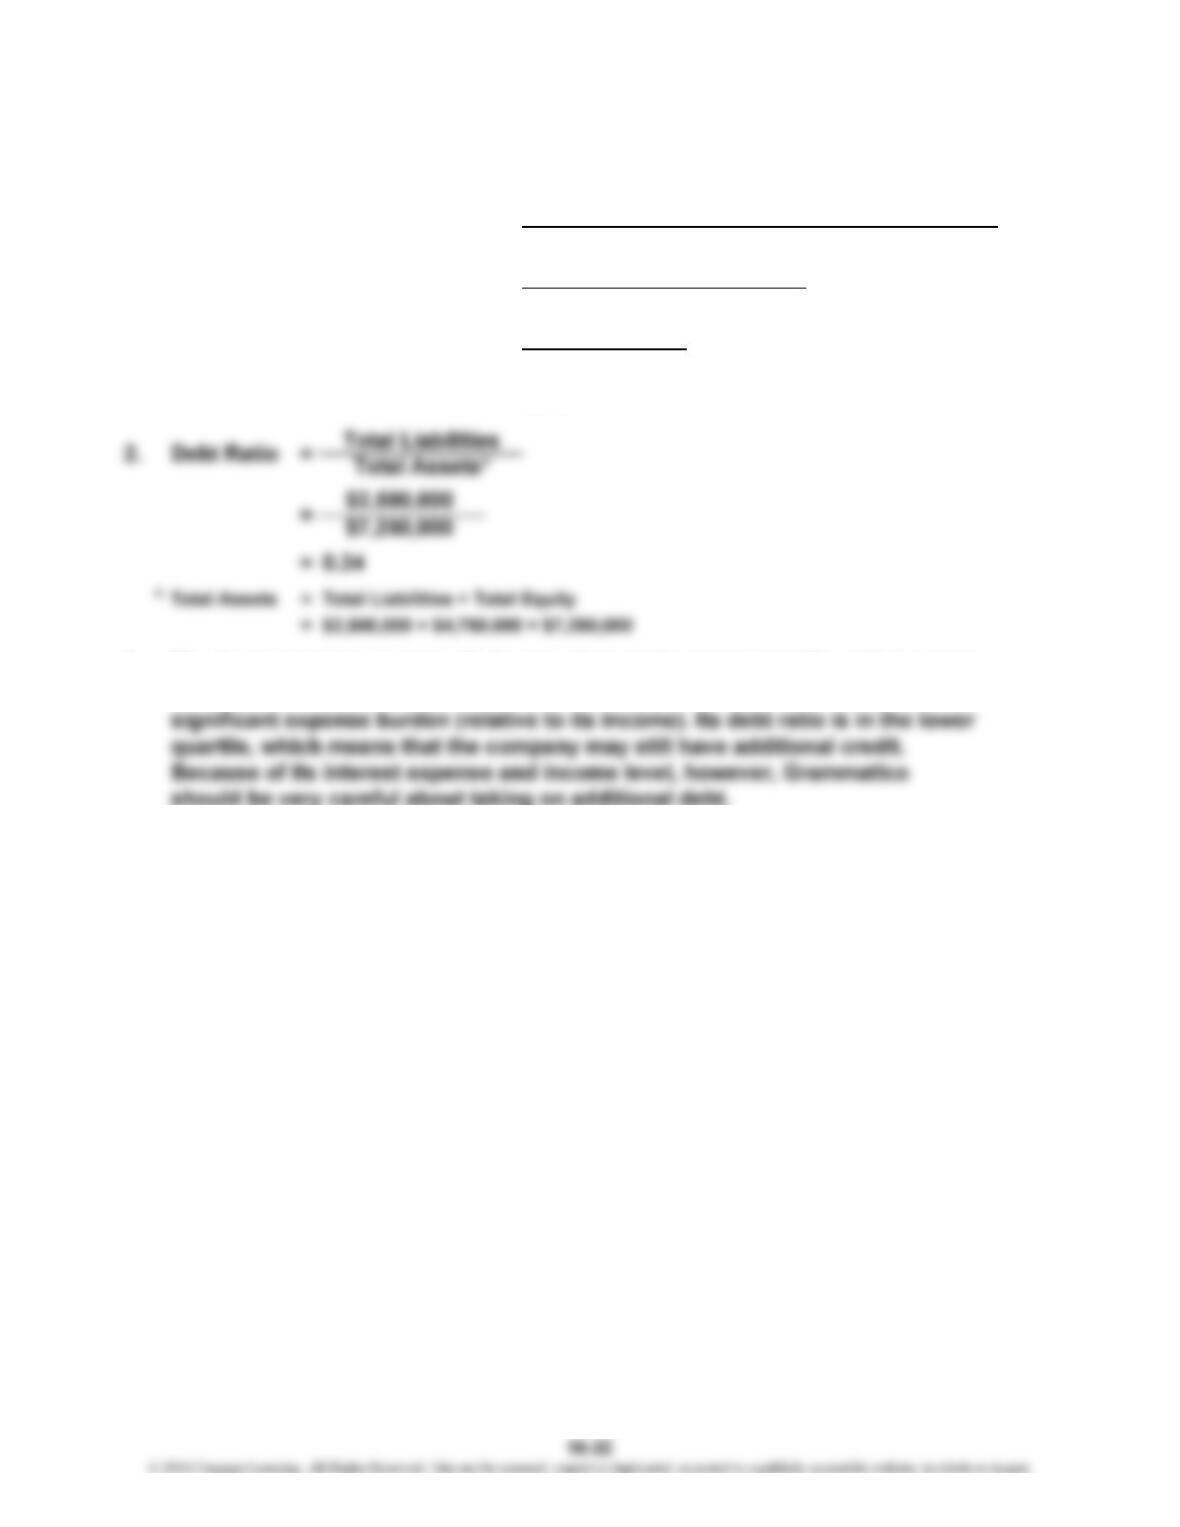
2.
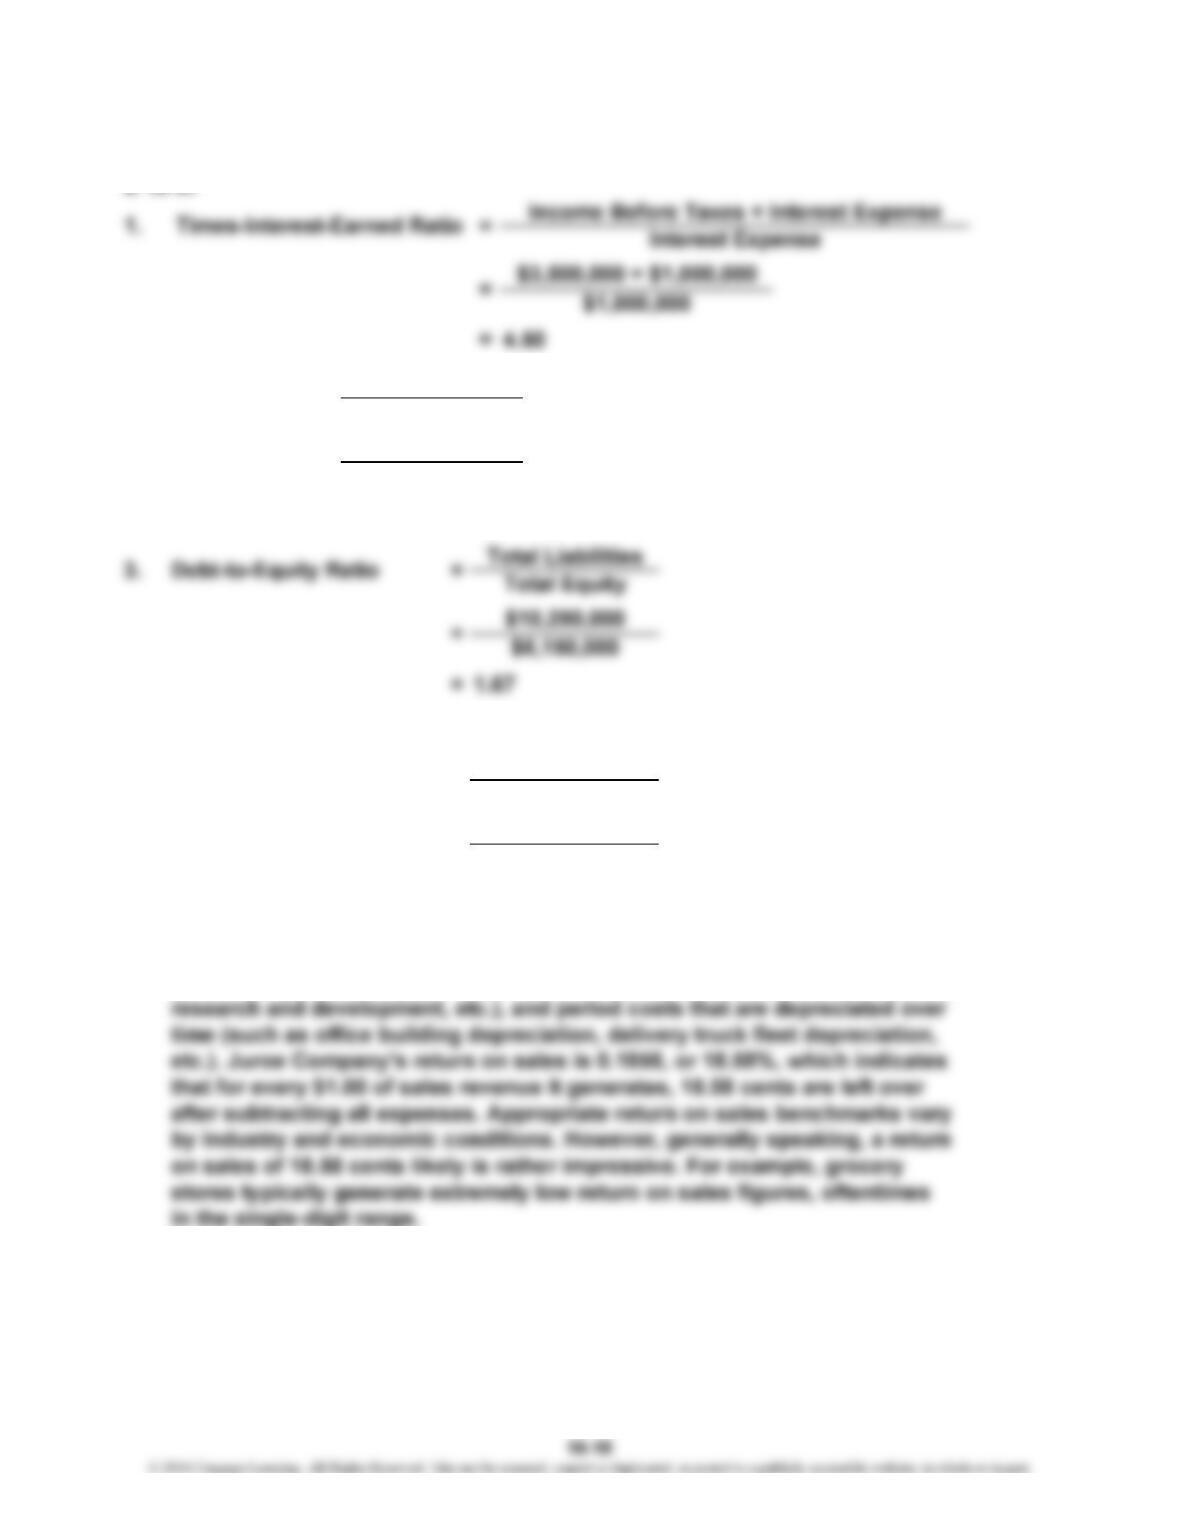
Debt Ratio Total Liabilities
Total Assets
$10,250,000
CHAPTER 16 Financial Statement Analysis
E 16-39
E 16-40
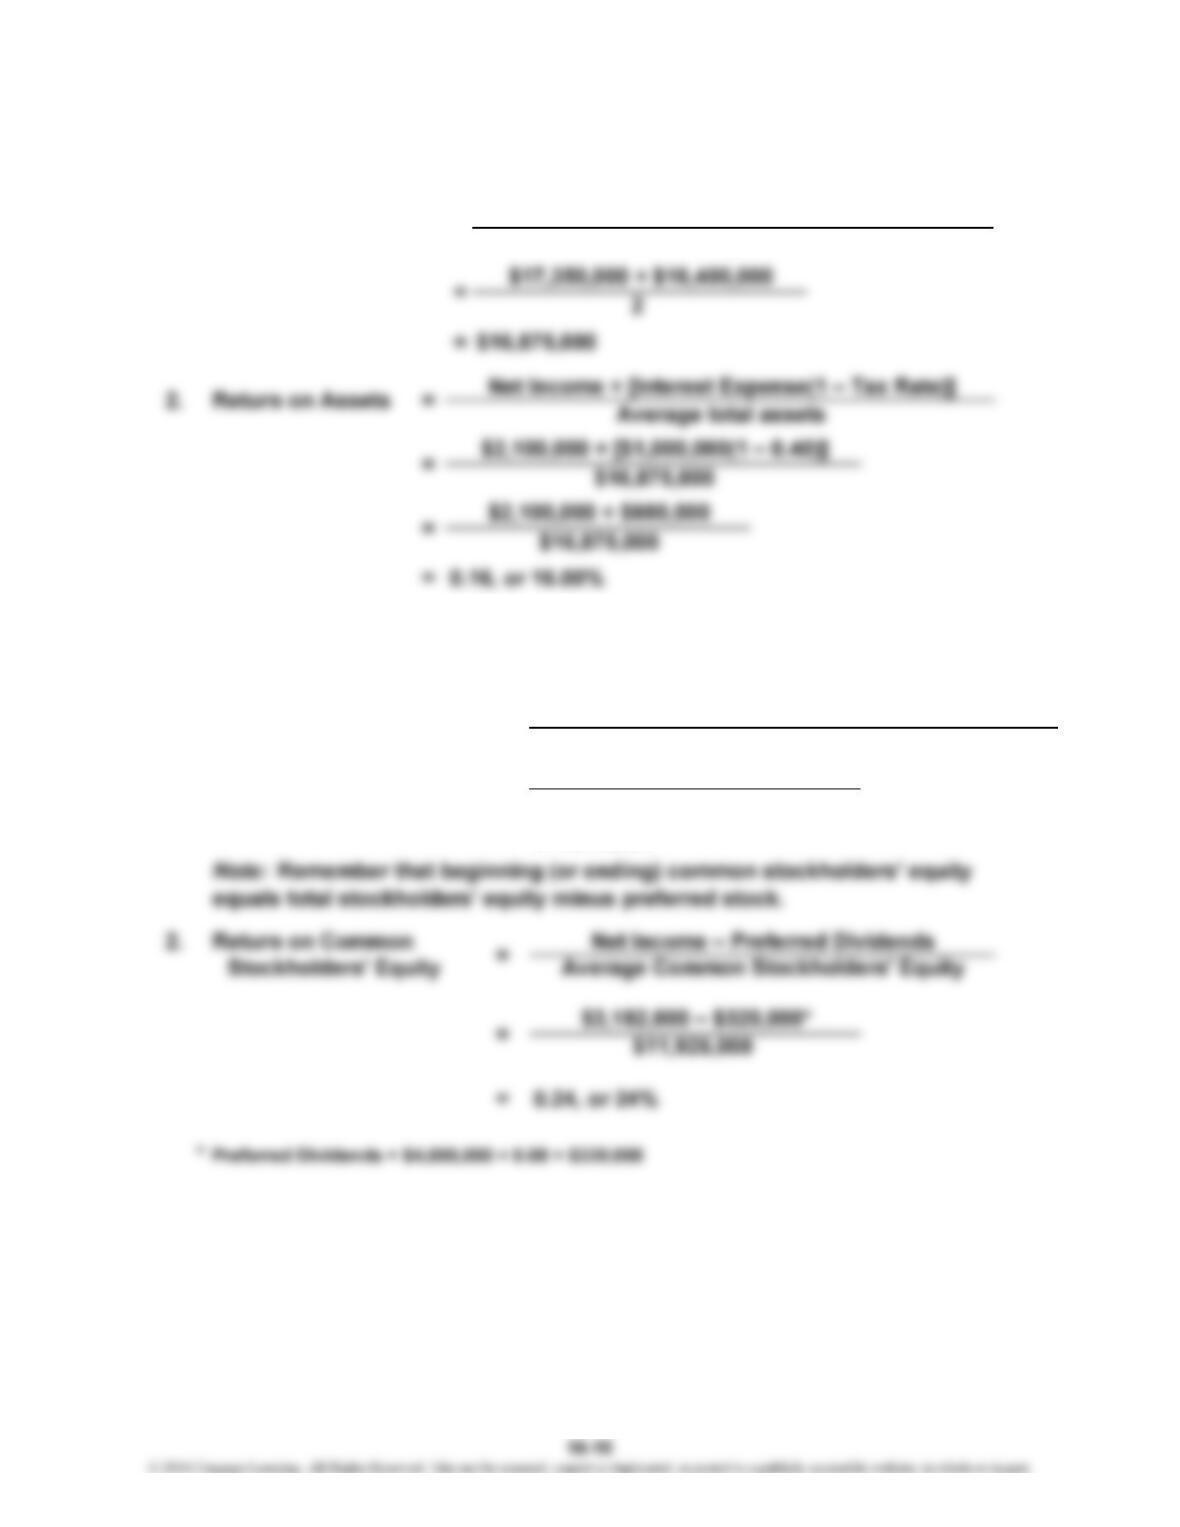
1. Average Common
Stockholders’ Equity
=
2
$11,925,000
Ending Common Stockholders’ Equity
Beginning Common Stockholders’ Equity +
Beginning Total Assets + Ending Total Assets
2
$11,800,000 + $12,050,000
2
=Average Total Assets1.
=
=
E 16-41
1. Preferred Dividends = $4,000,000 × 0.08 = $320,000
$3,000,000
$3
E 16-42
=
1,000,000
$2.60 per share
1,000,000 shares
$2,600,000
=
==
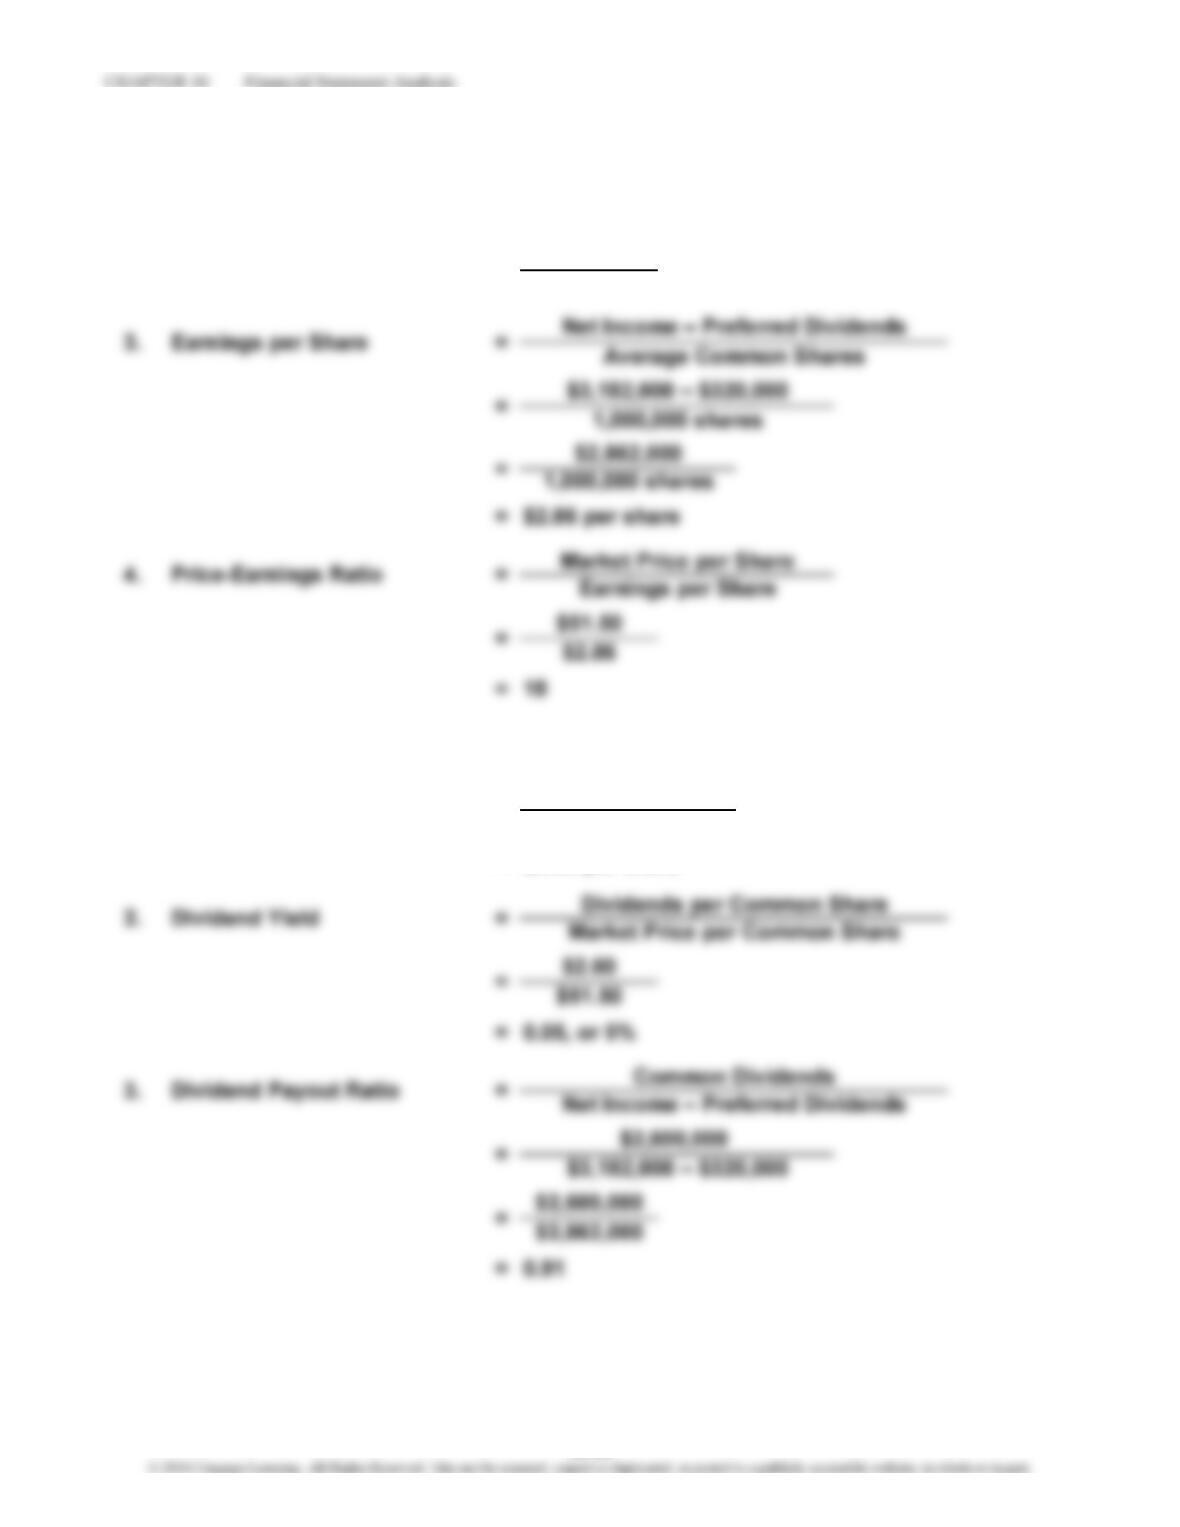
Dividends per Share 1.
2. Number of Common Shares
16-20
CHAPTER 16 Financial Statement Analysis
P 16-43
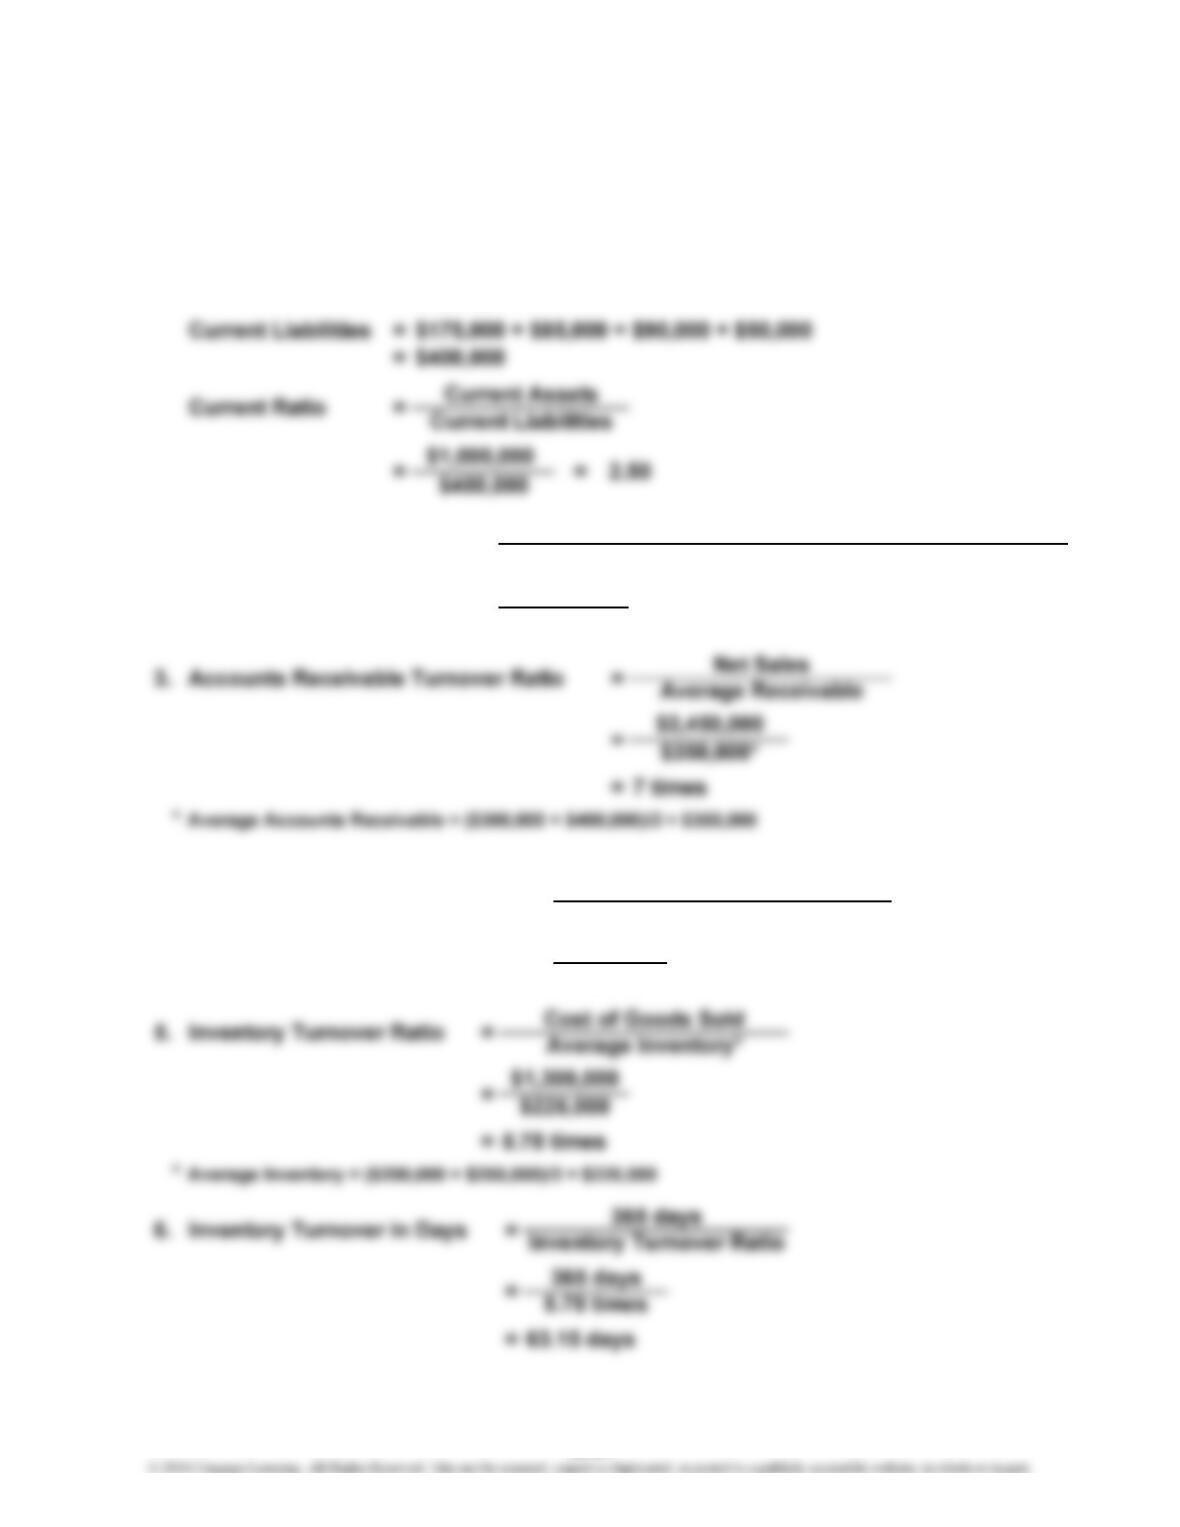
1. Current Assets = $250,000 + $400,000 + $100,000 + $200,000 + $50,000
=
A
4.
52.14 days
A
PROBLEMS
$1,000,000
365 days
7 times
A
ccounts Receivable Turnover
=
=
=
==
$700,000
Quick or Acid-Test Ratio Cash + Marketable Securities + Accounts Receivable
Current Liabilities
2.
1.75
=
$400,000
Accounts Receivable Turnover in Days
365 days
16-21
CHAPTER 16 Financial Statement Analysis
P 16-44
=
3. The times-interest-earned ratio is very close to the lower quartile, which means
that relative to most companies in the industry, Grammatico Company has a
$200,000 + $140,000
Income Before Taxes + Interest Expense
Interest Expense
$140,000
=
=
=$340,000
$140,000
2.43
1.
Times-Interest-Earned Ratio
P 16-45
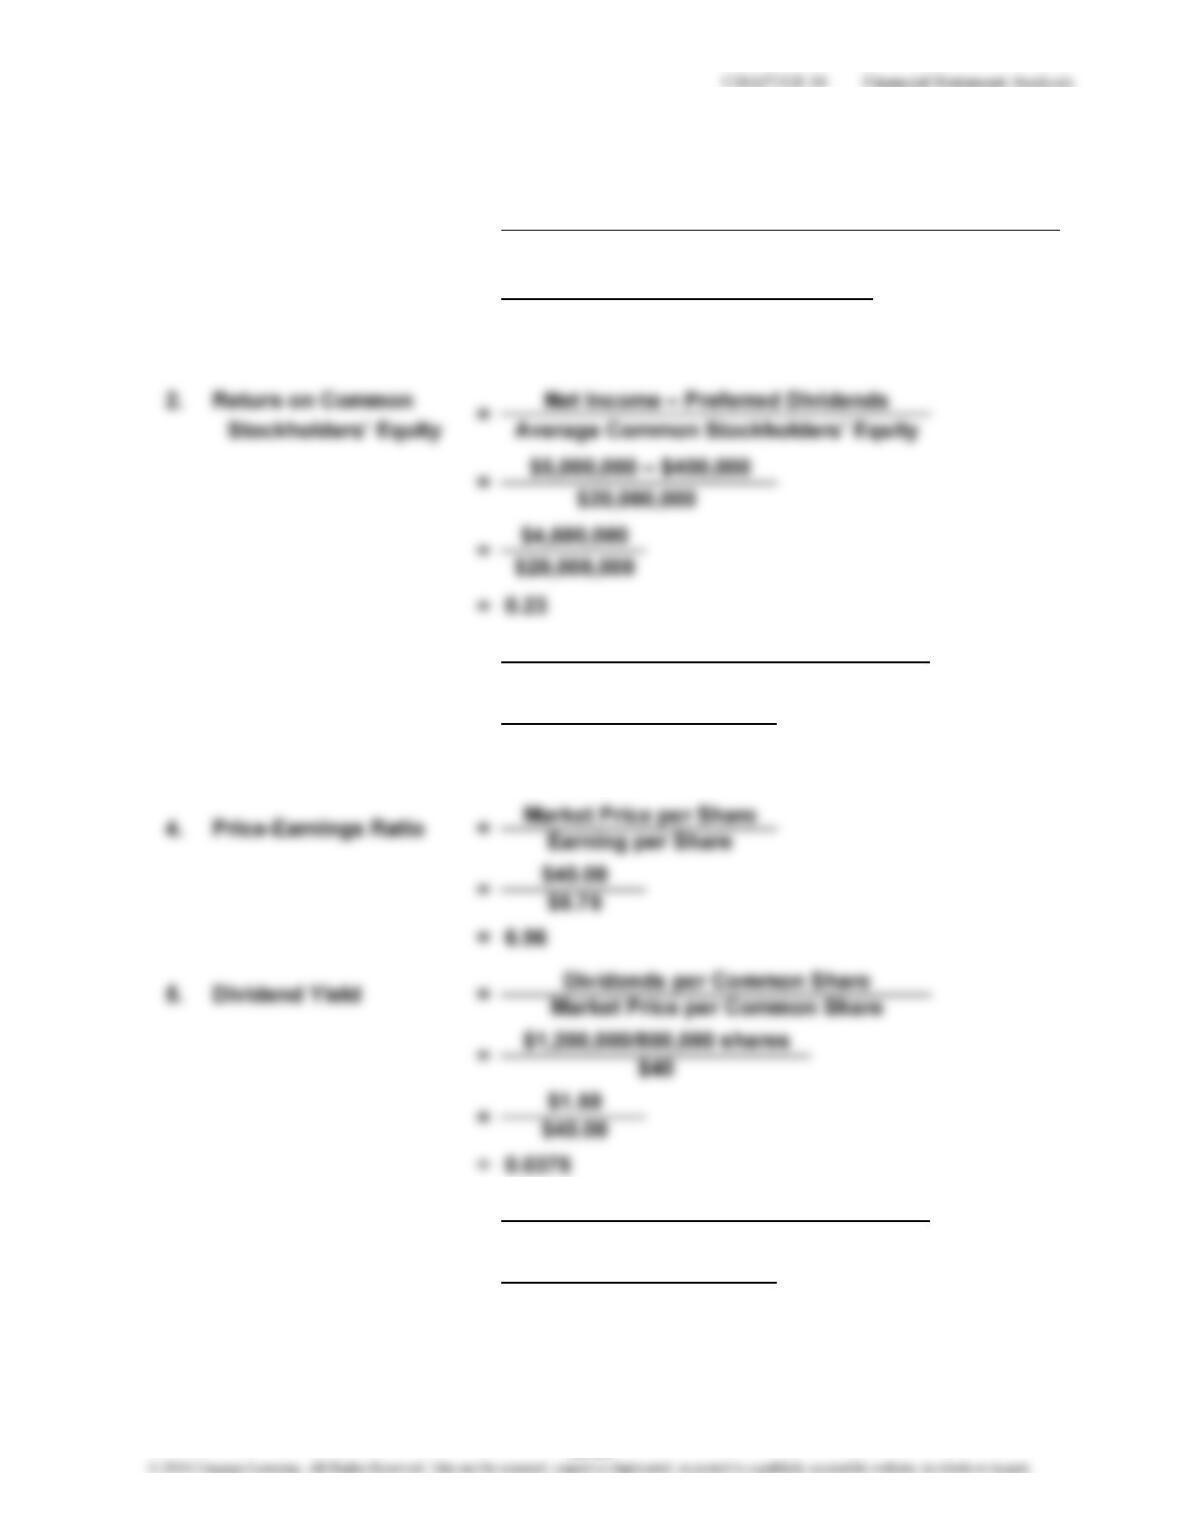
=
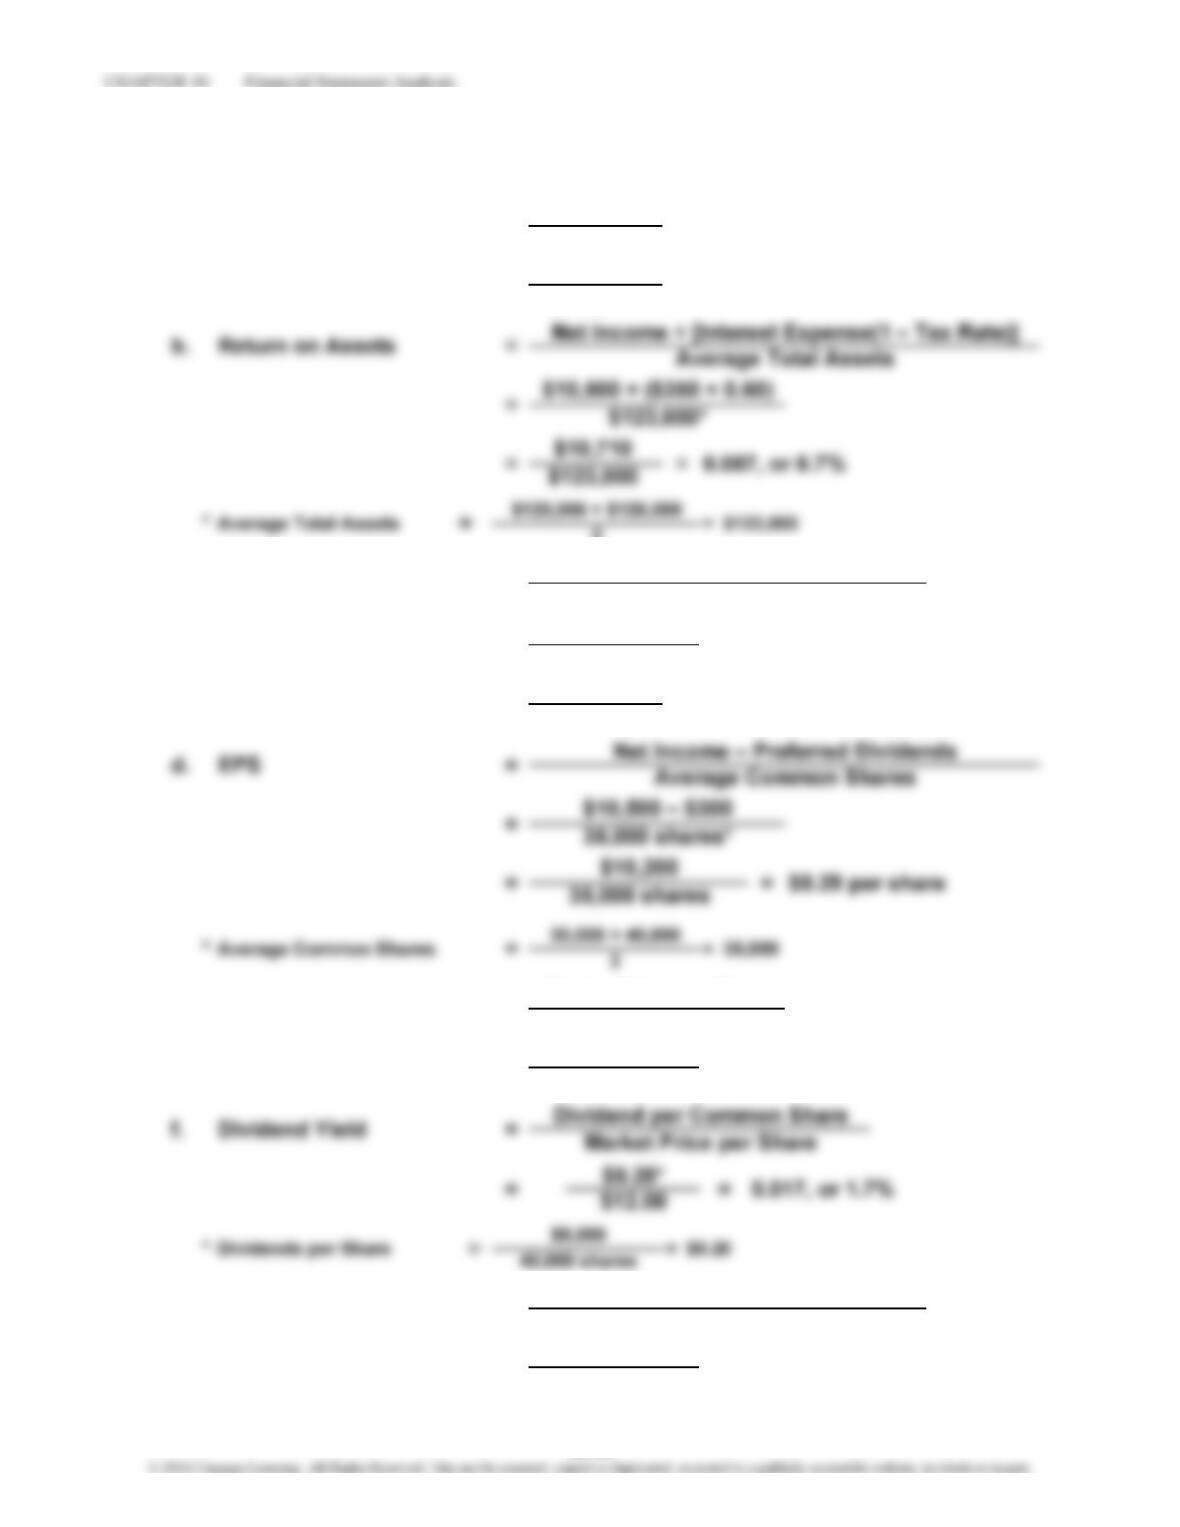
= $5.75 per share
= 0.26
$5,000,000 – $400,000
800,000 shares
Net Income – Preferred Dividends
A
verage Common Shares
Net Income + [Interest Expense(1 – Tax Rate)]
Average Total Assets
0.088
$5,000,000 + ($400,000 × 0.66)
$60,000,000
Net Income – Preferred Dividends
Common Dividends
$5,000,000 – $400,000
$1,200,000
=
=
=
=
Dividend Payout Ratio
=6.
=
Return on Assets1.
Earnings per Share3.
16-23
CHAPTER 16 Financial Statement Analysis
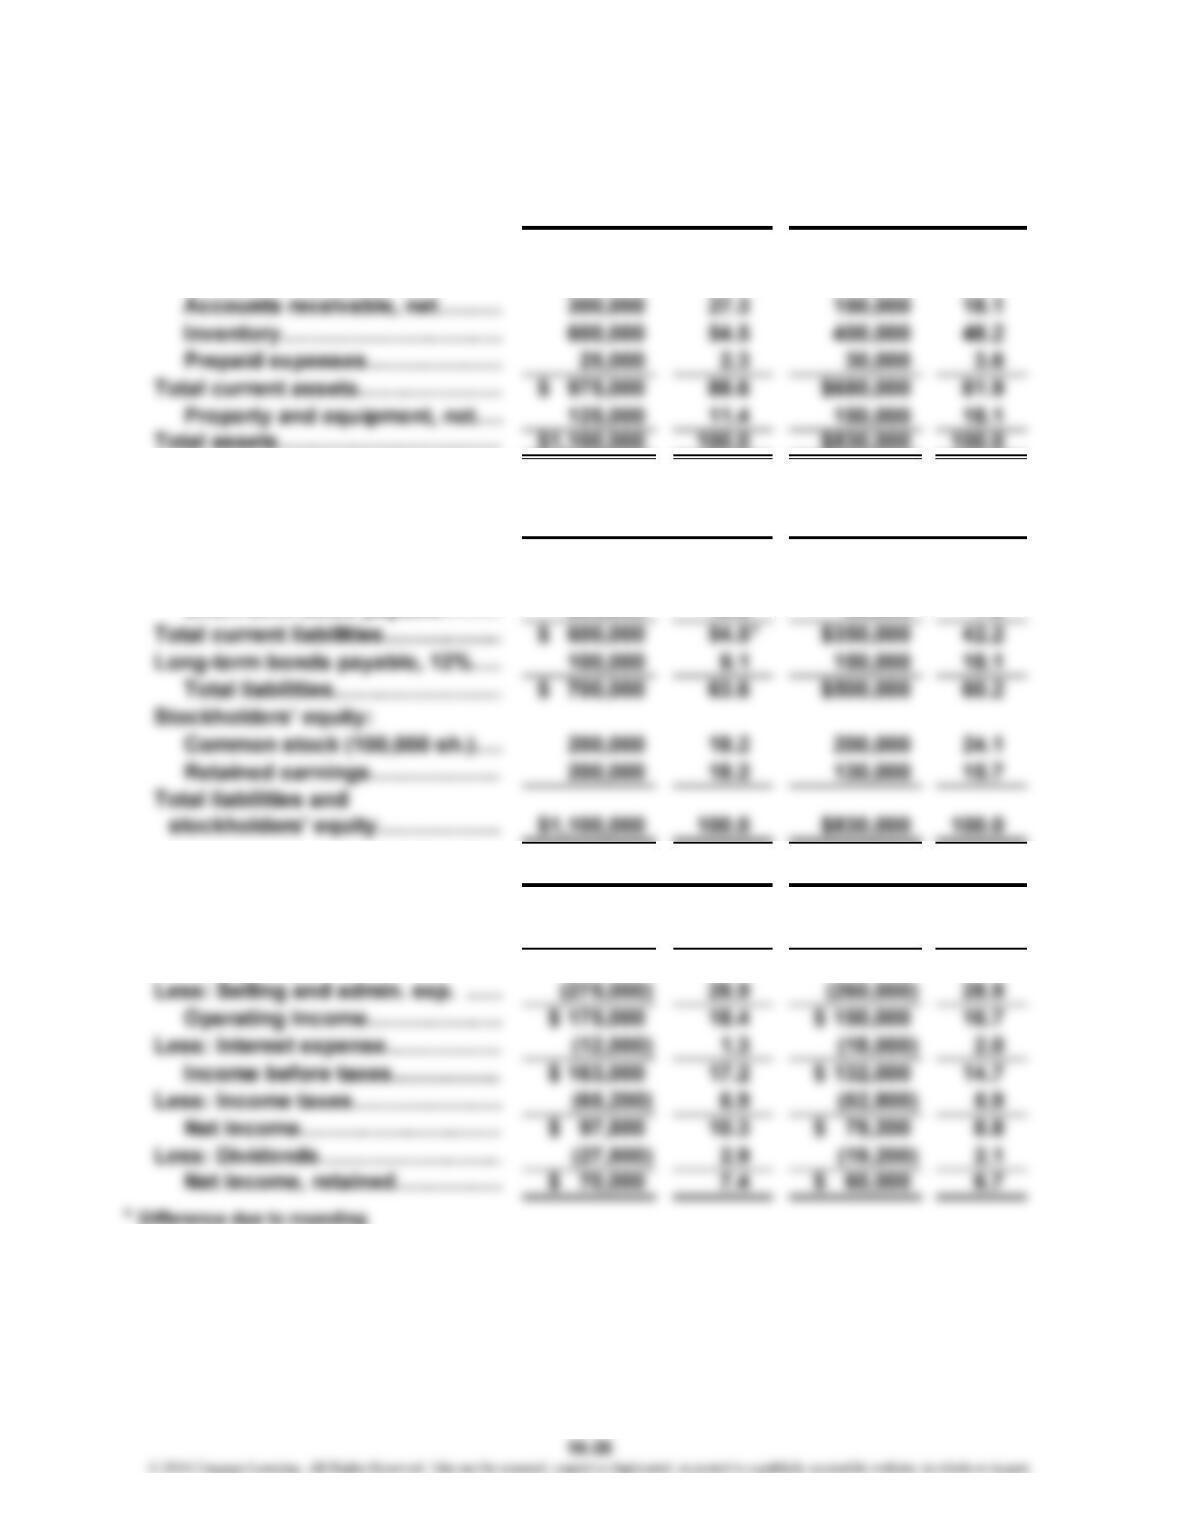
P 16-46
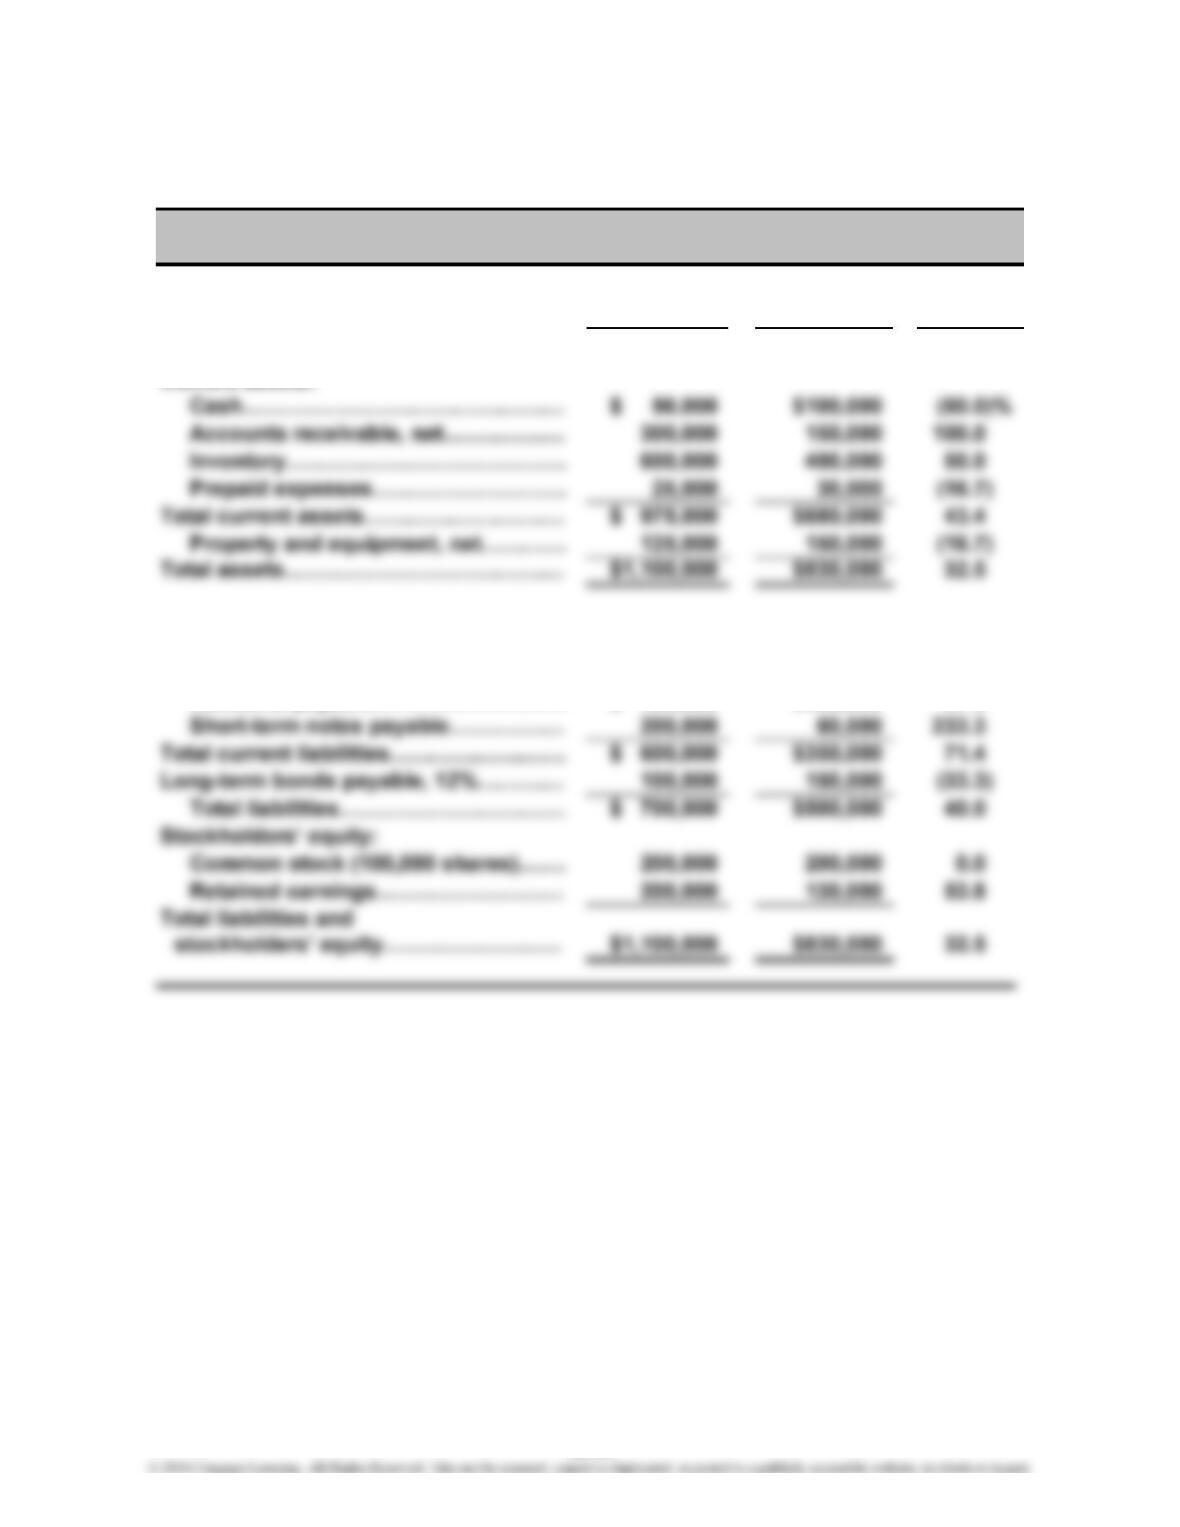
1.
This Year Last Year
Current assets:
Current liabilities:
Accounts payable……………………
…
$ 400,000 $290,000 37.9
Liabilities and Stockholders’ Equity
Kepler Company
Comparative Balance Sheets
Percent
Change
Assets
16-24
…
CHAPTER 16 Financial Statement Analysis
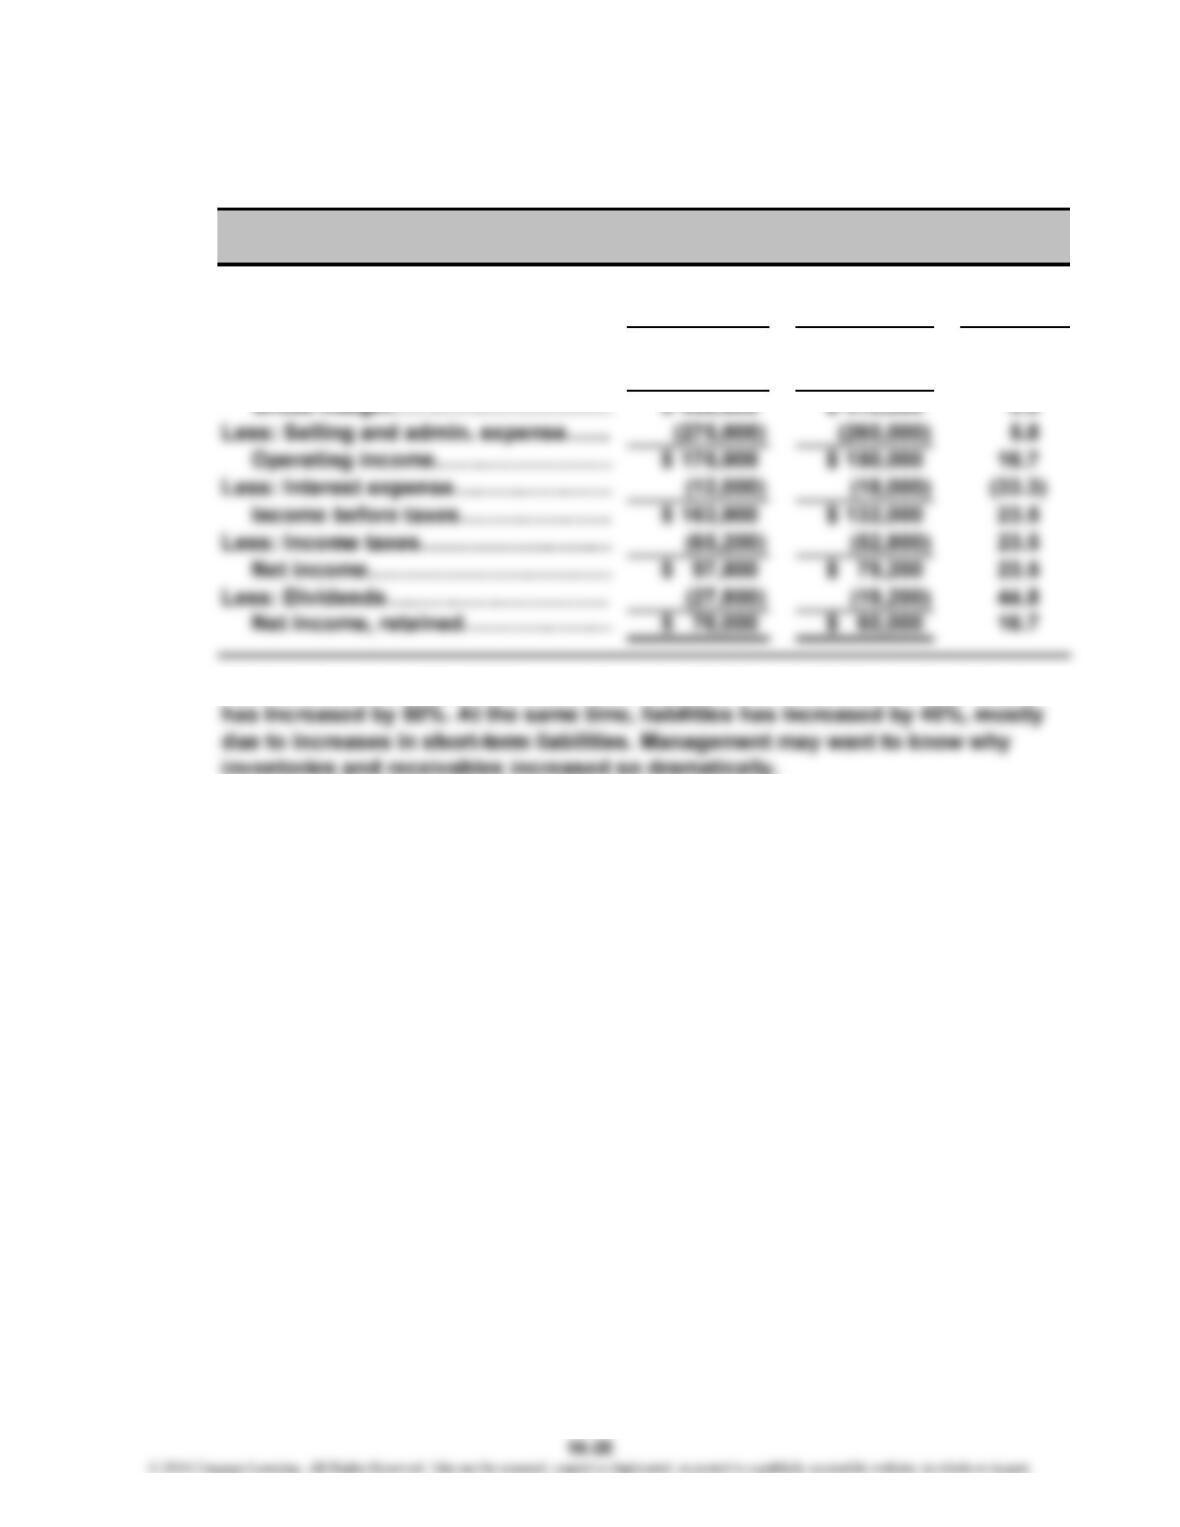
P 16-46 (Continued)
This Year Last Year
Sales………………………………………
…
$ 950,000 $ 900,000 5.6%
Less: Cost of goods sold………………
…
(500,000) (490,000) 2.0
2. Cash has decreased by 50%, accounts receivable has doubled, and inventory
Change
Kepler Company
Comparative Income Statements
Percent
CHAPTER 16 Financial Statement Analysis
P 16-47
1. Assets
Current assets:
Cash………………………………
…
$ 50,000 4.5% $100,000 12.0%
2. Liabilities and Stockholders’ Equity
Current liabilities:
Accounts payable………………
…
$ 400,000 36.4% $290,000 34.9%
Short-term notes payable……
…
200,000 18.2 60,000 7.2
…
3. Sales…………………………………
…
$ 950,000 100.0% $ 900,000 100.0%
Less: Cost of goods sold…………
…
(500,000) 52.6 (490,000) 54.4
Gross margin……………………
…
$ 450,000 47.4 $ 410,000 45.6
…
This Yea
r
This Yea
r
Last Yea
r
Last Yea
r
Last Yea
r
This Yea
r
…
…
…
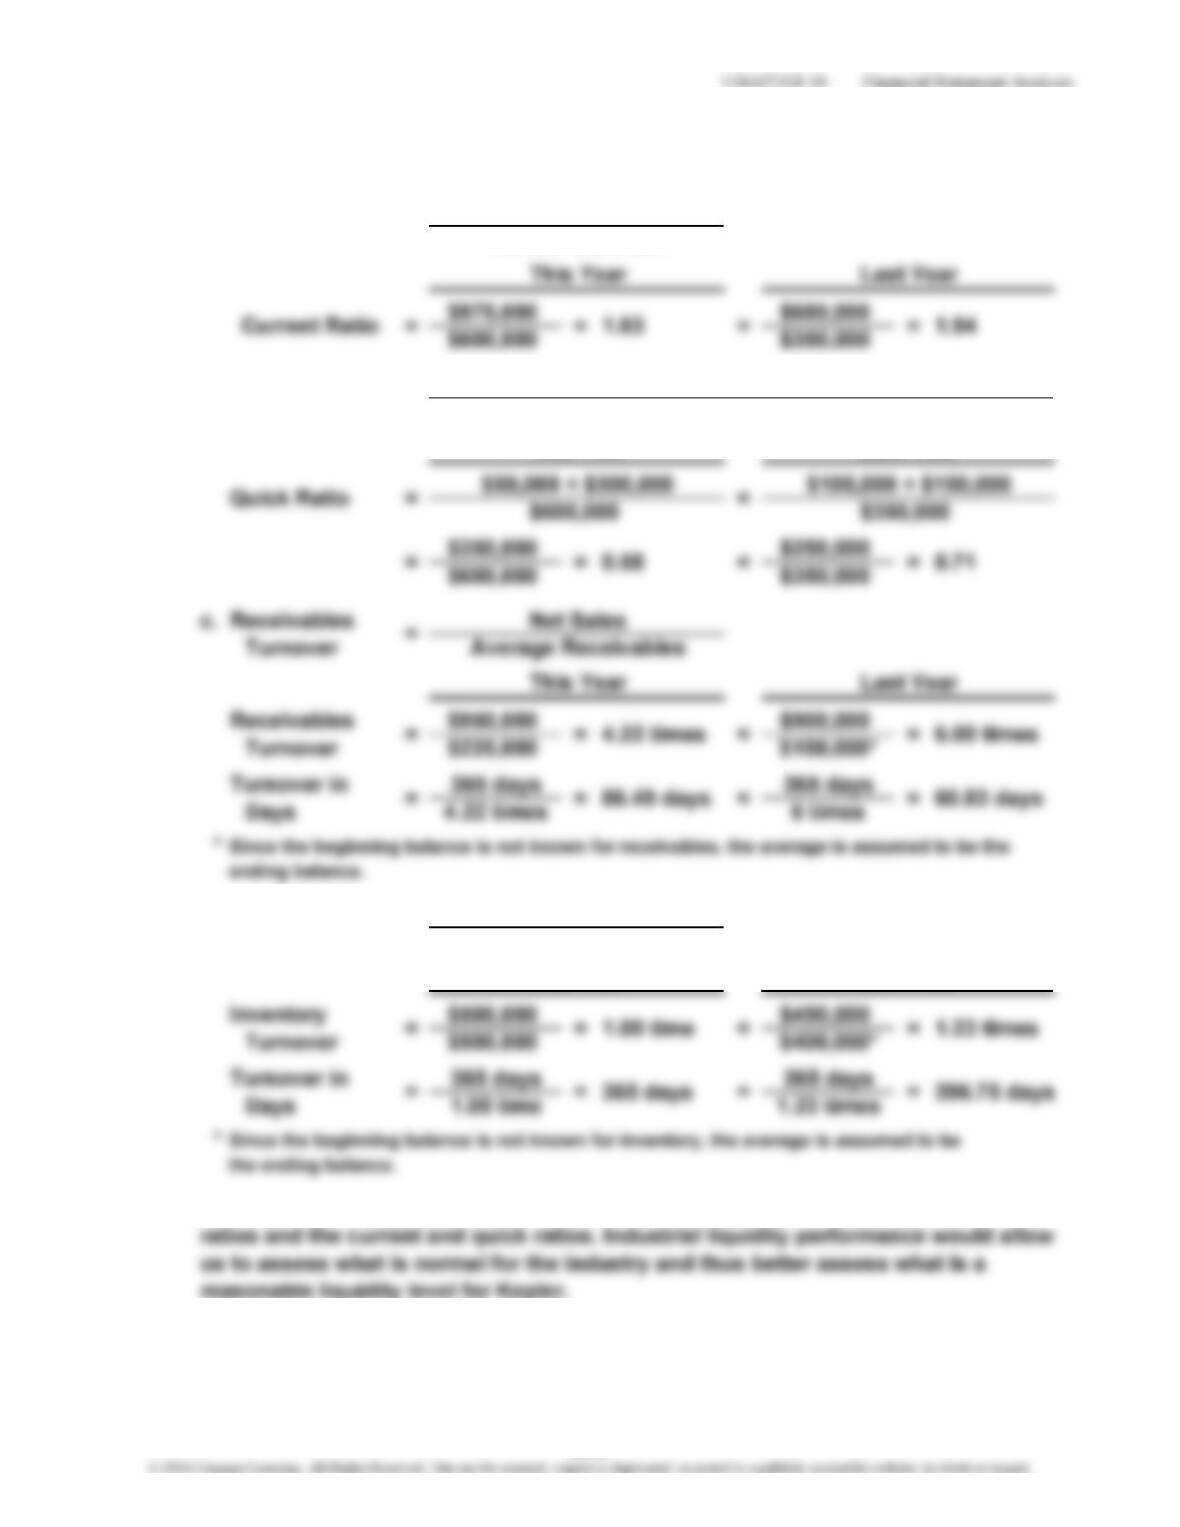
P 16-48
r
r
r
r
d. Inventory
Turnover
2. The liquidity of Kepler has declined over the past year as measured by the turnover
a.
b.
1.
Current Assets
Current Ratio
This Yea
r
Last Yea
r
Last Yea
r
Cost of Goods Sold
Average Inventory
=
=
Current Liabilities
Quick Ratio
Cash + Marketable Securities + Accounts Receivable
Current Liabilities
=
This Yea
r
16-27
CHAPTER 16 Financial Statement Analysis
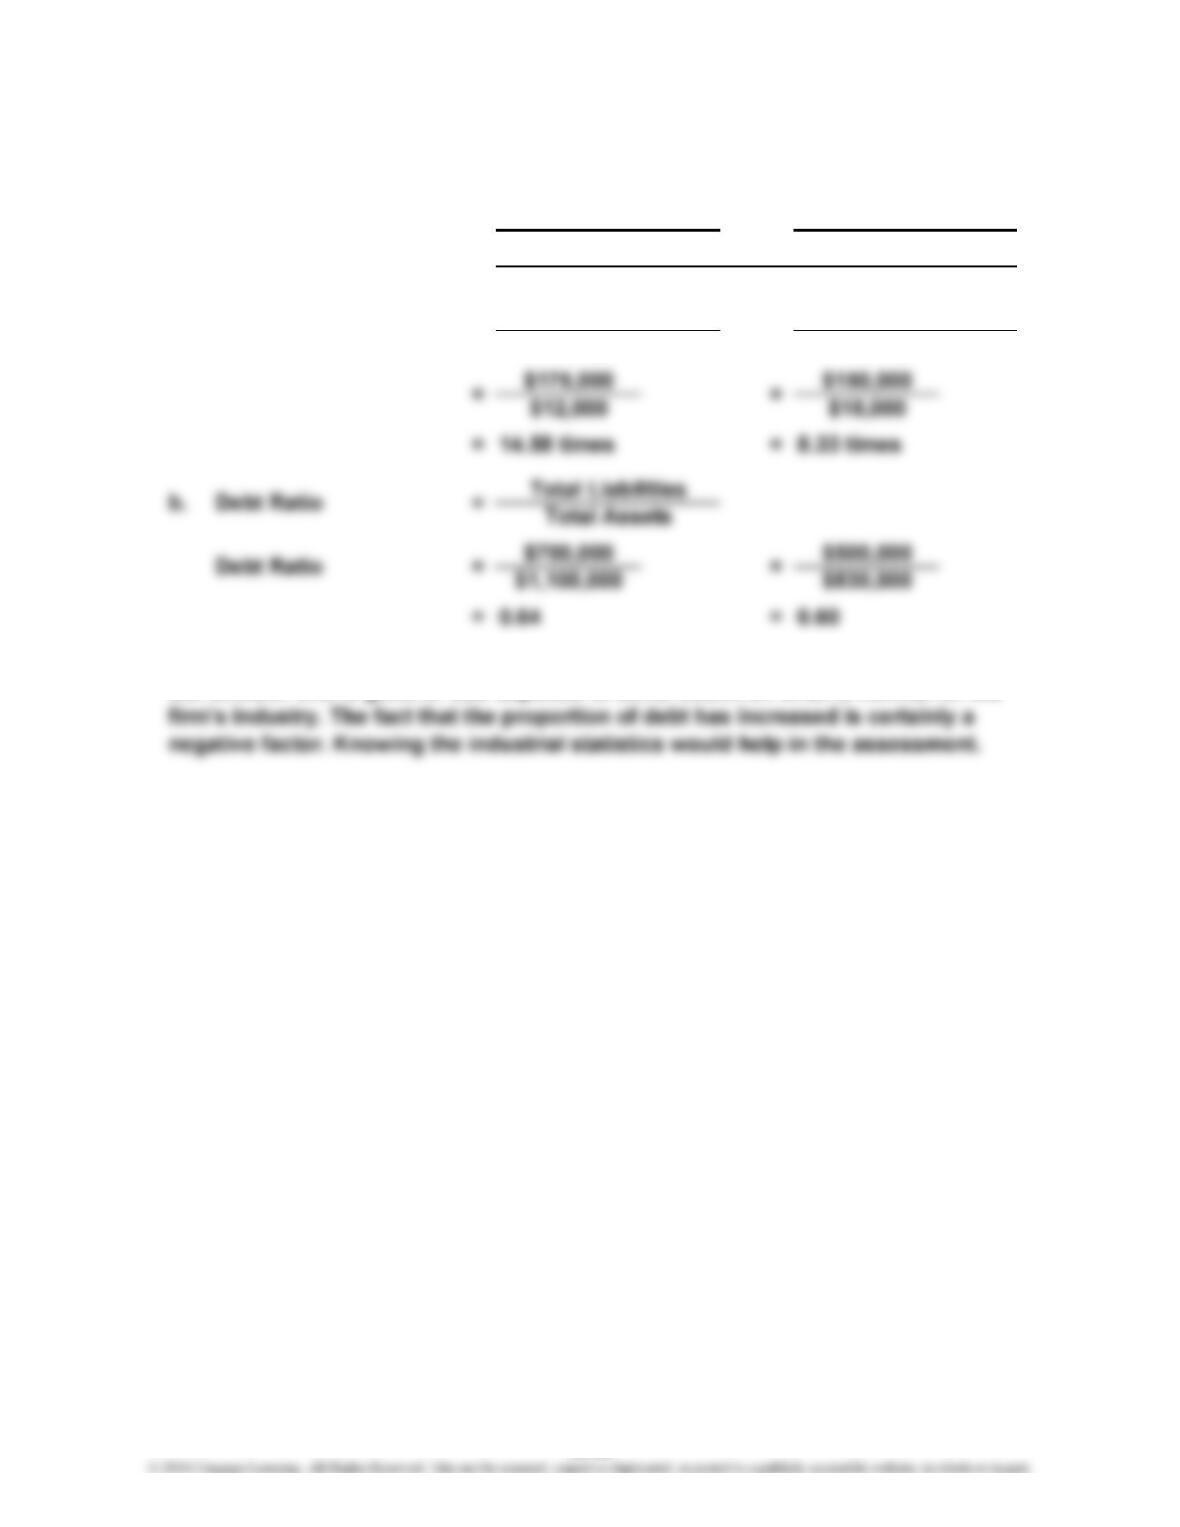
P 16-49
1. a. Times-Interest-Earned
Ratio
Times-Interest-Earned
Ratio
2. There appears to be good income coverage of interest. The debt ratio is over 50%,
but whether this is good or bad depends to some extent on what is normal for the
This Year
Interest Expense
$132,000 + $18,000
$18,000
=
=
Income Before Taxes + Interest Expense
$12,000
=
$163,000 + $12,000
Last Year
16-28
CHAPTER 16 Financial Statement Analysis
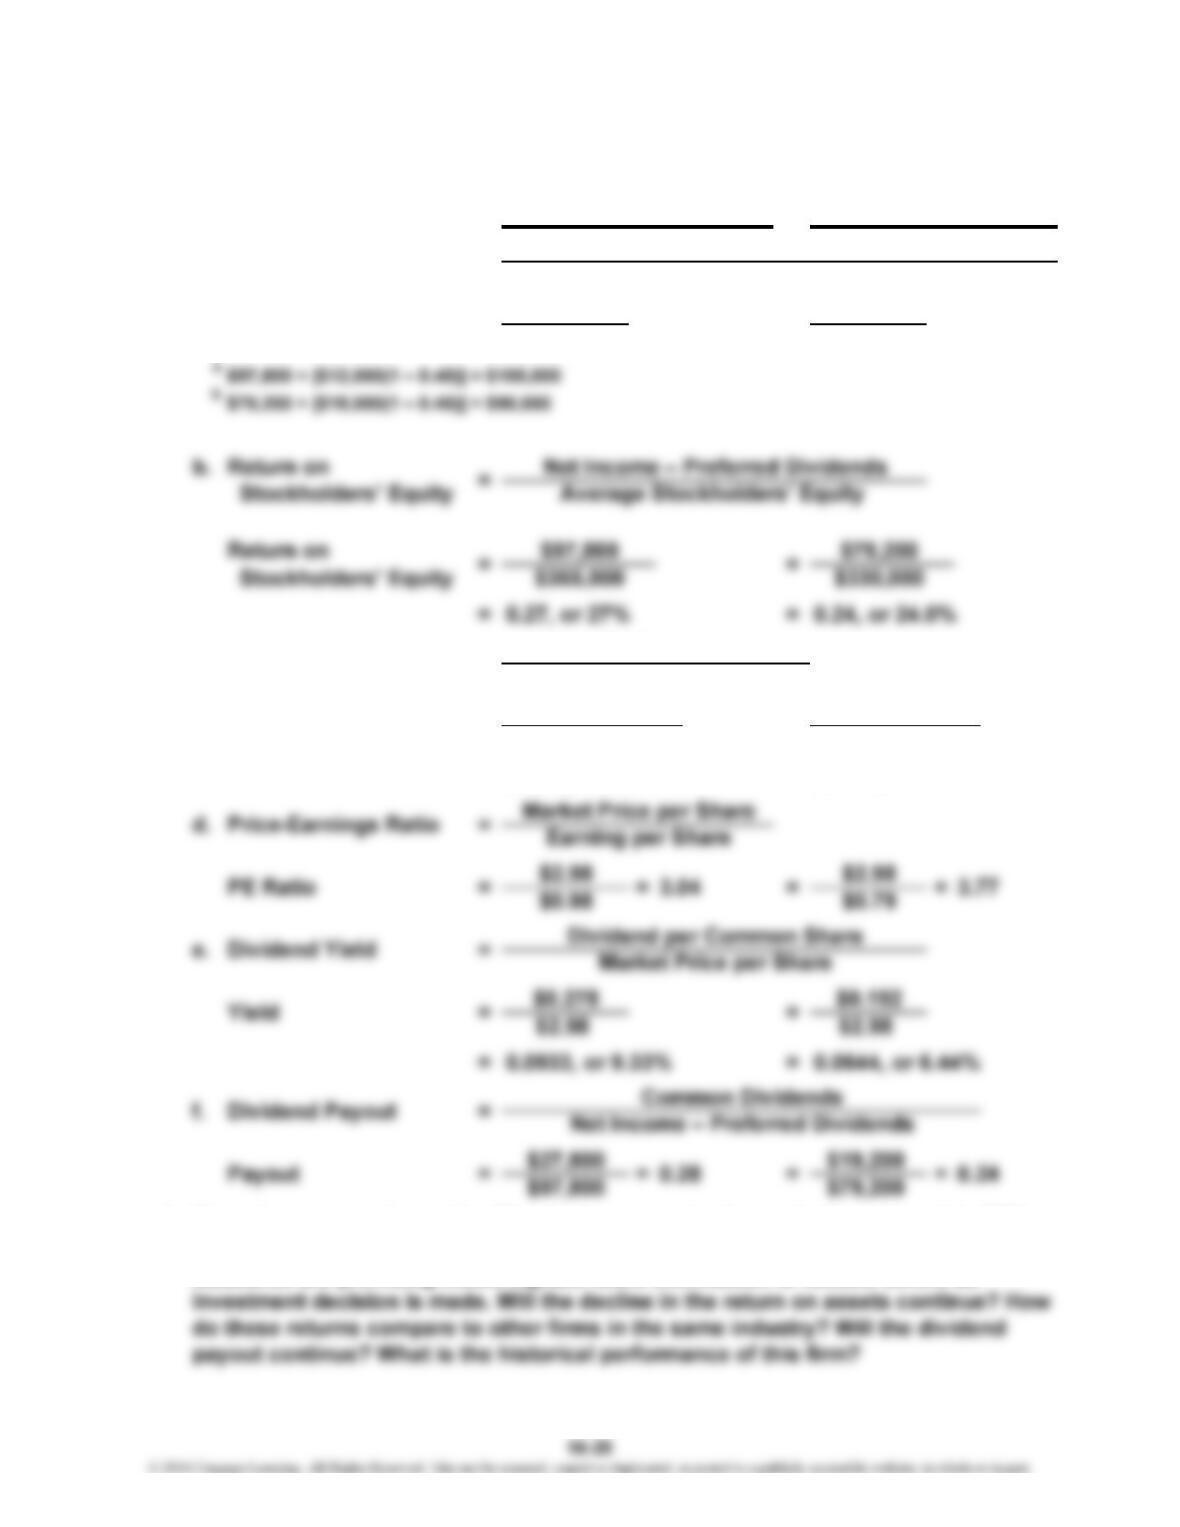
P 16-50
$105,000 $90,000
$965,000 $830,000
= = $0.79 per share
2. The return on assets and the PE ratio have remained roughly the same while EPS,
return on equity, yield, and payout measures have increased. Thus, the profitability
measures are providing mixed signals. More information is needed before an
$79,200
100,000 shares
Last Yea
r
This Yea
r
Net Income + [Interest Expense(1 – Tax Rate)]
A
verage Total Assets
0.11===
=
==
$97,800
100,000 shares
$0.98 per share
Net Income
A
verage Common Shares
EPS
Earnings per Sharec.
1.
0.11Return on Assets
Return on Assetsa. =
=
ab
A
P 16-51
1.
c. Return on Stockholders’
Equity
A
verage Stockholders’ Equity
A
$55,000
Net Income
Sales
$10,500
A
$100,000
0.185, or 18.5%
$55,000
$10,200
Net Income – Preferred Dividends
41.38
==
$0.29
$12.00
a.
0.7843
Return on Sales
$8,000
$10,500 – $300
2
e.
PE Ratio
Dividend Payout Ratiog.
=
Income – Preferred Dividends
Common Dividends
==
=
Earning per Share
Market Price per Share
=
==
$10,500 – $300
=
0.105, or 10.5%
==
=
16-30
CHAPTER 16 Financial Statement Analysis
P 16-51 (Continued)
2. Since all the ratios are profitability ratios, they should all be of interest to investors.
P 16-52
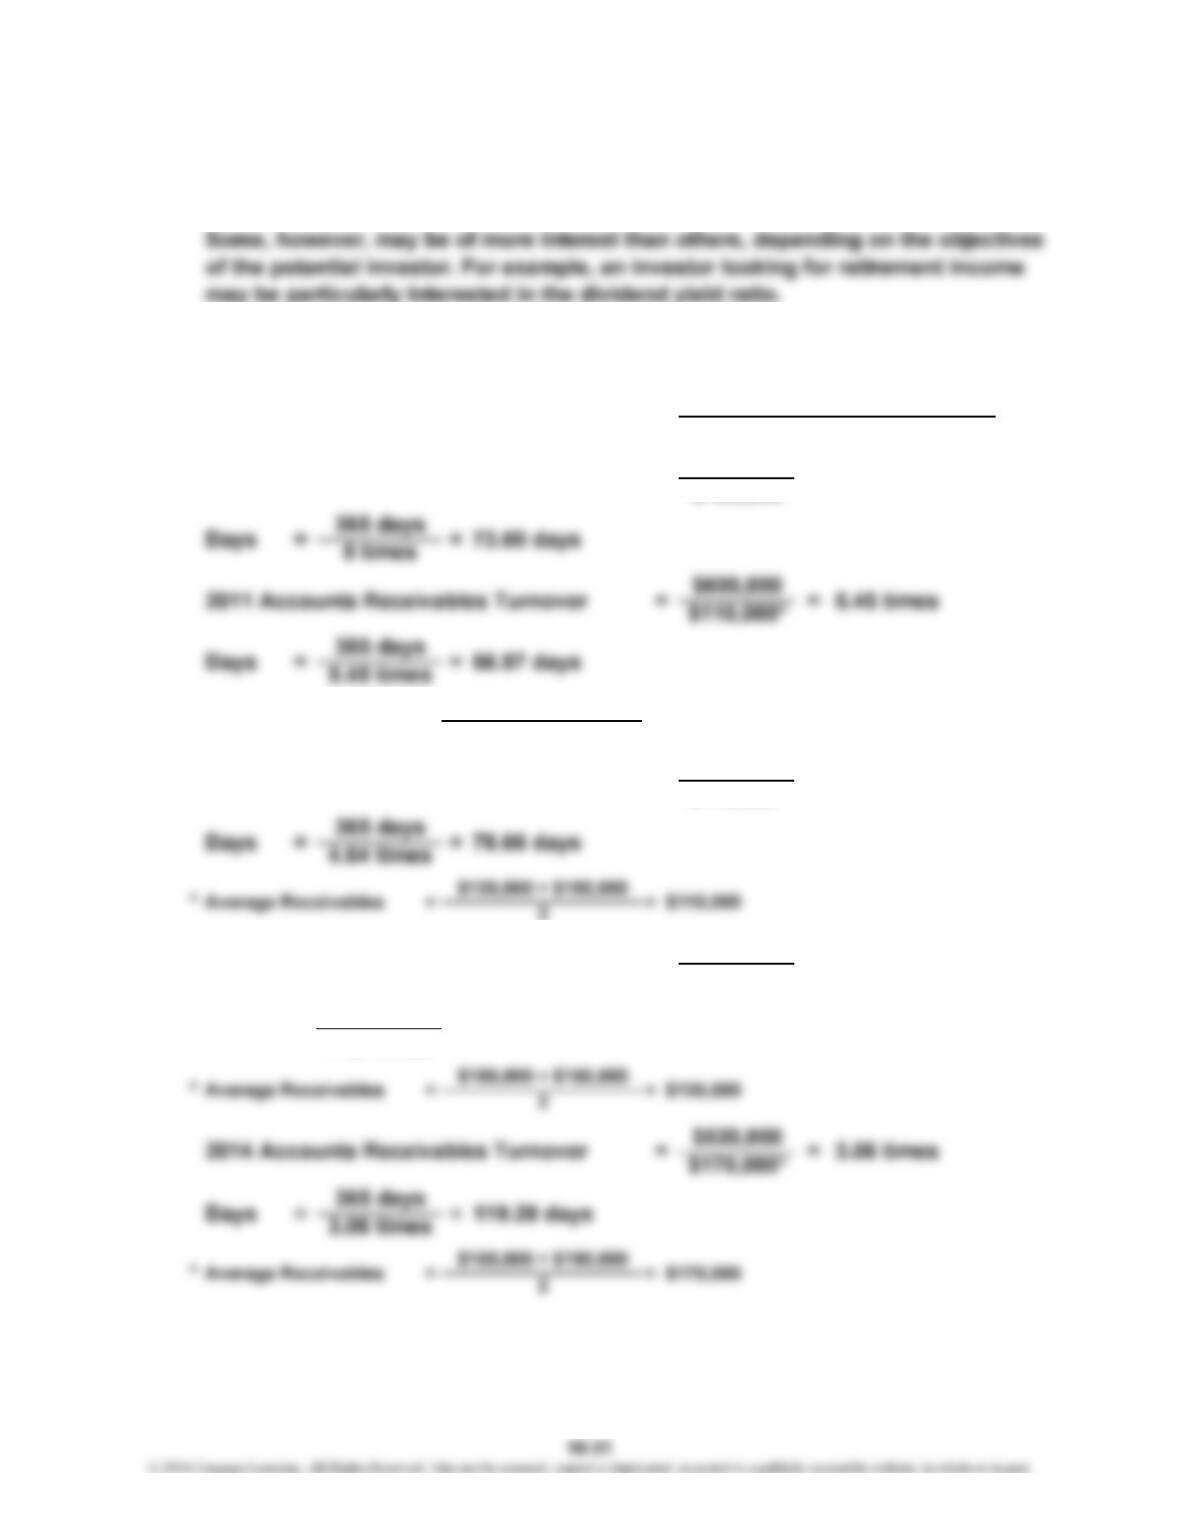
$510,000
$125,000* 4.08 times
==
365 days
4.08 times
$100,000 + $120,000
2
= 4.64 times
Net Sales
A
verage Receivables
$100,000
5.00 times
$500,000
==
$510,000
$110,000*
2012 Accounts Receivables Turnover
2013 Accounts Receivables Turnover
2
Accounts Receivables Turnover
2010 Accounts Receivables Turnover
1.
Average Receivables = $110,000
=
Days =
*
89.46 days=
=
=
CHAPTER 16 Financial Statement Analysis
P 16-52 (Continued)
2. The new credit policy reduced the accounts receivable turnover because of the
3. If Ted Pendleton had known that the industry had an average receivables turnover
CHAPTER 16 Financial Statement Analysis
P 16-53
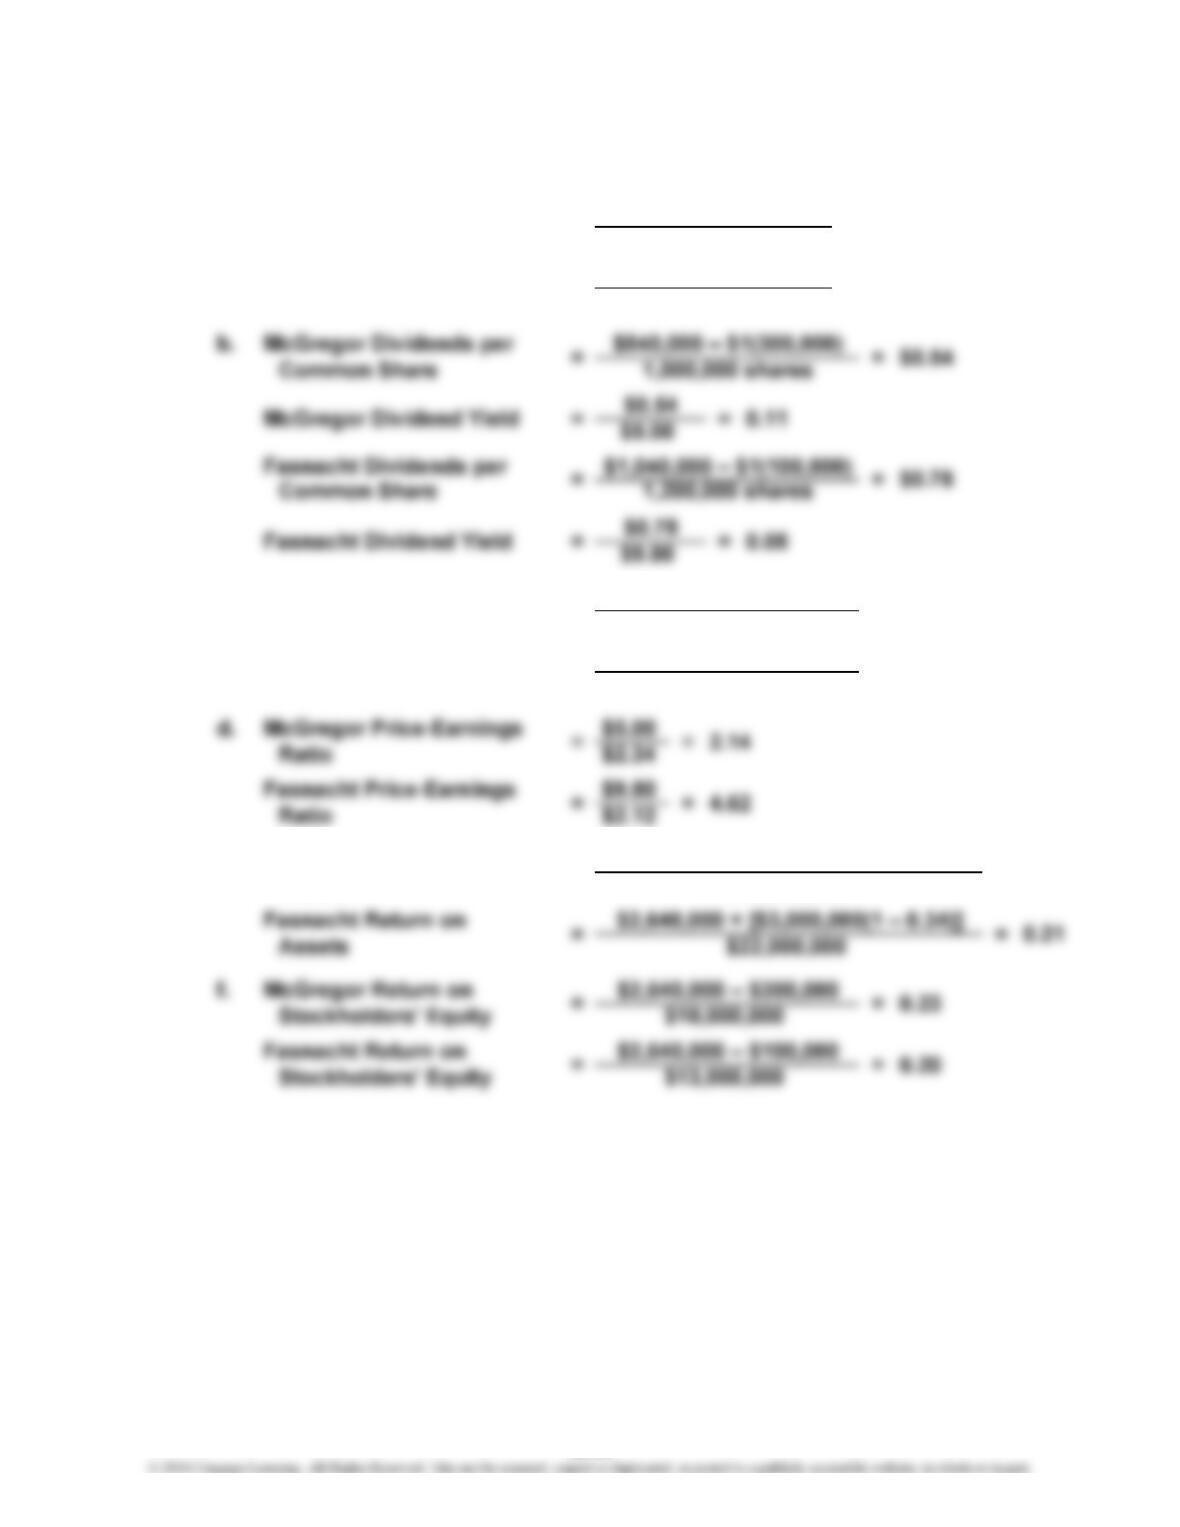
c. McGregor Dividend
Payout Ratio
Fasnacht Dividend
Payout Ratio
e. McGregor Return on
Assets
2. Fasnacht dominates on every profitability measure except the EPS, dividend
yield ratio, and return on equity. If this pattern is expected to persist in the
future, Fasnacht appears to be the better investment.
0.17=
$2,640,000 – $100,000
$940,000 =
$2,640,000 + [$1,000,000(1 – 0.34)]
$20,000,000
$540,000
$2,640,000 – $300,000
=
=
=
=
$2,640,000 – $300,000
1,000,000 shares
$2,640,000 – $100,000
1,200,000 shares
=
=
$2.34 per share
$2.12 per share
=
0.23
0.37
=
1.
Fasnacht EPS
McGregor EPSa.
16-33
CHAPTER 16 Financial Statement Analysis
Case 16-54
1. Pete Donaldson’s behavior is not ethical. Hiding a loan and obsolete safety
2. a. First, consult with Pete Donaldson and tell him that you cannot prepare the
the statements in the way he has requested and explain why. If he insists on
their preparation following his classification, then resignation is called for. To
b. First, Pete Donaldson should be approached. He should be requested to
withdraw the loan request or provide corrected financial statements. Should
he refuse, then the ethical dilemma has been significantly compounded.
3. One possible solution is to approach the father-in-law who gave the loan originally
and offer part ownership in the company. The loan could then legitimately be
Case 16-55
Answers will vary. Note to Instructors: You can easily turn this into a group exercise
CASES