CHAPTER 10
INVESTMENT RETURNS AND AGGREGATE MEASURES OF STOCK MARKETS
Teaching Guides for Questions and Problems in the Text
QUESTIONS
10-1. A value-weighted average of stock prices considers not only the price of the stock
but also the total value of all shares (i.e., the number of shares outstanding times the price
of each share). If a firm has a large number of shares outstanding, the value of these shares
10-2. The Dow Jones industrial average includes the prices of only thirty companies and is
a simple average. The S&P 500 stock index is more broad-based (500 stocks) and is a
value-weighted average which gives more weight to the stocks with the largest
10-3. Averaging positive returns and negative returns may produce inaccurate measures of
rates of return. This is the result of (1) the mathematical fact that the maximum possible
loss is 100 percent of the amount invested but gains can exceed 100 percent and (2) the
10-4. The historic return depends on the time period selected and what securities are
included. The Ibbotson Associates studies have found that, over a period of years, common
stocks tended to earn approximately 10 percent annually. Rates of return achieved by
10-5. Semi-log graphs are used to show stock prices because they express price
movements in percentage changes and not absolute numbers. A movement from $40 to $60
10-6. Averaging down is purchasing more stock after its price has declined. Dollar-cost
averaging is periodically making the same dollar purchases of a security irrespective of its
price. Such purchases lower the average cost per share if more shares are acquired when
the price declines than after a price increase.
While dollar-cost averaging may result in a lower average cost (if the price of the stock
were to fall), it is an excellent strategy (especially for individuals who have difficulty
saving) for accumulating shares. This strategy may be accomplished through dividend
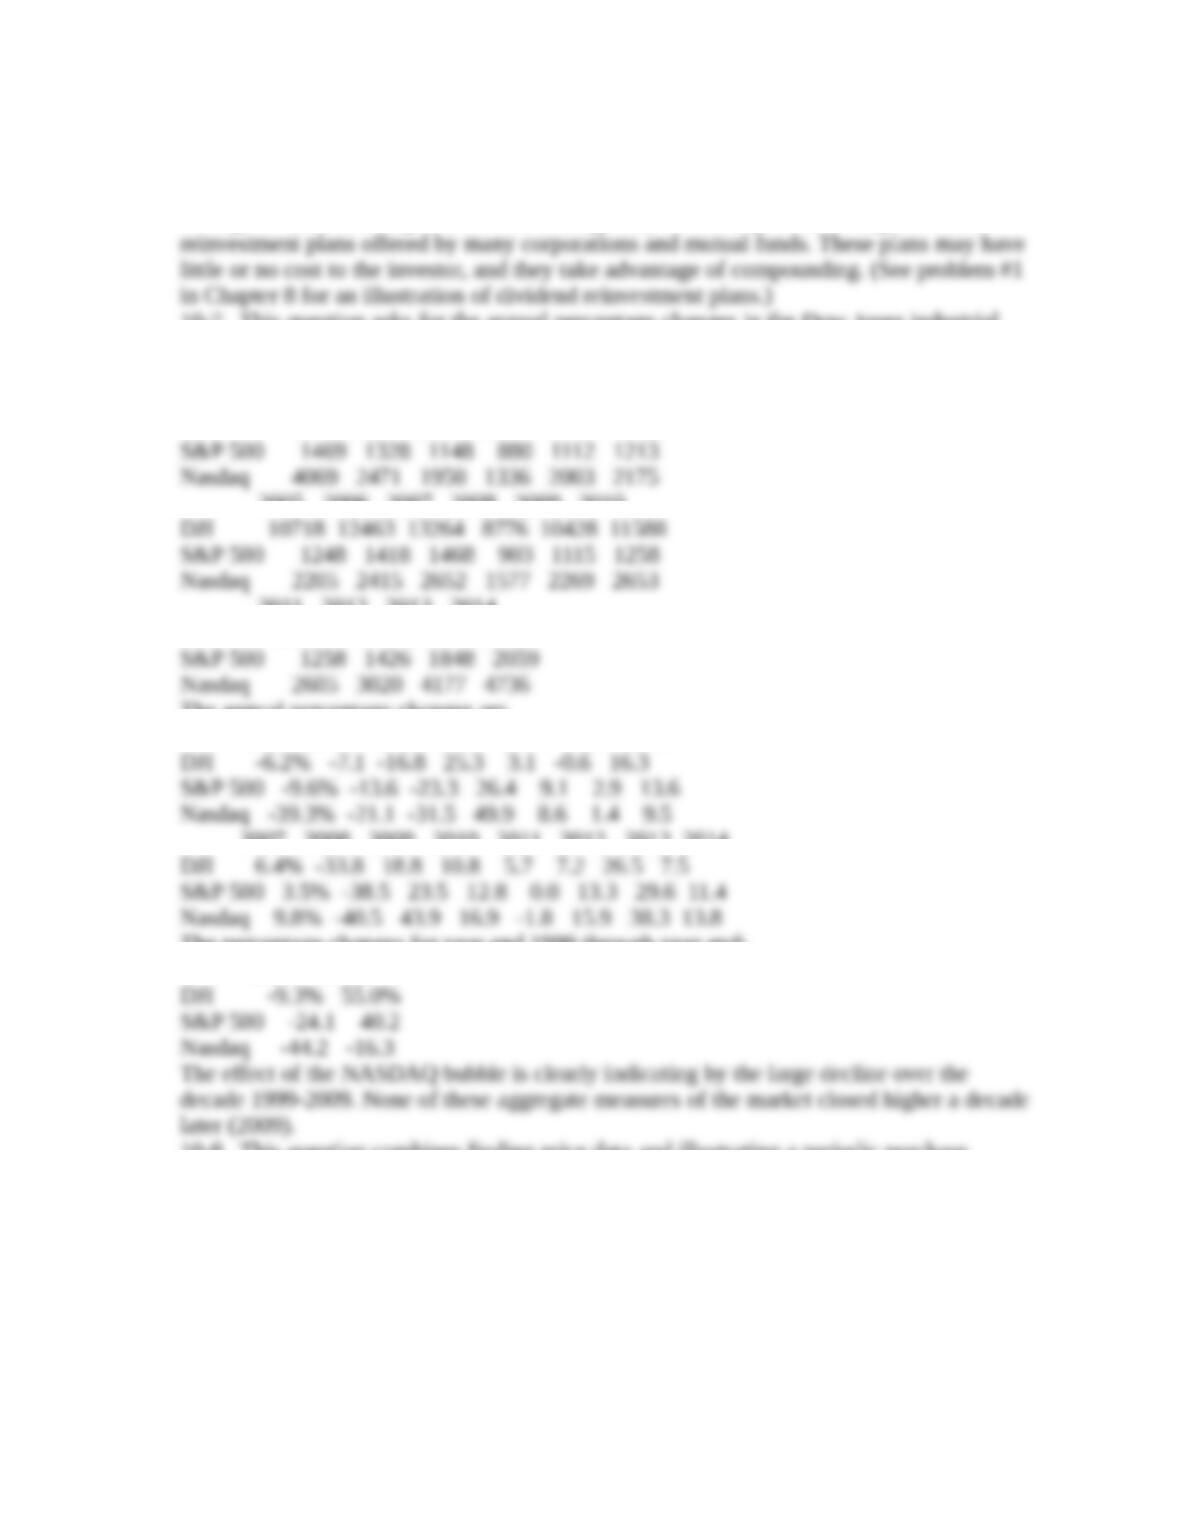
10-7. This question asks for the annual percentage changes in the Dow Jones industrial
average, the S&P 500 stock index, and Nasdaq index for the years after 1998. The closing
values for 1999-2014 are as follows:
1999 2000 2001 2002 2003 2004
DJI 11497 10787 10022 8342 10454 10783
2005 2006 2007 2008 2009 2010
2011 2012 2013 2014
DJI 12218 13104 16577 17823
The annual percentage changes are
2000 2001 2002 2003 2004 2005 2006
2007 2008 2009 2010 2011 2012 2013 2014
The percentage changes for year end 1999 through year end:
2009 2014
10-8. This question combines finding price data and illustrating a periodic purchase
strategy that is independent of the stock’s price. The following table provides the price of
IBM stock, the number of shares purchase, the value of the positions, and the total loss or
gain at the end of each quarter.
Quarter Closing Shares Total Value Total Gain or
price purchased shares Cost (loss)
($1000/Price)
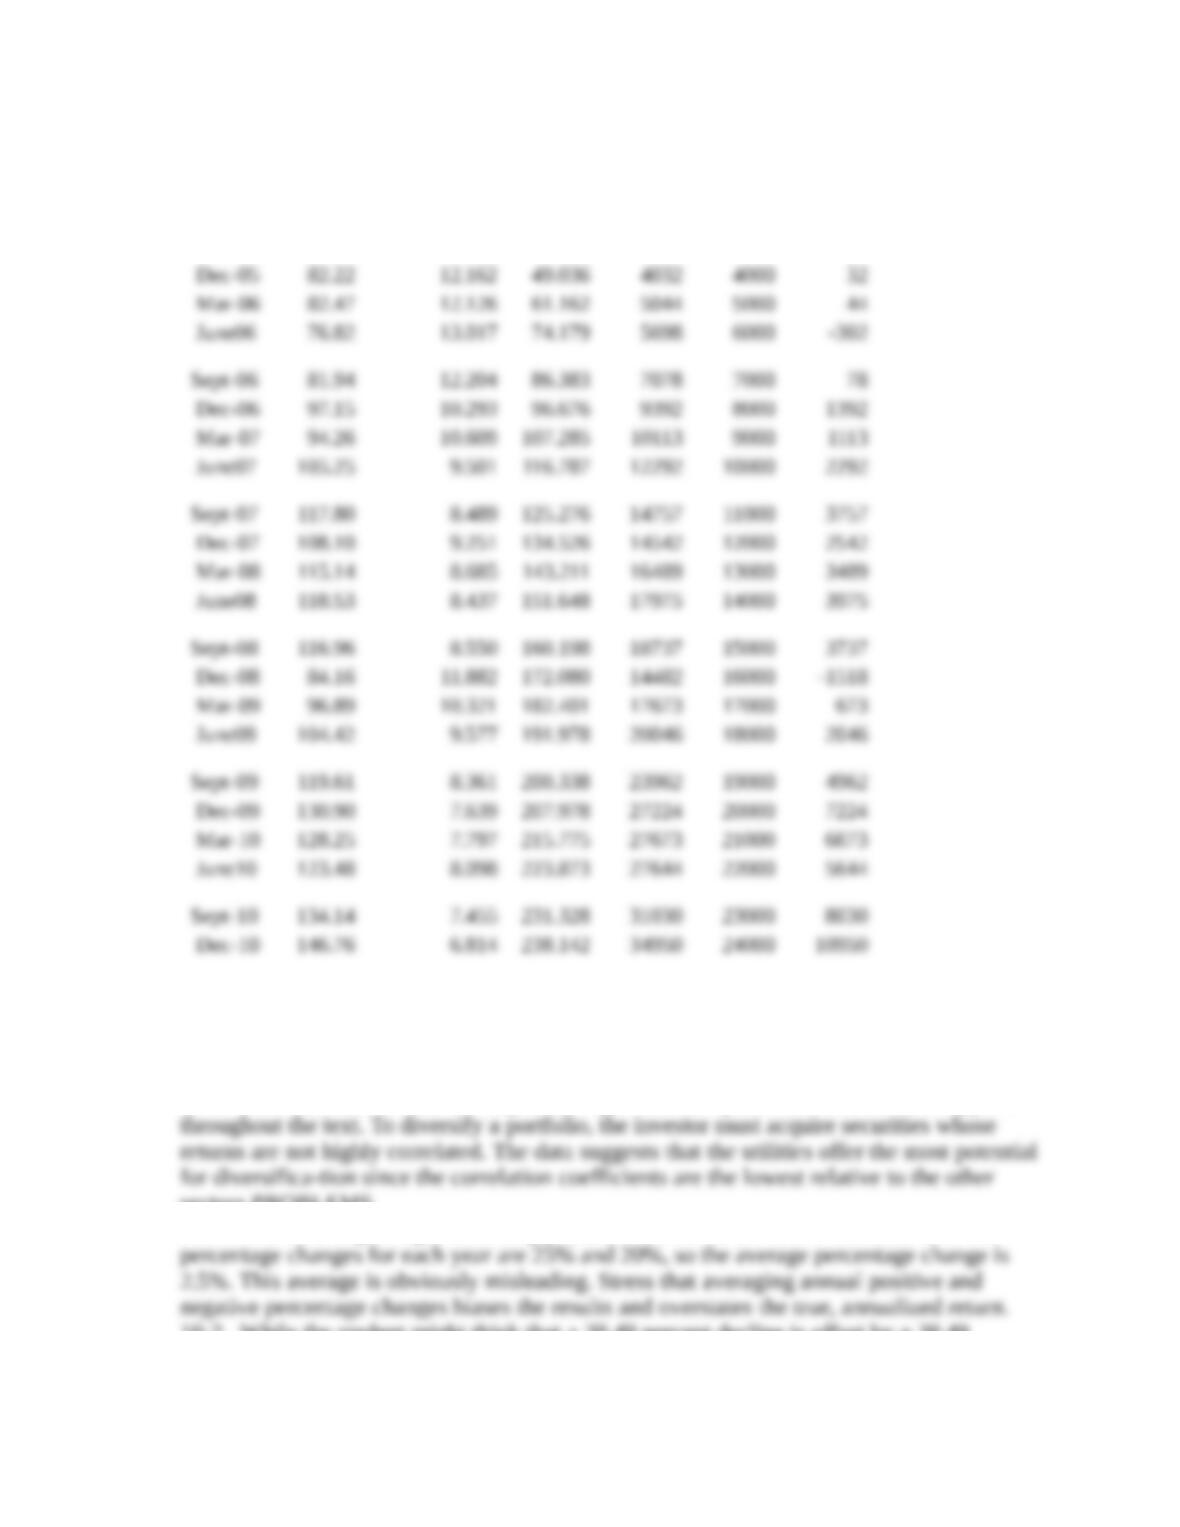
Mar-05 91.36 10.946 10.946 1000 1000 0
June05 74.30 13.459 24.405 1813 2000 -187
Sept-05 80.20 12.469 36.873 2957 3000 -43
As of January 2015, IBM was selling for $161; 238.142 shares were worth $38,341. Point
out that the value of the shares does not consider any reinvestment of dividends which
would increase the number of share and the total value of the position. Such an increase
argues in favor of the strategy.
10-9. Diversification is such an important topic that this question in some form reappears
sectors.PROBLEMS
10-1. Since the beginning and closing prices are the same, the return has to be 0%. The
10-2. While the student might think that a 38.49 percent decline is offset by a 38.49
percent gain, that is not the case. If you start with an average of 100, a 38.49 percent
This is an important question. The media may report that after declining 30 percent, the
market rose 30 percent. Many people may conclude that the loss has been recouped, which
is certainly an incorrect conclusion.
10-3. This problem continues the previous two questions. The true annualized return is
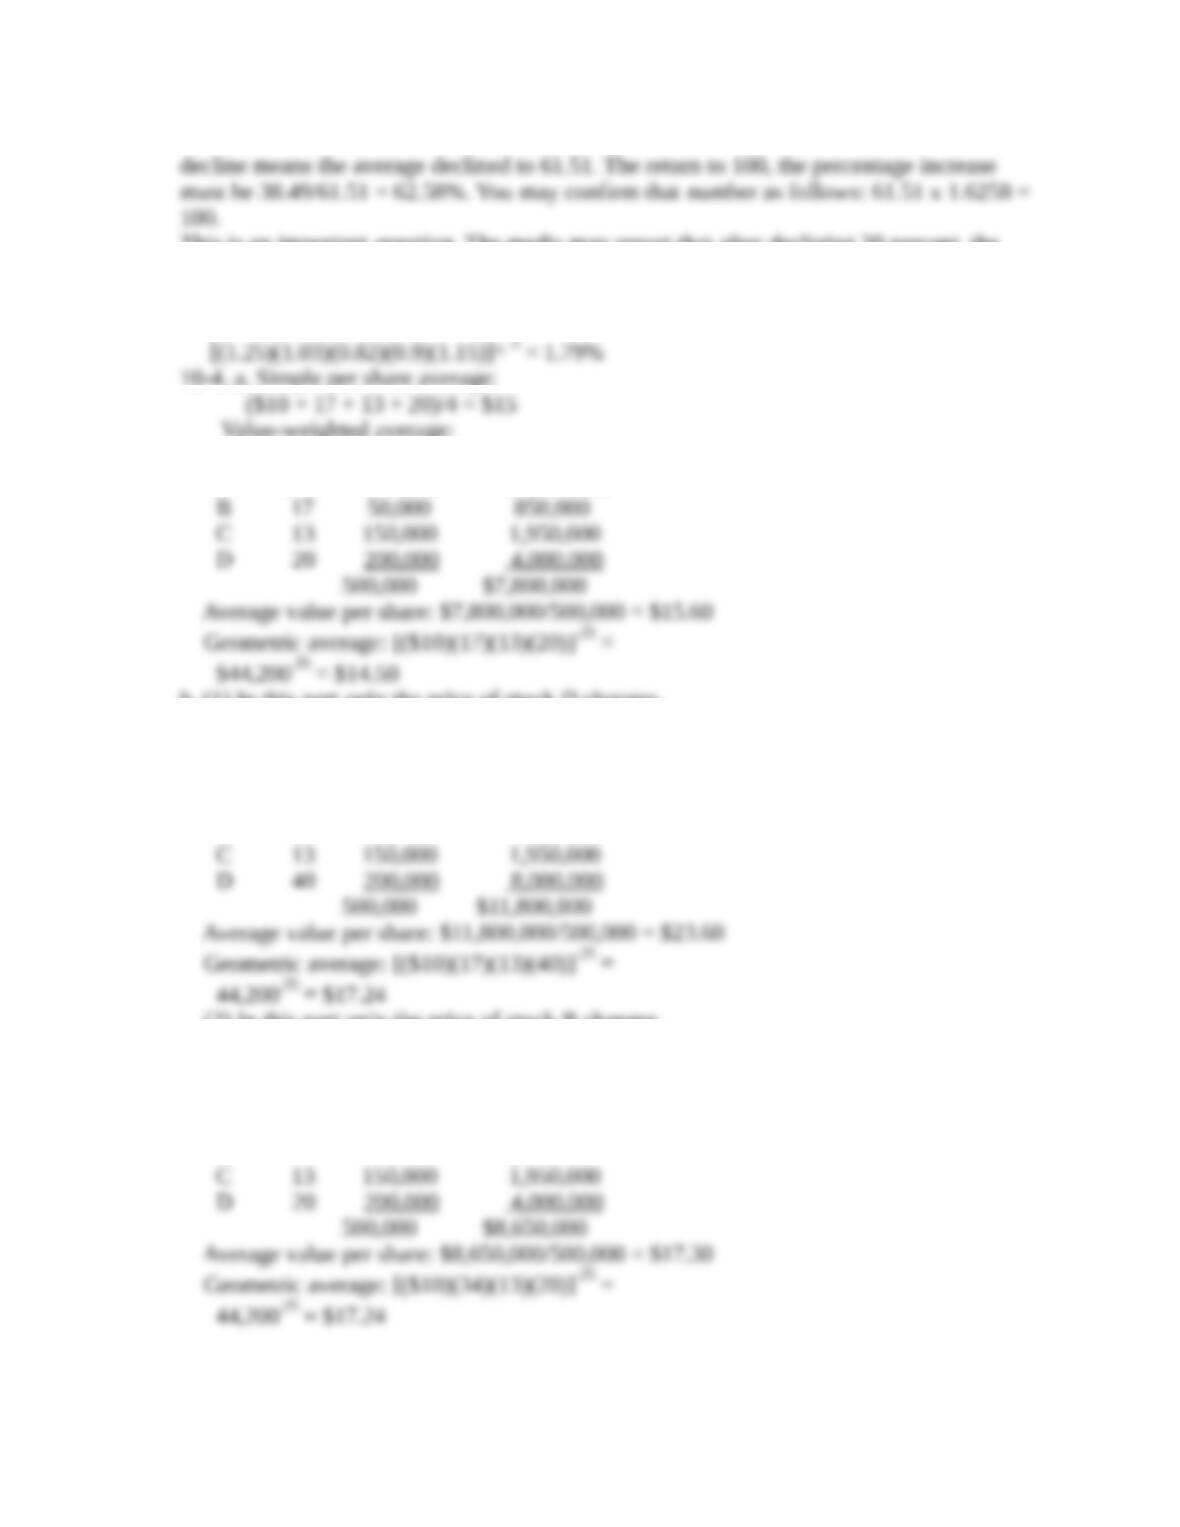
10-4. a. Simple per share average:
Value-weighted average:
Stock Price Number of Shares Total Value
A $10 100,000 $1,000,000
b. (1) In this part only the price of stock D changes.
The simple per share average: ($10 + 17 + 13 + 40)/4 = $20
Value-weighted average:
Stock Price Number of Shares Total Value
A $10 100,000 $1,000,000
B 17 50,000 850,000
(2) In this part only the price of stock B changes.
The simple average: ($10 + 34 + 13 + 20)/4 = $19.25
Value-weighted average:
Stock Price Number of Shares Total Value
A $10 100,000 $1,000,000
B 34 50,000 1,700,000
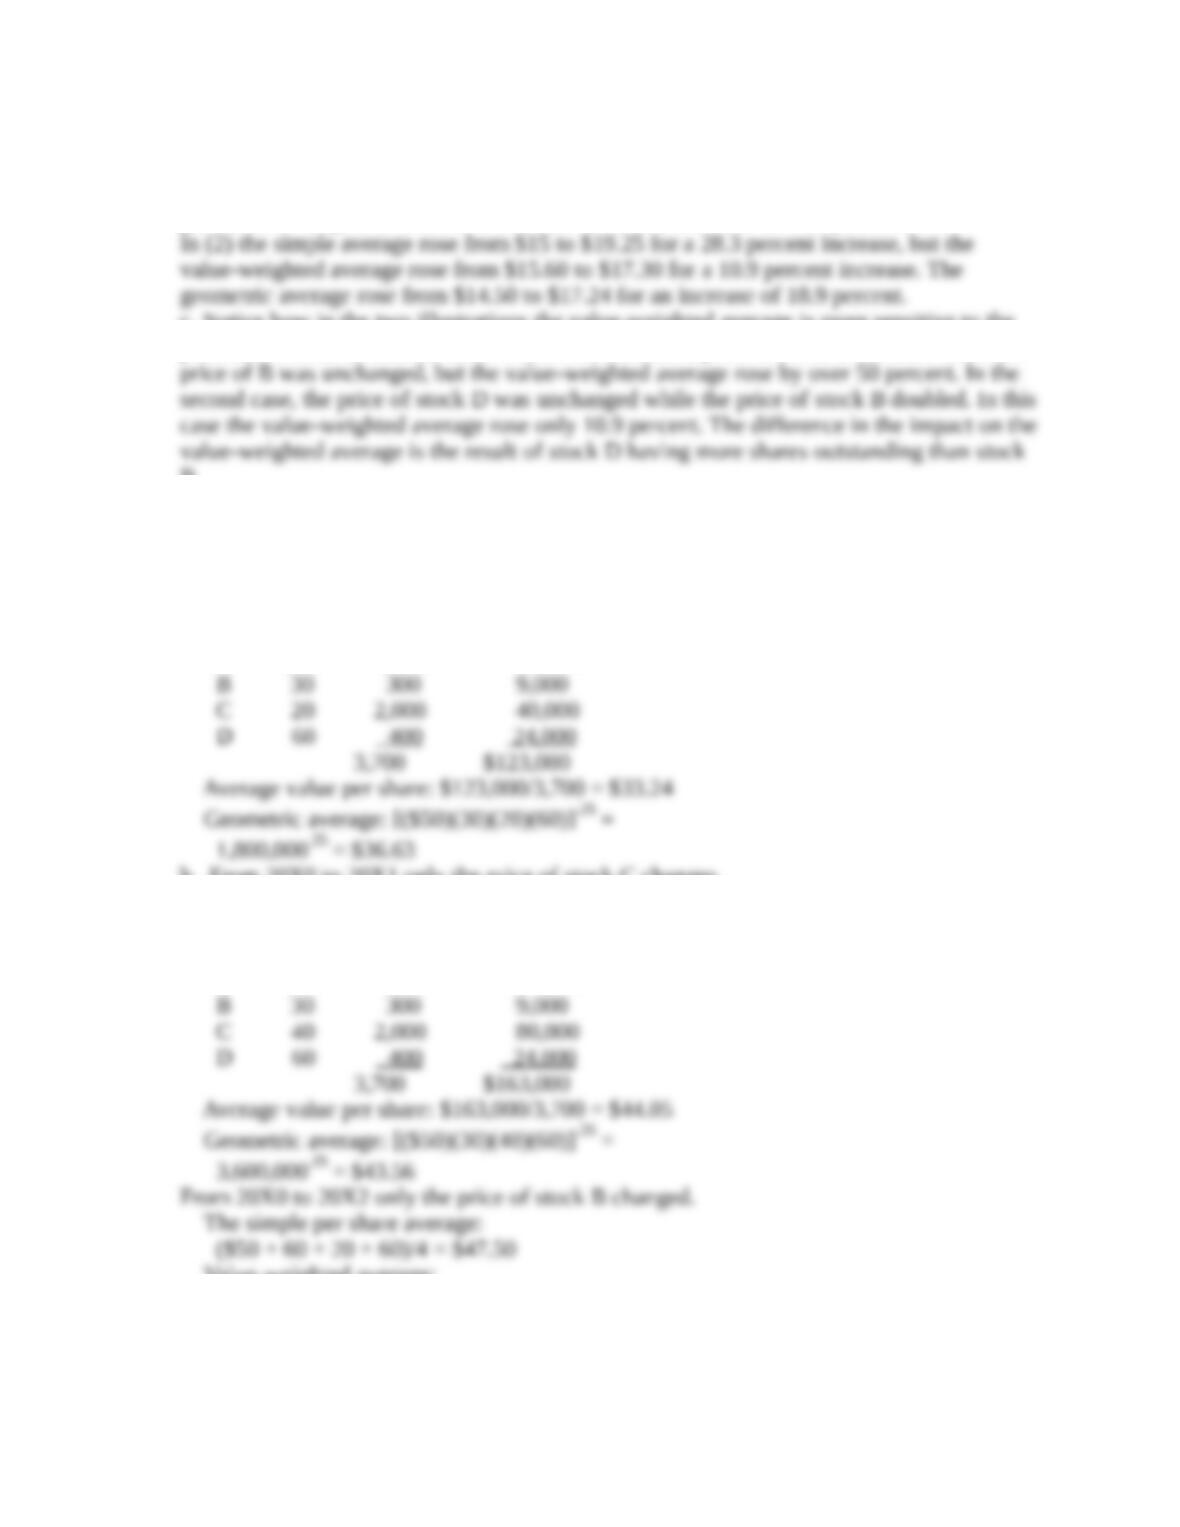
In (1) the simple average rose from $15 to $20 for a 33.3 percent increase, but the
value-weighted average rose from $15.60 to $23.60 for a 51.2 percent increase. The
geometric average rose from $14.50 to $17.24 for an increase of 18.9 percent.
c. Notice how in the two illustrations the value-weighted average is more sensitive to the
price movements of stock D than to B. In the first case, price of stock D doubled while the
B.
10-5. This problem repeats the previous problem. The simple average illustrates a Dow
Jones industrial type of average. The S&P 500 stock index uses a value-weighted approach,
and the Value Line uses a geometric average.
The simple per share average: ($50 + 30 + 20 + 60)/4 = $40
Value-weighted average:
Stock Price Number of Shares Total Value
A $50 1,000 $50,000
b. From 20X0 to 20X1 only the price of stock C changes.
The simple per share average: ($50 + 30 + 40 + 60)/4 = $45
Value-weighted average:
Stock Price Number of Shares Total Value
A $50 1,000 $50,000
Value-weighted average:
Stock Price Number of Shares Total Value
A $50 1,000 $50,000
B 60 300 18,000
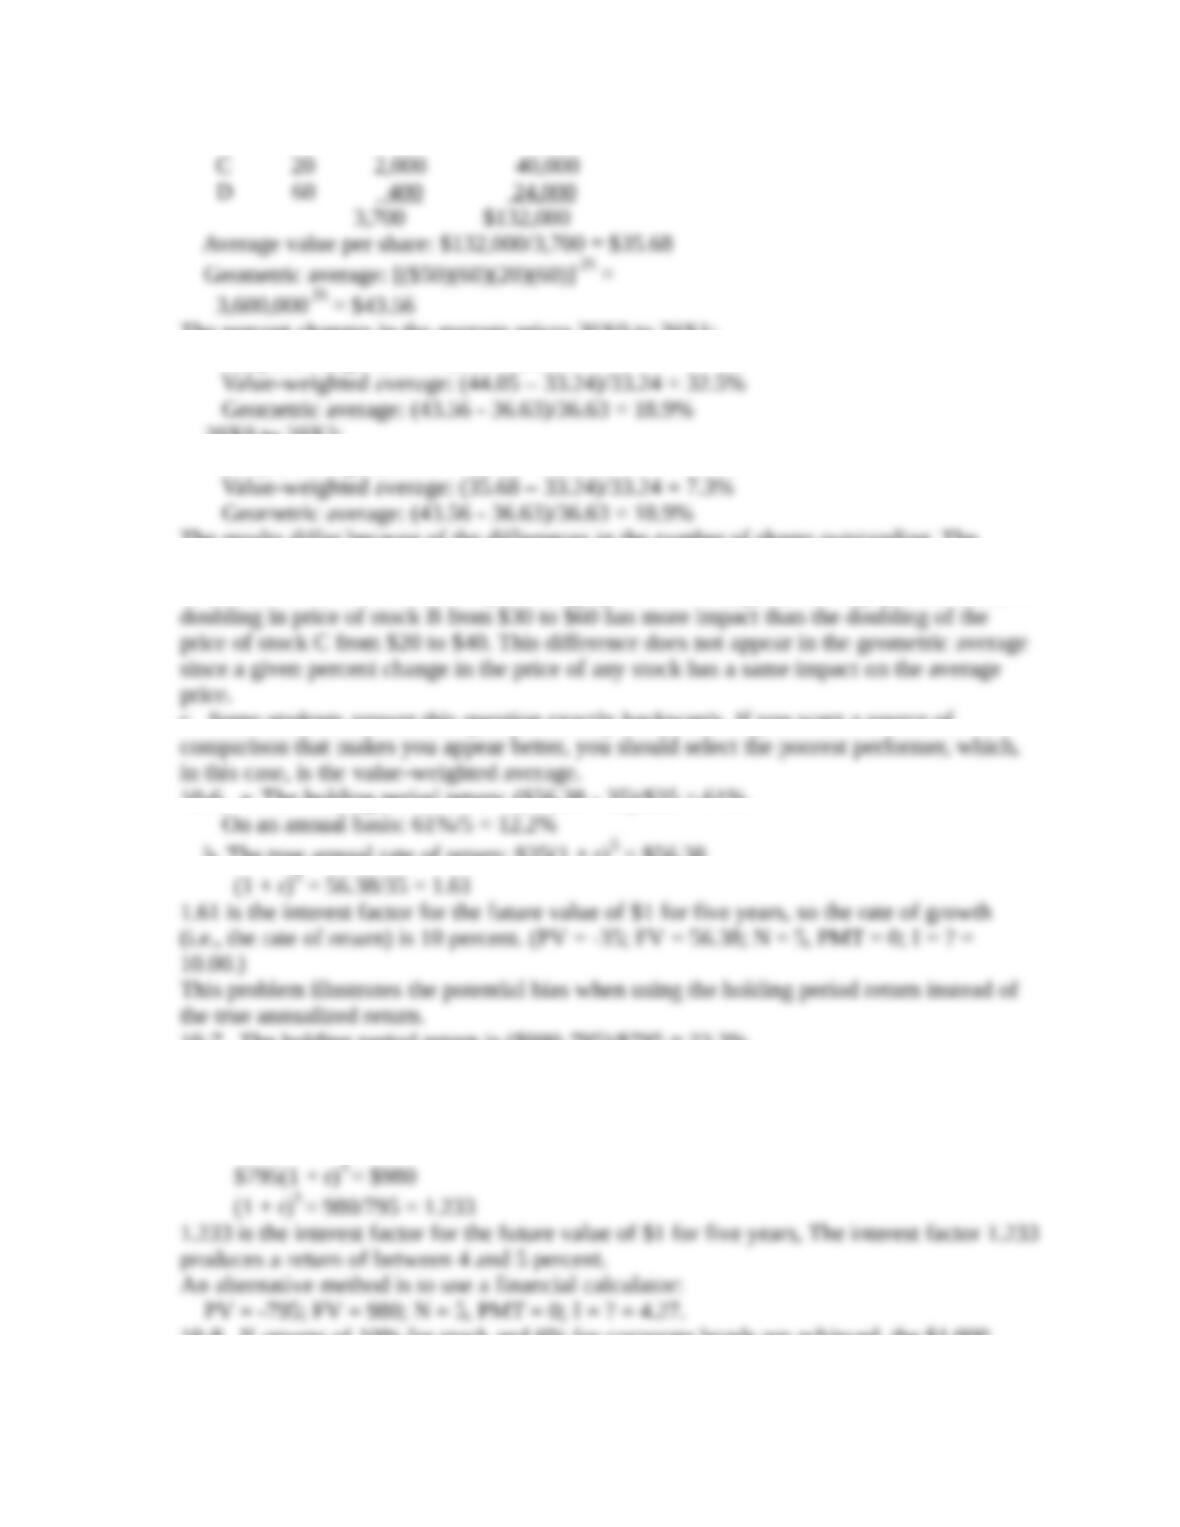
The percent changes in the average prices 20X0 to 20X1:
Simple average: (45 – 40)/40 = 12.5%
20X0 to 20X2:
Simple average: (47.50 – 40)/40 = 18.75%
The results differ because of the differences in the number of shares outstanding. The
value-weighted average gives more weight to the stock with the larger number of shares. It
should also be noted that the simple average gives more weight to the high priced stock, so
c. Some students answer this question exactly backwards. If you want a source of
10-6. a. The holding period return: ($56.38 – 35)/$35 = 61%.
b. The true annual rate of return: $35(1 + r)5 = $56.38
10-7. The holding period return is ($980-795)/$795 = 23.3%.
There are several methods to prove that the annualized return is not 23.3%. One possibility
it to use an interest table
The true annualized return is
10-8. If returns of 10% for stock and 6% for corporate bonds are achieved, the $1,000
invested in stock grows to $2,689.62.
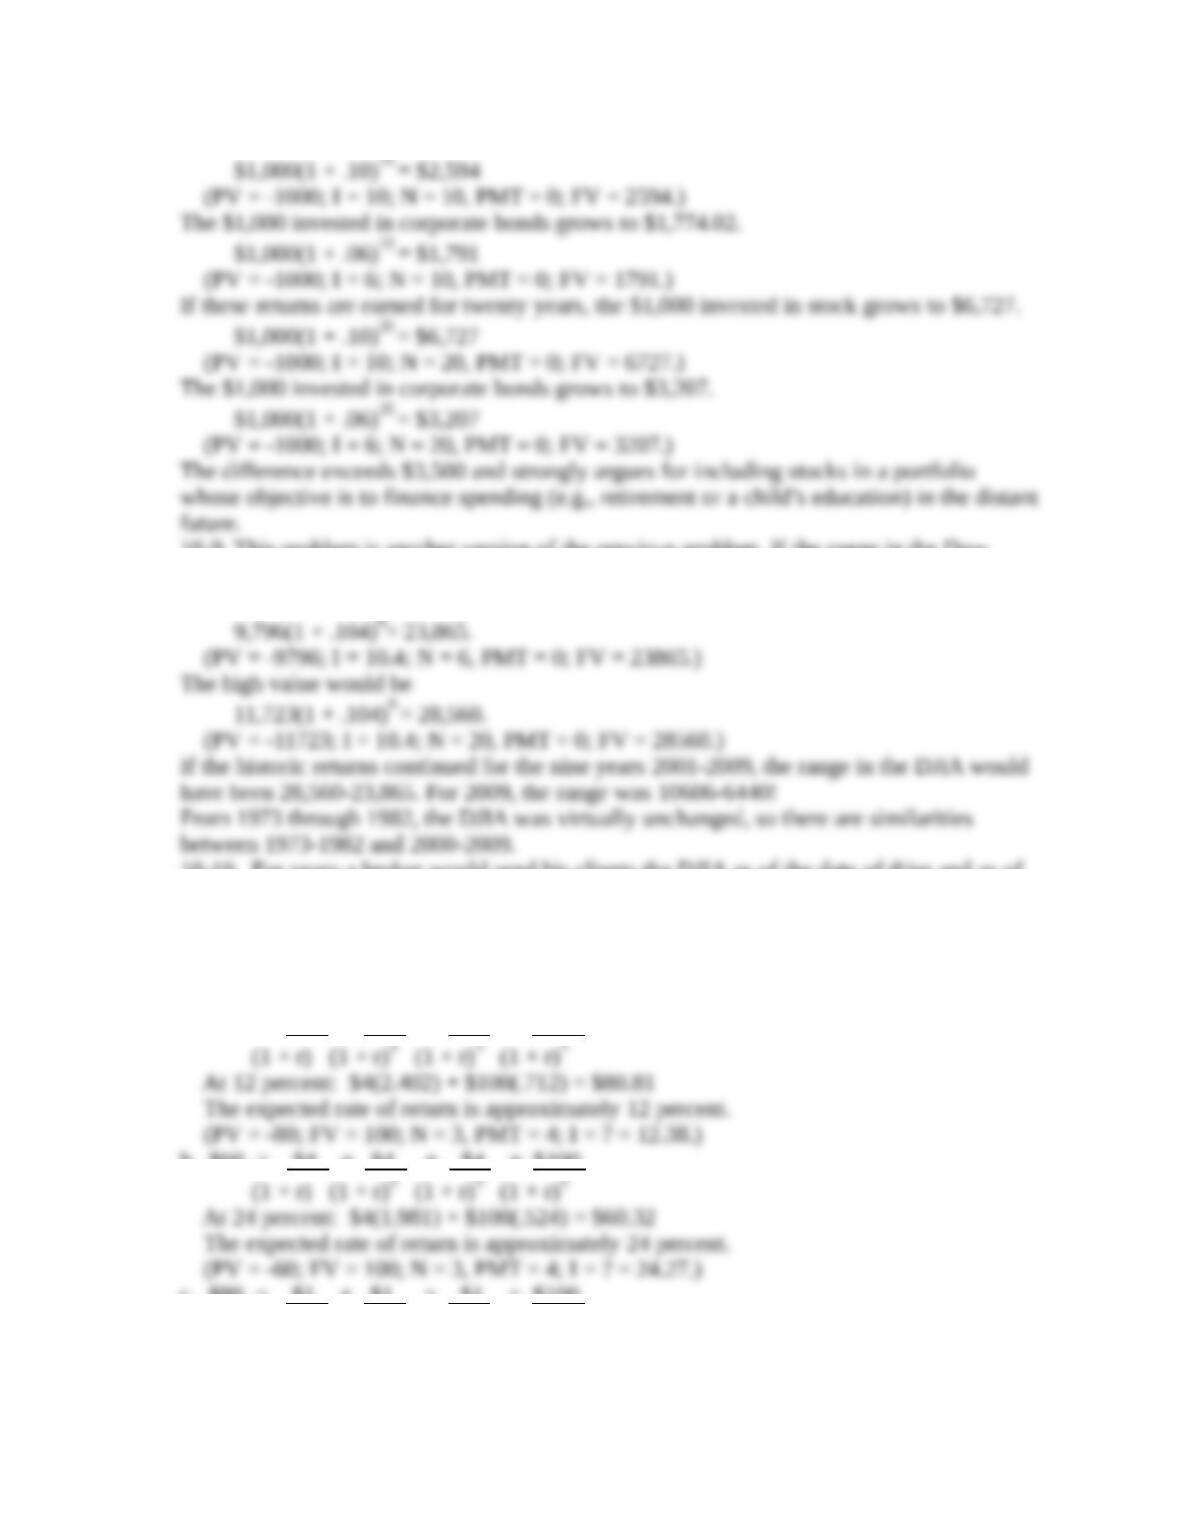
10-9. This problem is another version of the previous problem. If the range in the Dow
Jones Industrial Average grew annually at 10.4 percent for nine years, the low value would
be
10-10. For years a broker would send his clients the DJIA as of the date of thier and as of
their current birthday. Prior to the financial crisis, the annual rate of growth in the DJIA
plus a 2 percent dividend adjustment approximates 10 percent. Having your students do
this exercise, introduces them to finding the information and personalizes returns over time
for each student.
10-11.
a. $80 = $4 + $4 + $4 + $100
b. $60 = $4 + $4 + $4 + $100
c. $80 = $1 + $1 + $1 + $100
(1 + r) (1 + r)2 (1 + r)3 (1 + r)3
At 9 percent: $1(2.531) + $100(.772) = $79.73
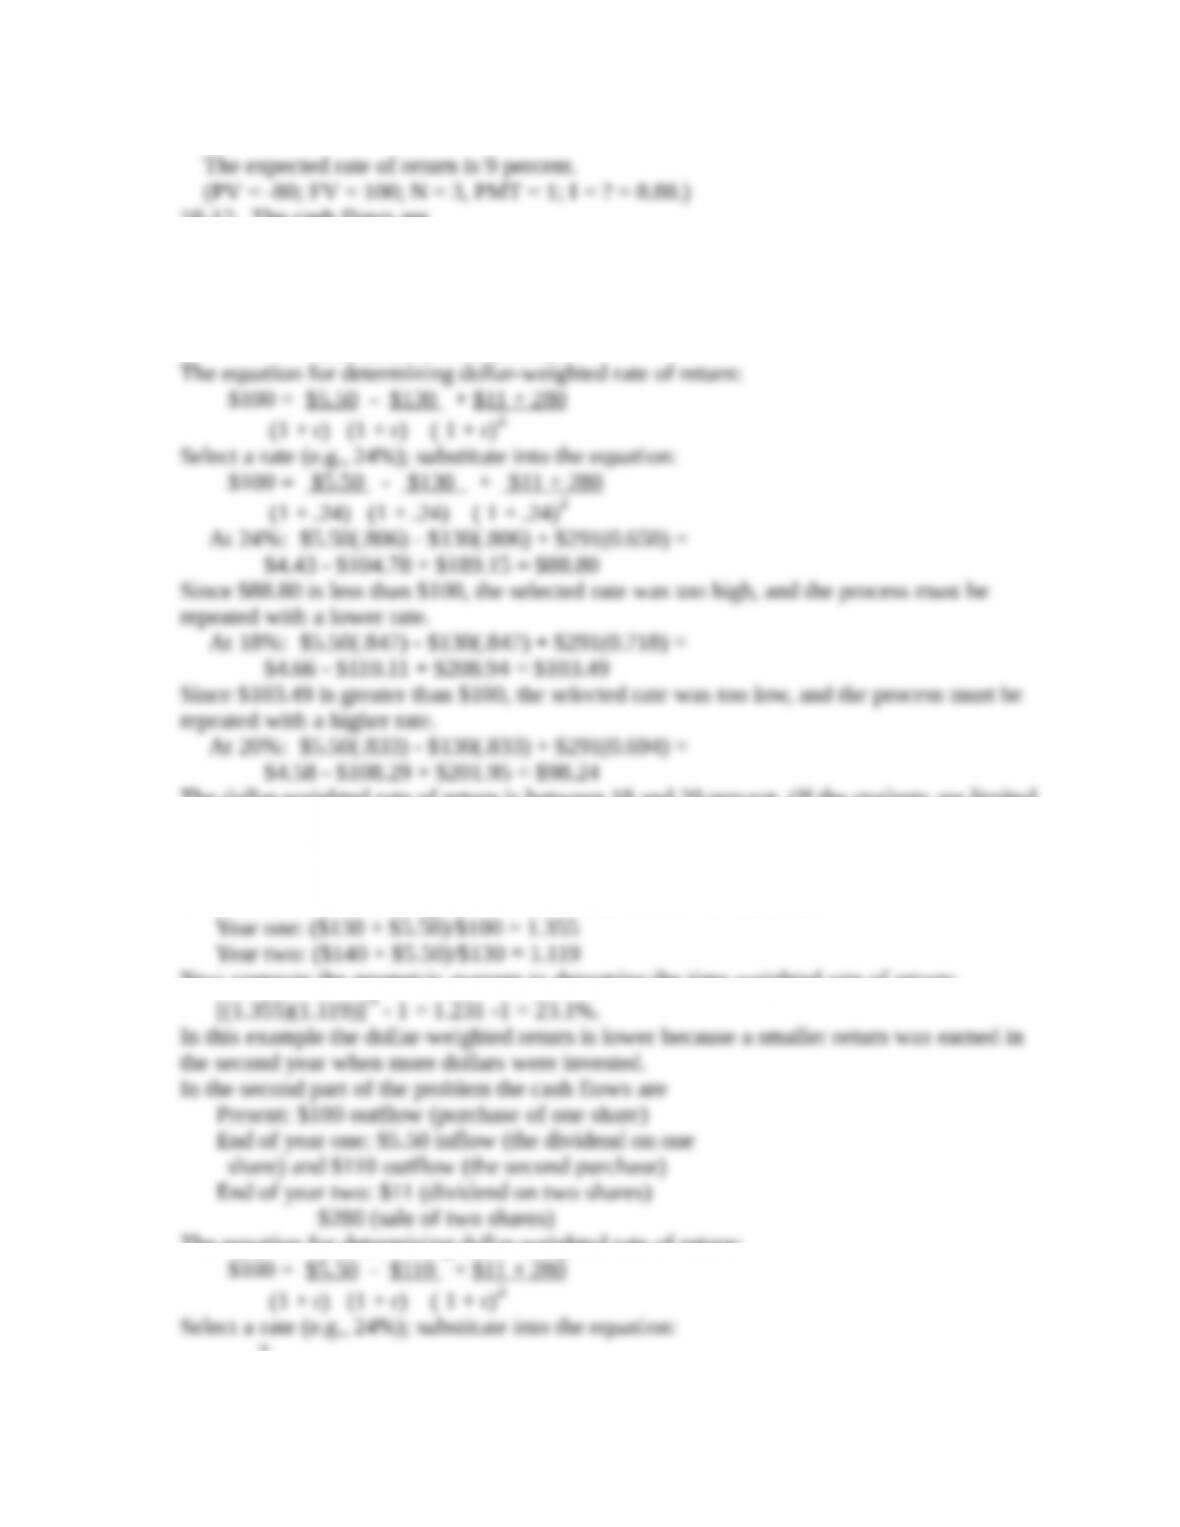
10-12. The cash flows are
Present: $100 outflow (purchase of one share)
End of year one: $5.50 inflow (the dividend on one
share) and $130 outflow (the second purchase)
End of year two: $11 (dividend on two shares)
$280 (sale of two shares)
The dollar-weighted rate of return is between 18 and 20 percent. (If the students are limited
to the use of the interest tables in the text, this is as close an answer they may derive
without interpolating. This problem may also be solved using a financial calculator that
accepts uneven cash inflows or Excel, which yields a return of 19.3 percent.)
To determine the time-weighted rate of return, the first calculation is
Next compute the geometric average to determine the time-weighted rate of return:
The equation for determining dollar-weighted rate of return:
?
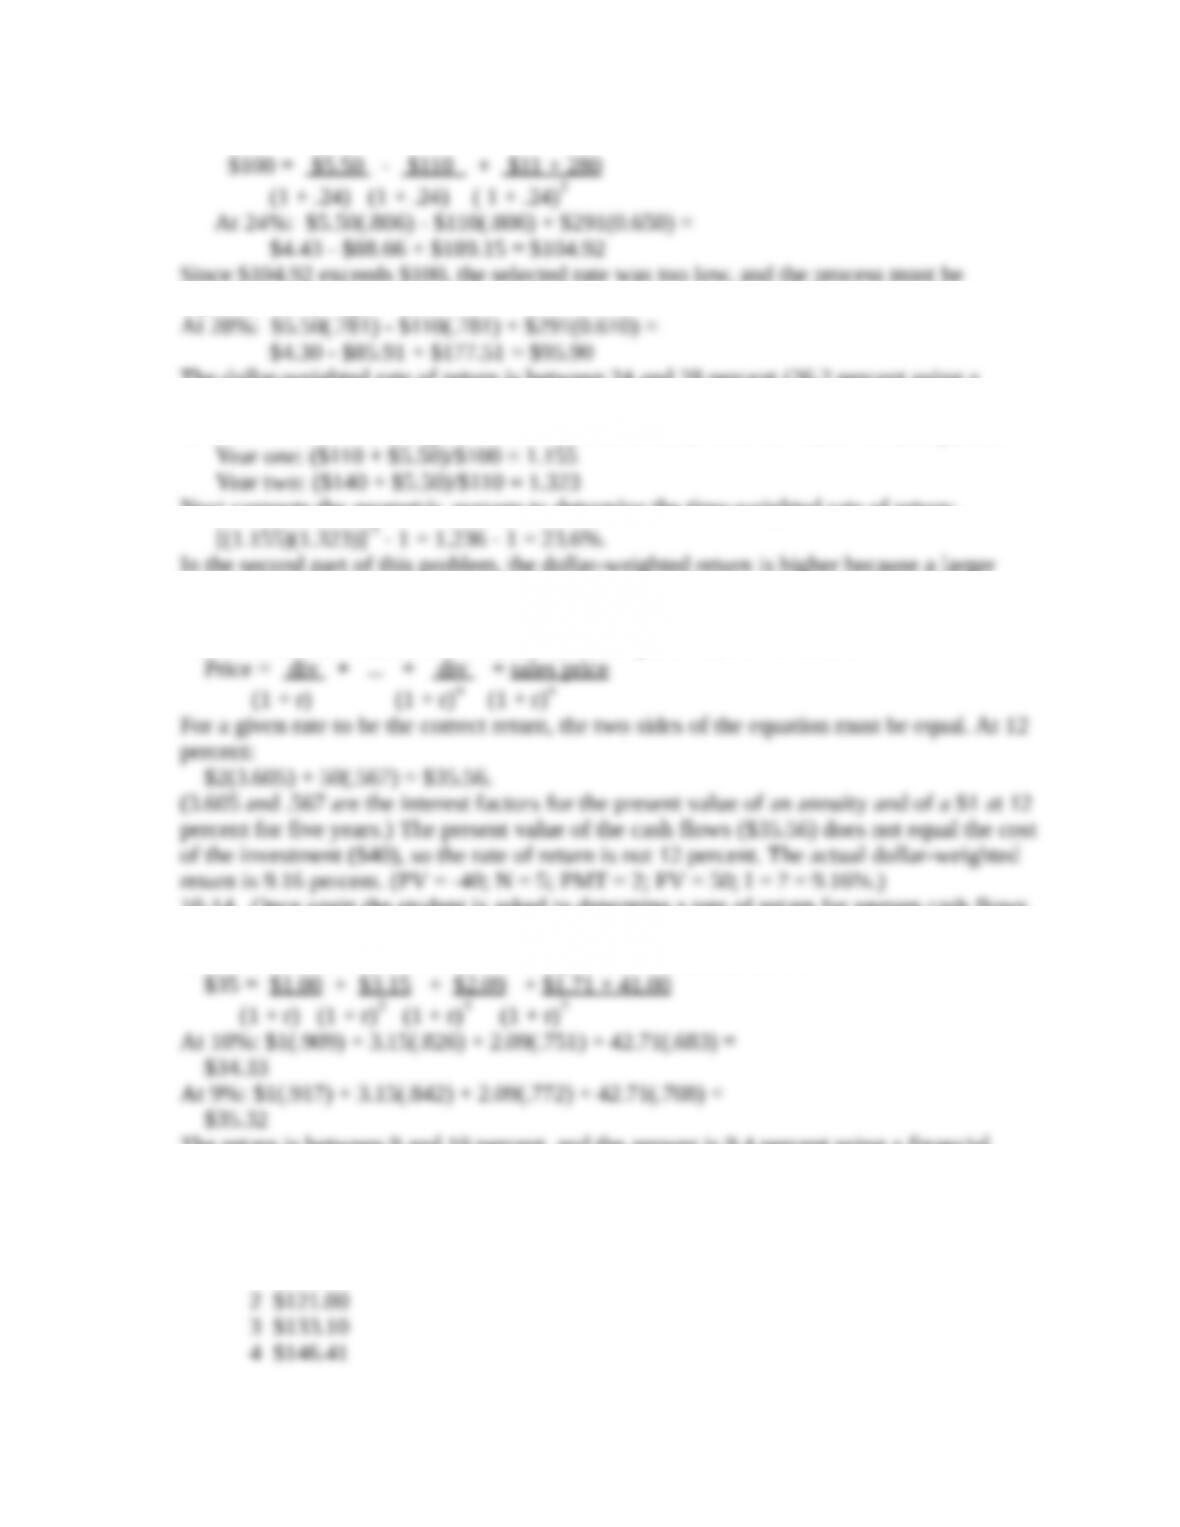
Since $104.92 exceeds $100, the selected rate was too low, and the process must be
repeated with a higher rate.
The dollar-weighted rate of return is between 24 and 28 percent (26.2 percent using a
calculator).
To determine the time-weighted rate of return, first determine the return for each period:
Next compute the geometric average to determine the time-weighted rate of return:
In the second part of this problem, the dollar-weighted return is higher because a larger
return was earned in the second year when more dollars were invested.
10-13. An alternative means to test whether the student understands the computation of
rates of return is to ask if an investment yields a particular rate of return.
10-14. Once again the student is asked to determine a rate of return for uneven cash flows.
Unless some type of computer program or a financial calculator that accepts uneven cash
inflow is used, the task is tedious. The equation to be solved for r is
The return is between 9 and 10 percent, and the answer is 9.4 percent using a financial
calculator. (Be certain to point out that this return is the dollar-weighted rate of return. The
time-weighted rate of return cannot be calculated because the problem does not specify the
fund’s net asset value at the end of each year.)
10-15. The value of the fund at the end of each year:
1 $110.00
5 $58.56
6 $64.42
7 $70.86
8 $77.95
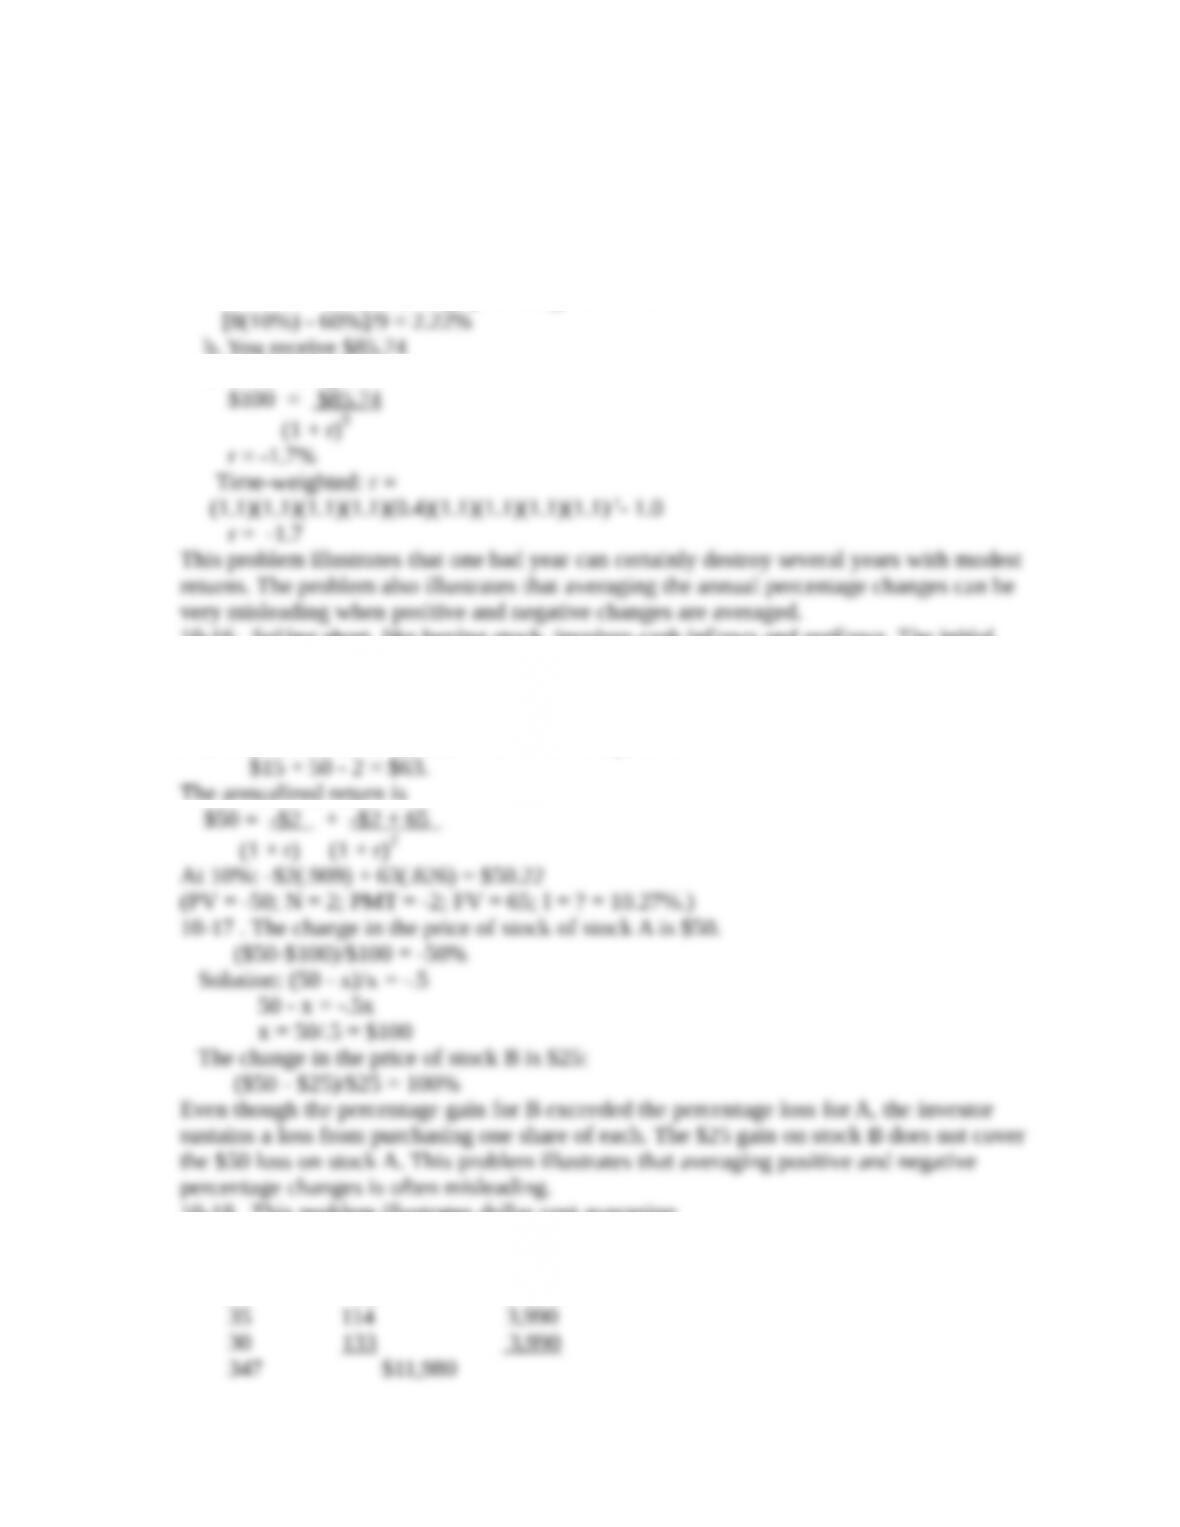
9 $85.74
10 a. The average percentage return is
b. You receive $85.74
c. Dollar-weighted:
10-16. Selling short, like buying stock, involves cash inflows and outflows. The initial
cash outflow is the margin requirement of $50. In each of the two years, there is a cash
outflow of $2 to cover the dividend payment. When the stock is repurchased for $35 and
returned to the broker, the investor makes $15 and the initial $50 margin deposit is
returned. Thus, the cash inflow for the second year is
The annualized return is
10-18. This problem illustrates dollar cost averaging.
Price of the Number of Shares Cost of Stock
Stock Purchased
$40 100 $4,000
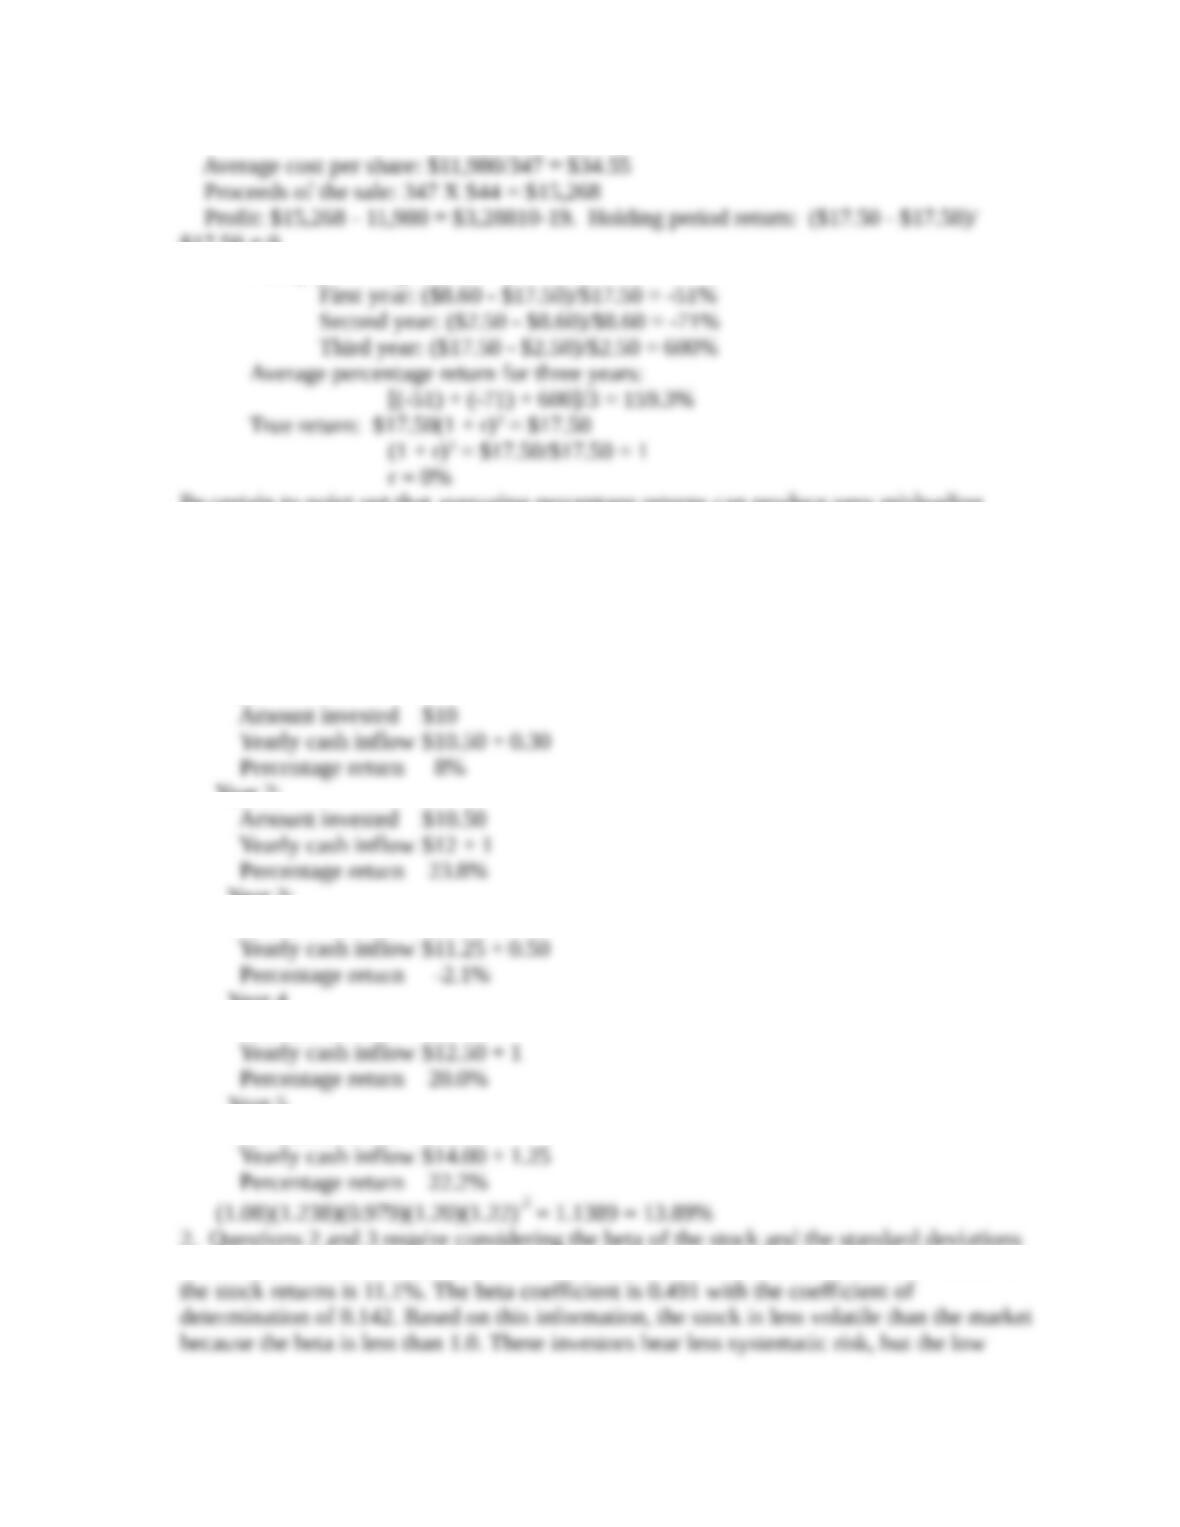
$17.50 = 0
Yearly percentage returns:
Be certain to point out that averaging percentage returns can produce very misleading
results.
Teaching Guides for the Financial Advisor’s Case: The Calculation of Returns
1. Return on the market:
(1.12)(1.17)(1.02)(0.97)(1.14).2 = 1.0813 = 8.13%
Return on the stock:
Annual returns
Year 1:
Year 2:
Year 3:
Amount invested $12
Year 4
Amount invested $11.25
Year 5
Amount invested $12.50
2. Questions 2 and 3 require considering the beta of the stock and the standard deviations
of the returns. The standard deviation of the returns is 8.5%, and the standard deviation of
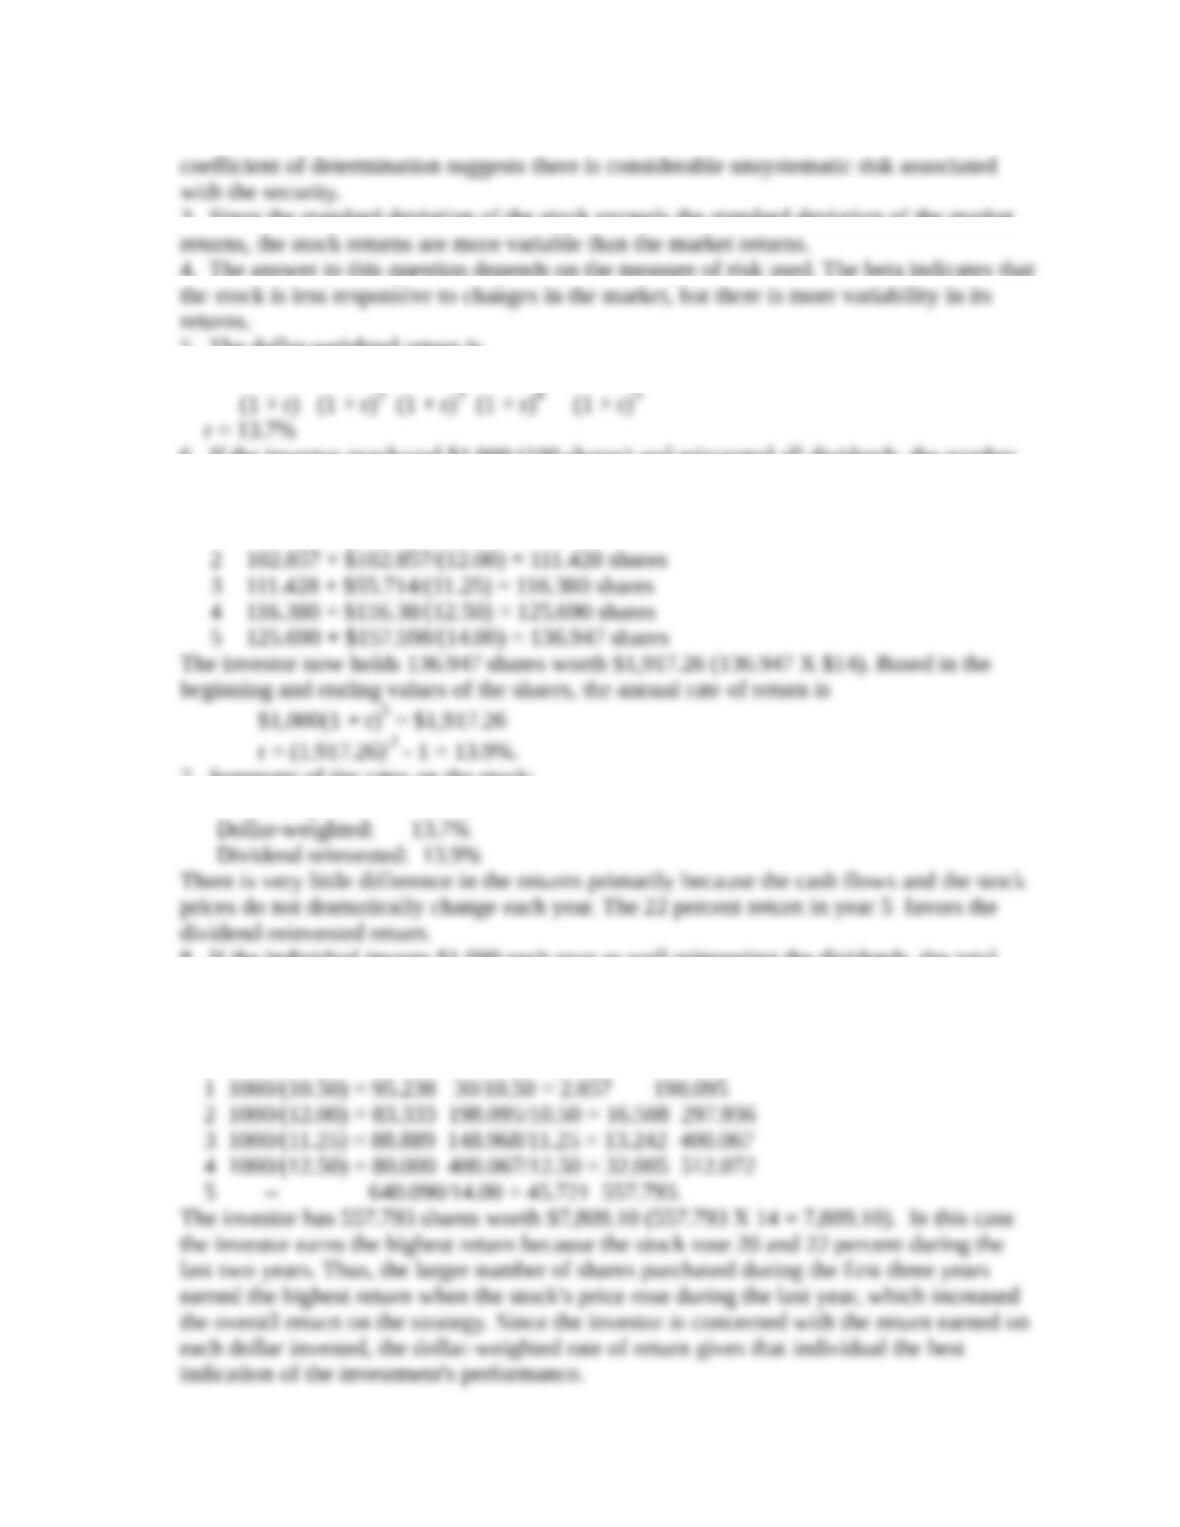
3. Since the standard deviation of the stock exceeds the standard deviation of the market
4. The answer to this question depends on the measure of risk used. The beta indicates that
5. The dollar-weighted return is
$10 = $0.30 + $1.00 + $0.50 + $1.00 + $1.25 + 14
6. If the investor purchased $1,000 (100 shares) and reinvested all dividends, the number
of shares at the end of each year would be
End of Year
1 100 + $30/(10.50) = 102.857 shares
7. Summary of the rates on the stock:
Time-weighted: 13.9%
8. If the individual invests $1,000 each year as well reinvesting the dividends, the total
shares acquired are
End of Shares Cash Received Total
Year Purchased and Invested Shares
0 100 – 100.000