P14-5. Calculating PBO, ABO and pension expense (LO 14-1, LO 14-2, LO 14-3)
Requirement 1:
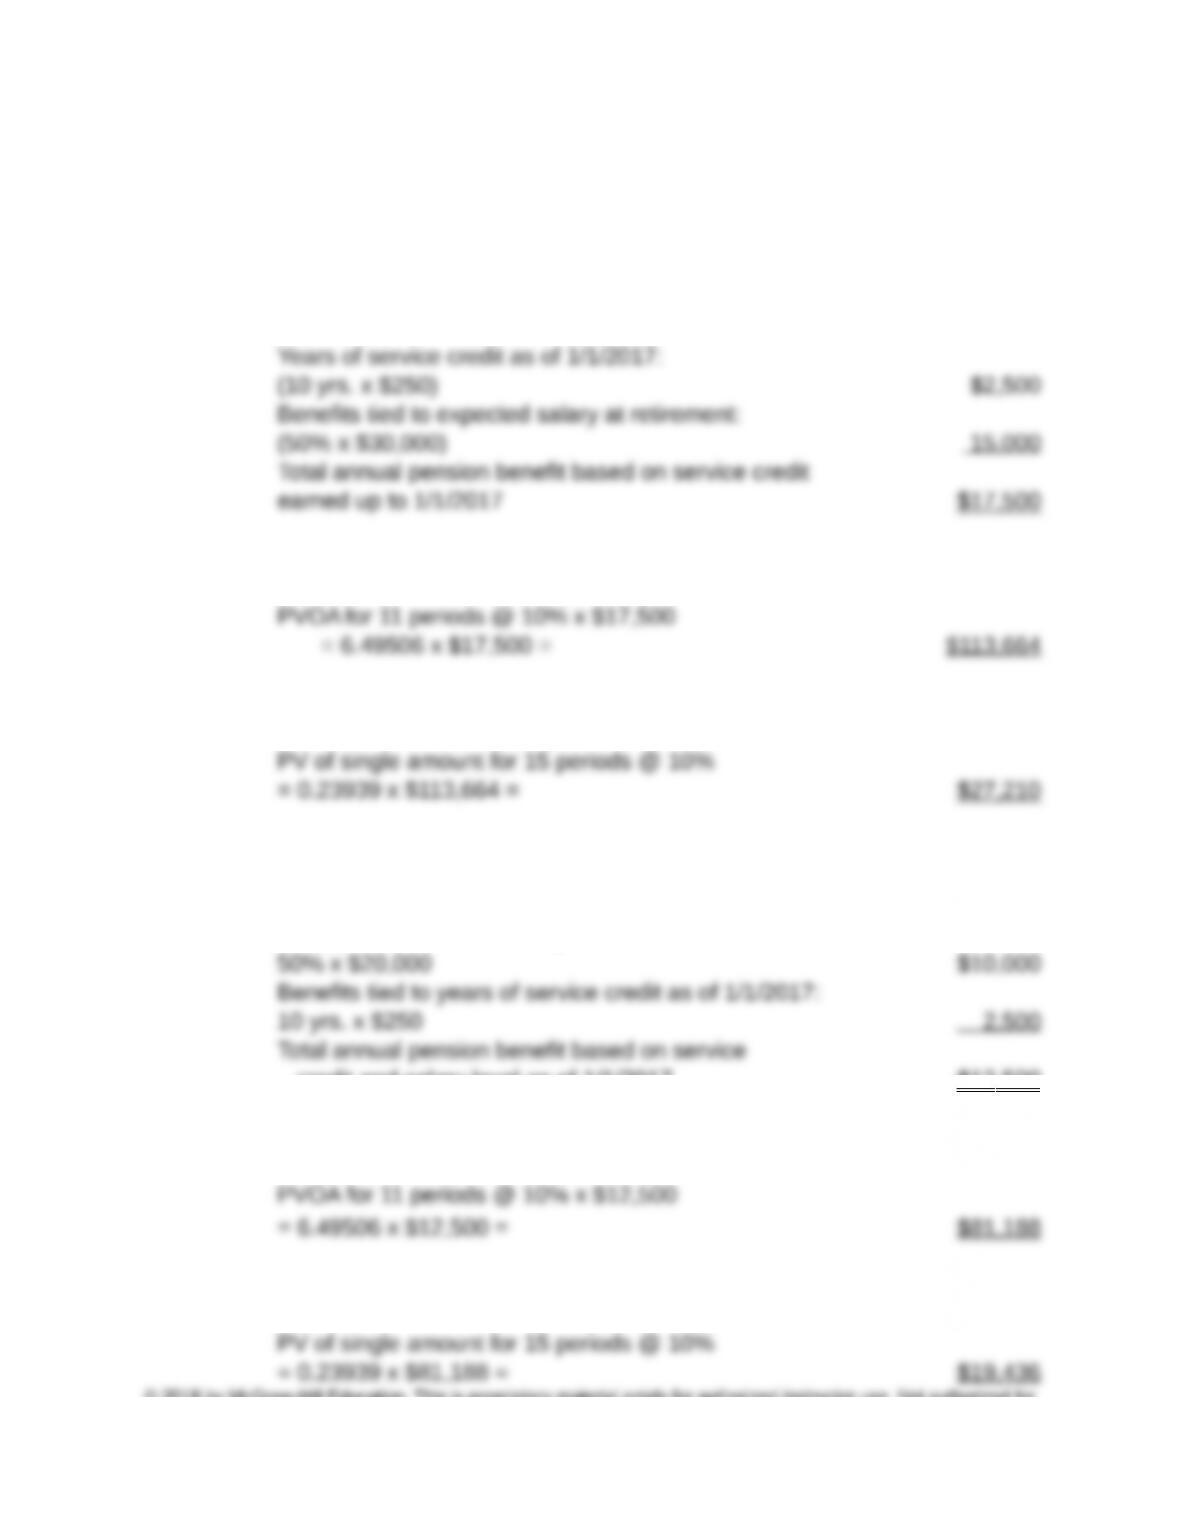
Calculation of PBO on January 1, 2017:
Annual pension benefits starting on 12/31/2031 and continuing for 10 years
thereafter (11 years total = 76 – 66).
PVOA of expected pension benefits as of 1/1/2031 (date of retirement):
Projected benefit obligation on 1/1/2017 (date plan adopted):
Accumulated benefit obligation on actual salary level attained as of the date of
computation (ignores future salary increase):
Benefits tied to actual salary as of 1/1/2017:
credit and salary level as of 1/1/2017 $12 ,500
PVOA of expected pension benefits as of 1/1/2031 (date of retirement):
Accumulated benefit obligation on 1/1/2017 (date of adoption):
© 2018 by McGraw-Hill Education. This is proprietary material solely for authorized instructor use. Not authorized for
sale or distribution in any manner. This document may not be copied, scanned, duplicated, forwarded, distributed, or
posted on a website, in whole or part. 14-1
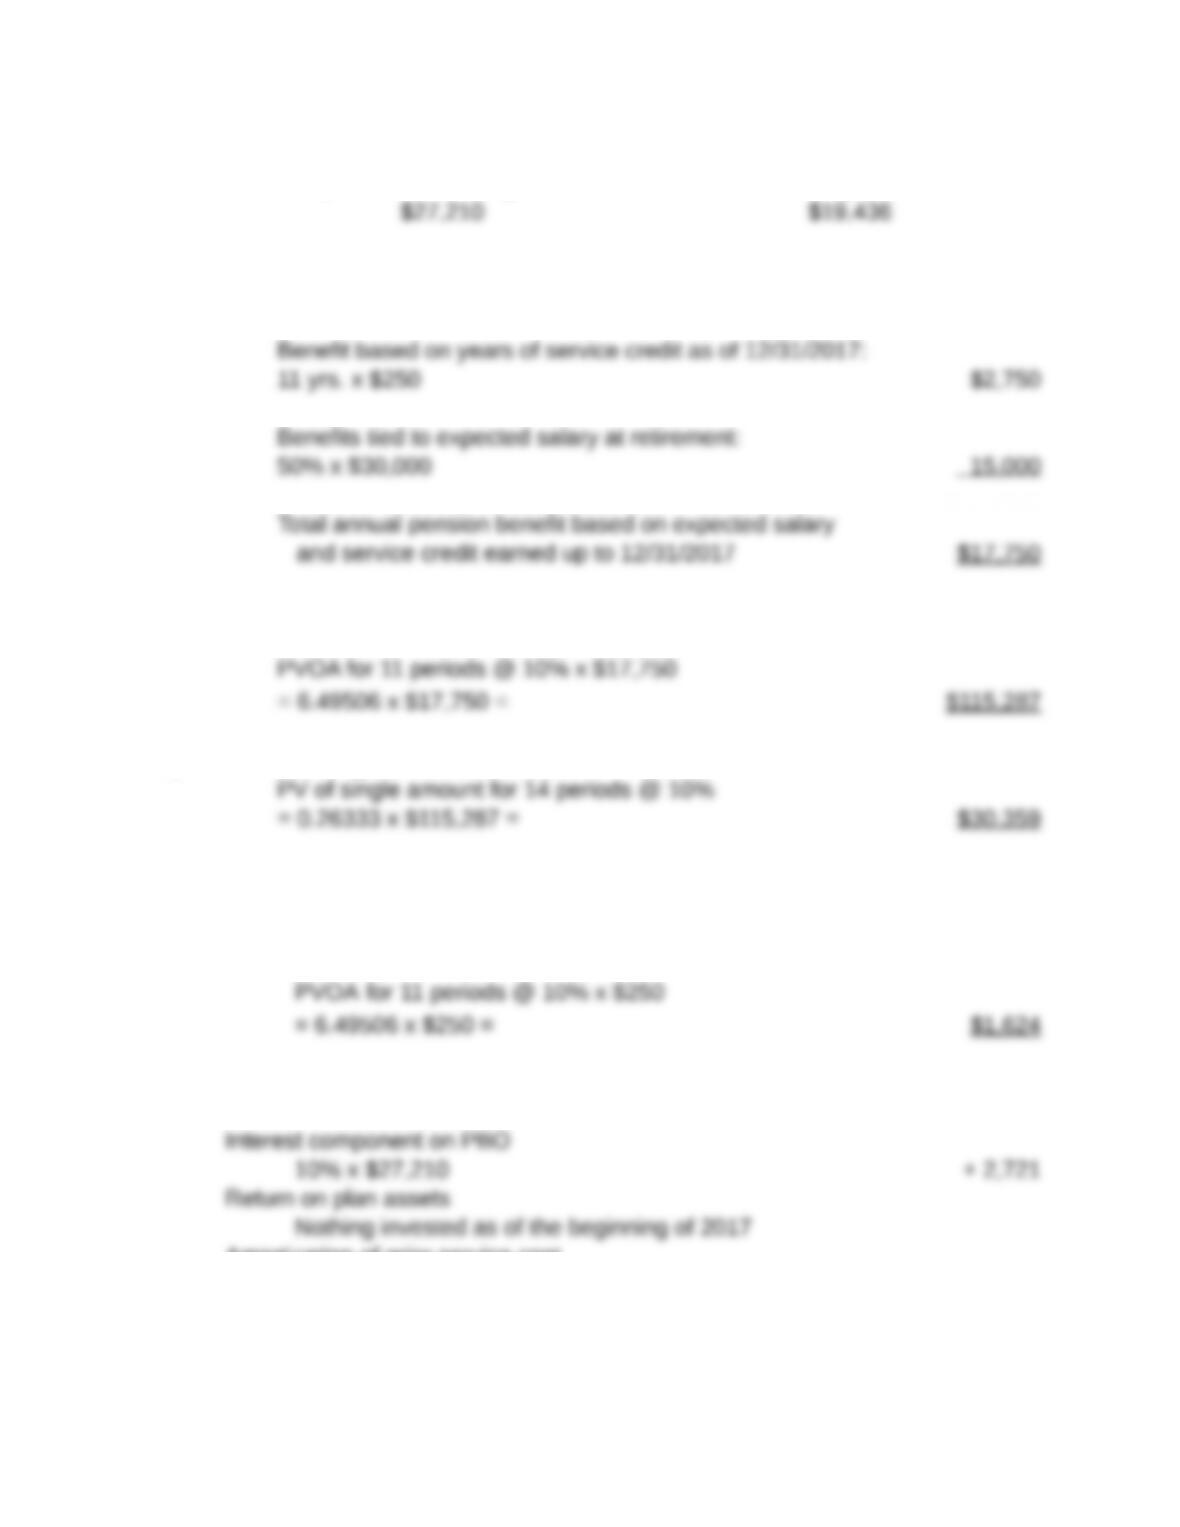
Note: Projected benefit obligation > accumulated benefit obligation
Requirement 2:
Calculation of projected benefit obligation on 12/31/2017:
PVOA of expected pension benefits as of 1/1/2031
Projected benefit obligation on 12/31/2017:
Requirement 3:
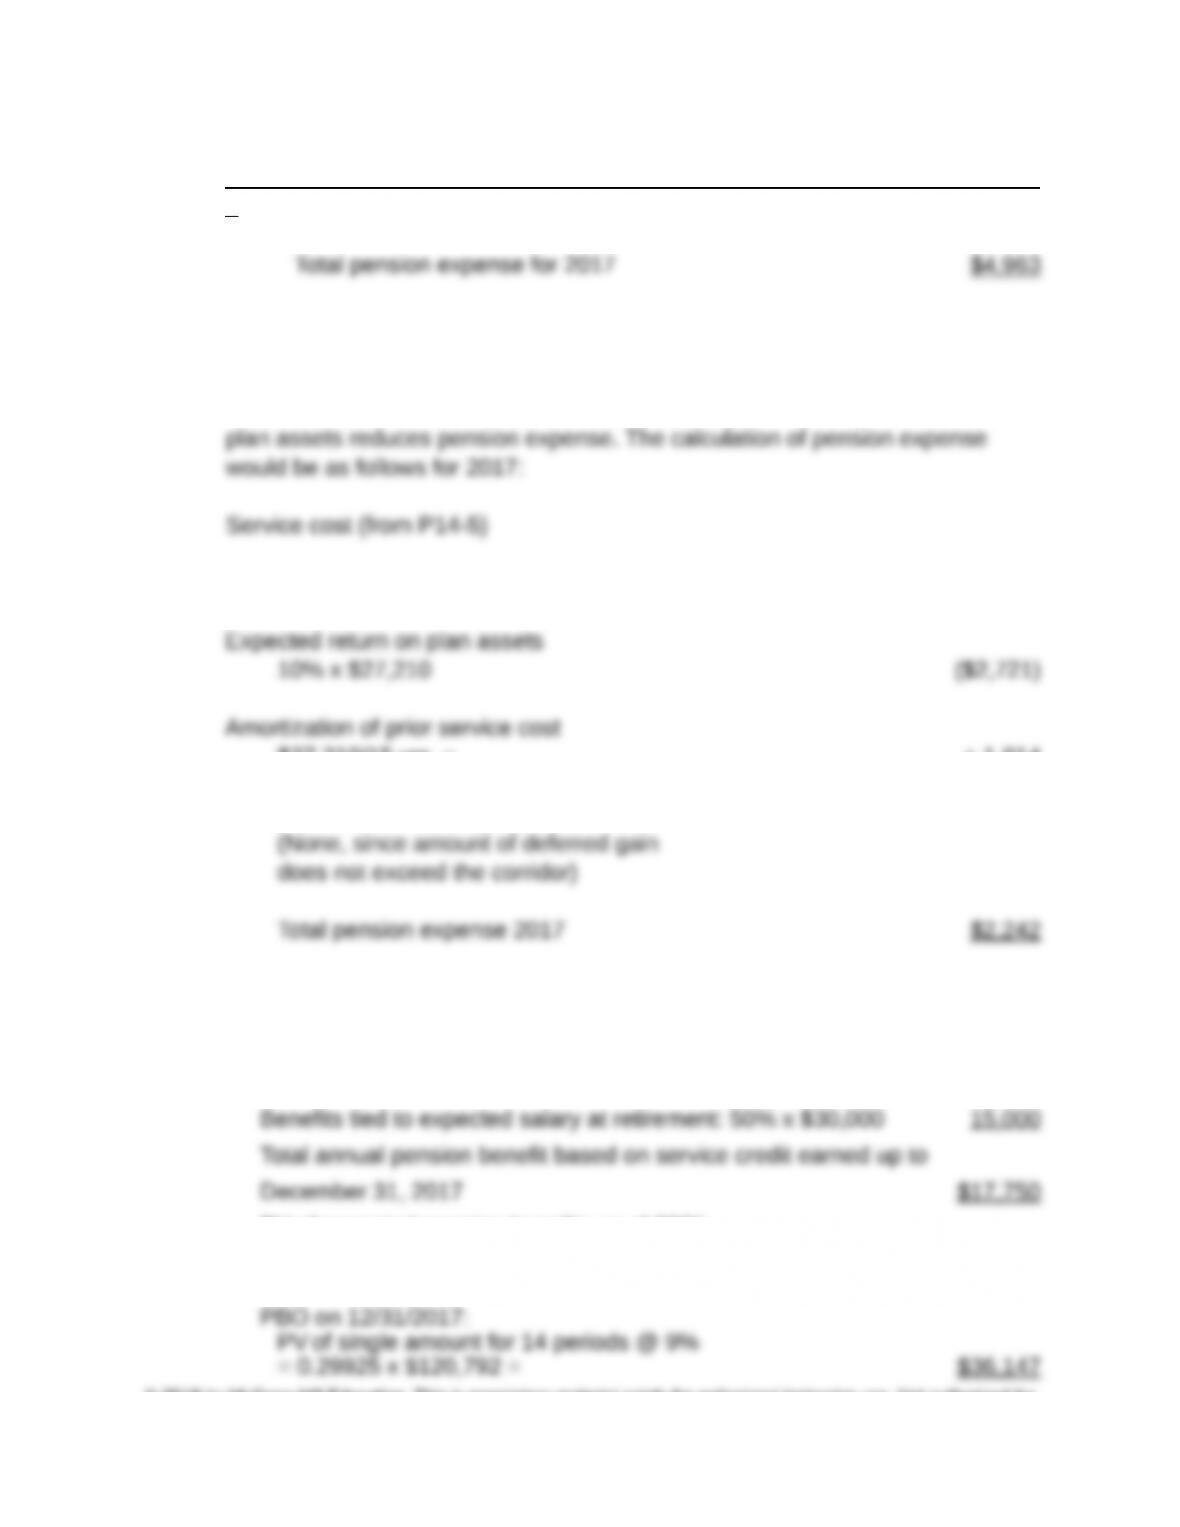
Calculation of pension expense for 2017:
Service cost component
PV of single amount for 14 periods @ 10% x $1,624
= 0.26333 x $1,624 =
Amortization of prior service cost
$27,210/15 yrs. = + 1,814
Amortization of actuarial gains/losses
© 2018 by McGraw-Hill Education. This is proprietary material solely for authorized instructor use. Not authorized for
sale or distribution in any manner. This document may not be copied, scanned, duplicated, forwarded, distributed, or
posted on a website, in whole or part. 14-2
0
P14-6. Determining PBO and pension expense (LO14-1, LO14-2, LO14-3)
Requirement 1: Pension expense in 2017
With the entire amount of PBO funded on Jan. 1, 2017, the expected return on
Interest on PBO
10% x $27,210 + 2,721
$27,210/15 yrs. = + 1,814
Amortization of actuarial gain/losses
Requirement 2: Funded status at December 31, 2017
Calculation of PBO at December 31, 2017 after discount rate change:
Years of service credit earned as of 2015: 11 yrs. x $250 $2,750
PV of expected pension benefits as of 2031:
PVOA for 11 periods @ 9% x $17,750 = 6.80519 x $17,750 =
$120,792
© 2018 by McGraw-Hill Education. This is proprietary material solely for authorized instructor use. Not authorized for
sale or distribution in any manner. This document may not be copied, scanned, duplicated, forwarded, distributed, or
posted on a website, in whole or part. 14-3
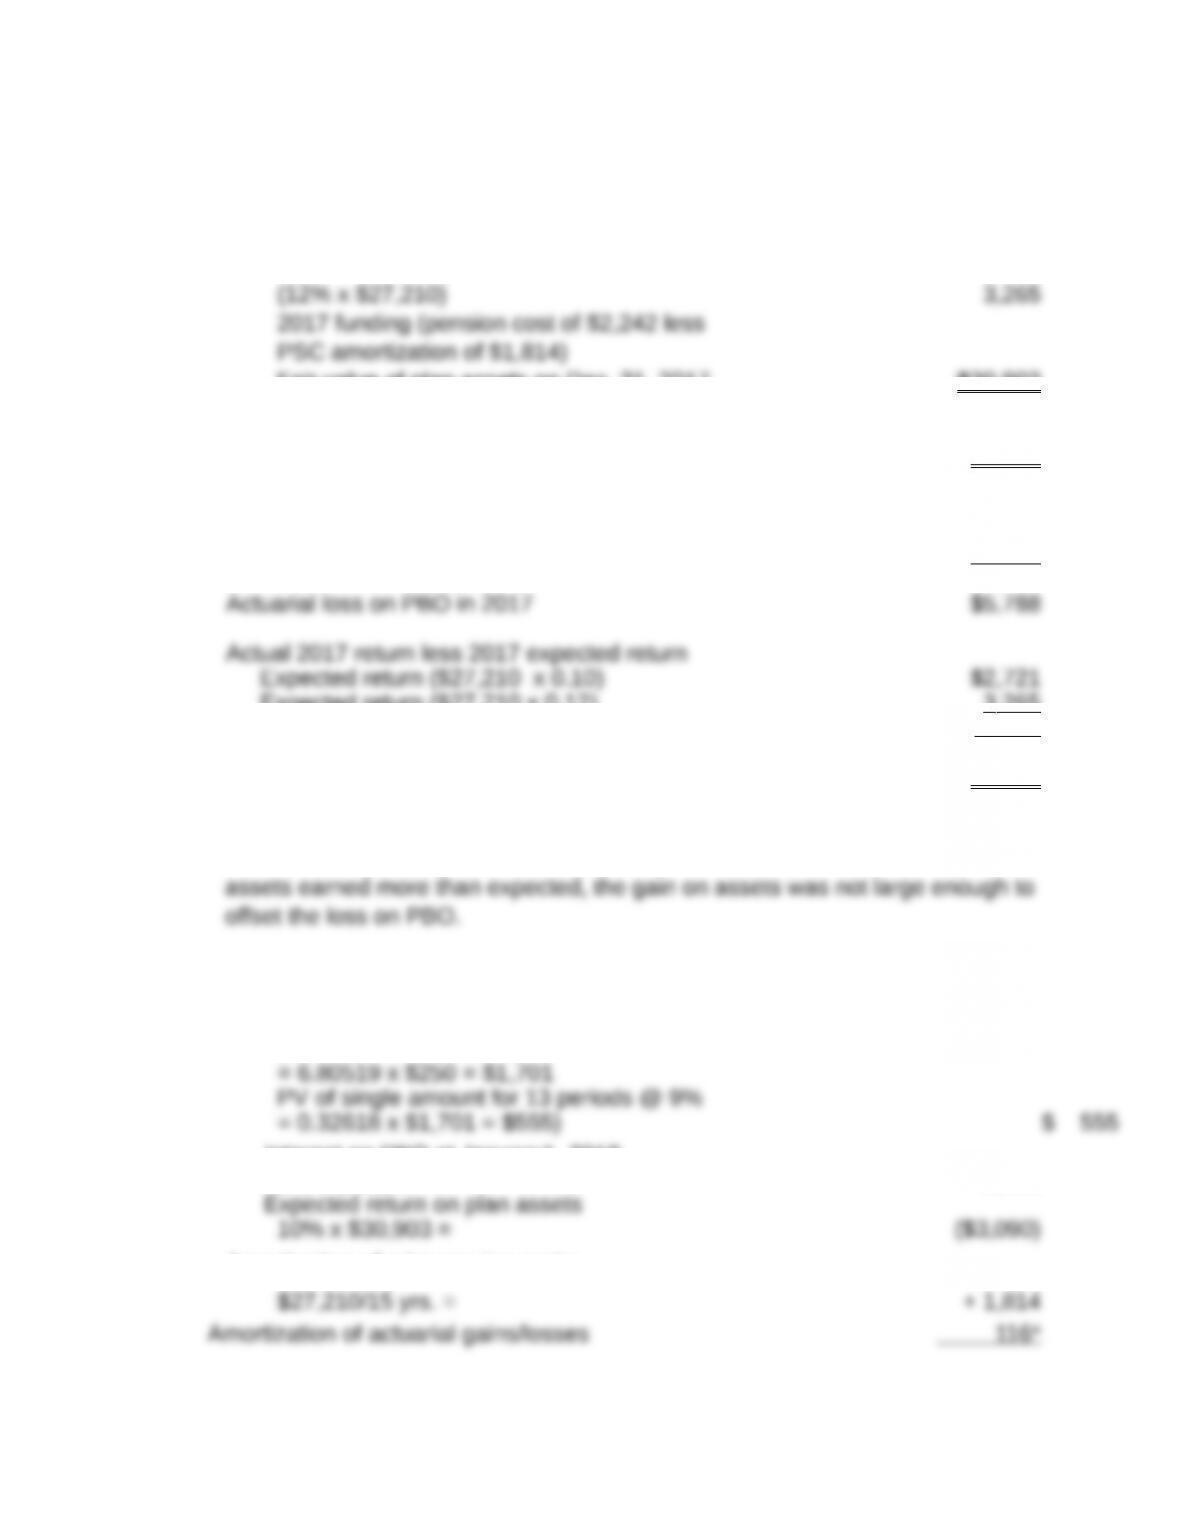
Calculation of fair value of plan assets on December 31, 2017:
Initial amount funded on Jan.1, 2017 $27,210
Actual return on plan assets in 2017
Fair value of plan assets on Dec. 31, 2017 $30 ,903
Funded Status ($30,903 less $36,147) $5 ,244
Net actuarial loss at the end of 2017:
PBO at 12/31/2017 at 9% $36,147
Less: PBO at 12/31/2017 at 10% from P12-5 solution 30 ,359
Expected return ($27,210 x 0.12) 3 ,265
Deferred gain (544 )
Net actuarial loss at December 31, 2017 $5 ,244
Explanation for Change in Funded Status:
The funded status declined because of the actuarial loss on PBO. Though the
Requirement 3: Pension expense and funding for 2018
Pension expense for 2018:
Service cost
(PVOA for 11 periods @ 9% x $250
Interest on PBO at January1, 2018
9% x $36,147 3,253
Amortization of prior service costs:
© 2018 by McGraw-Hill Education. This is proprietary material solely for authorized instructor use. Not authorized for
sale or distribution in any manner. This document may not be copied, scanned, duplicated, forwarded, distributed, or
posted on a website, in whole or part. 14-4
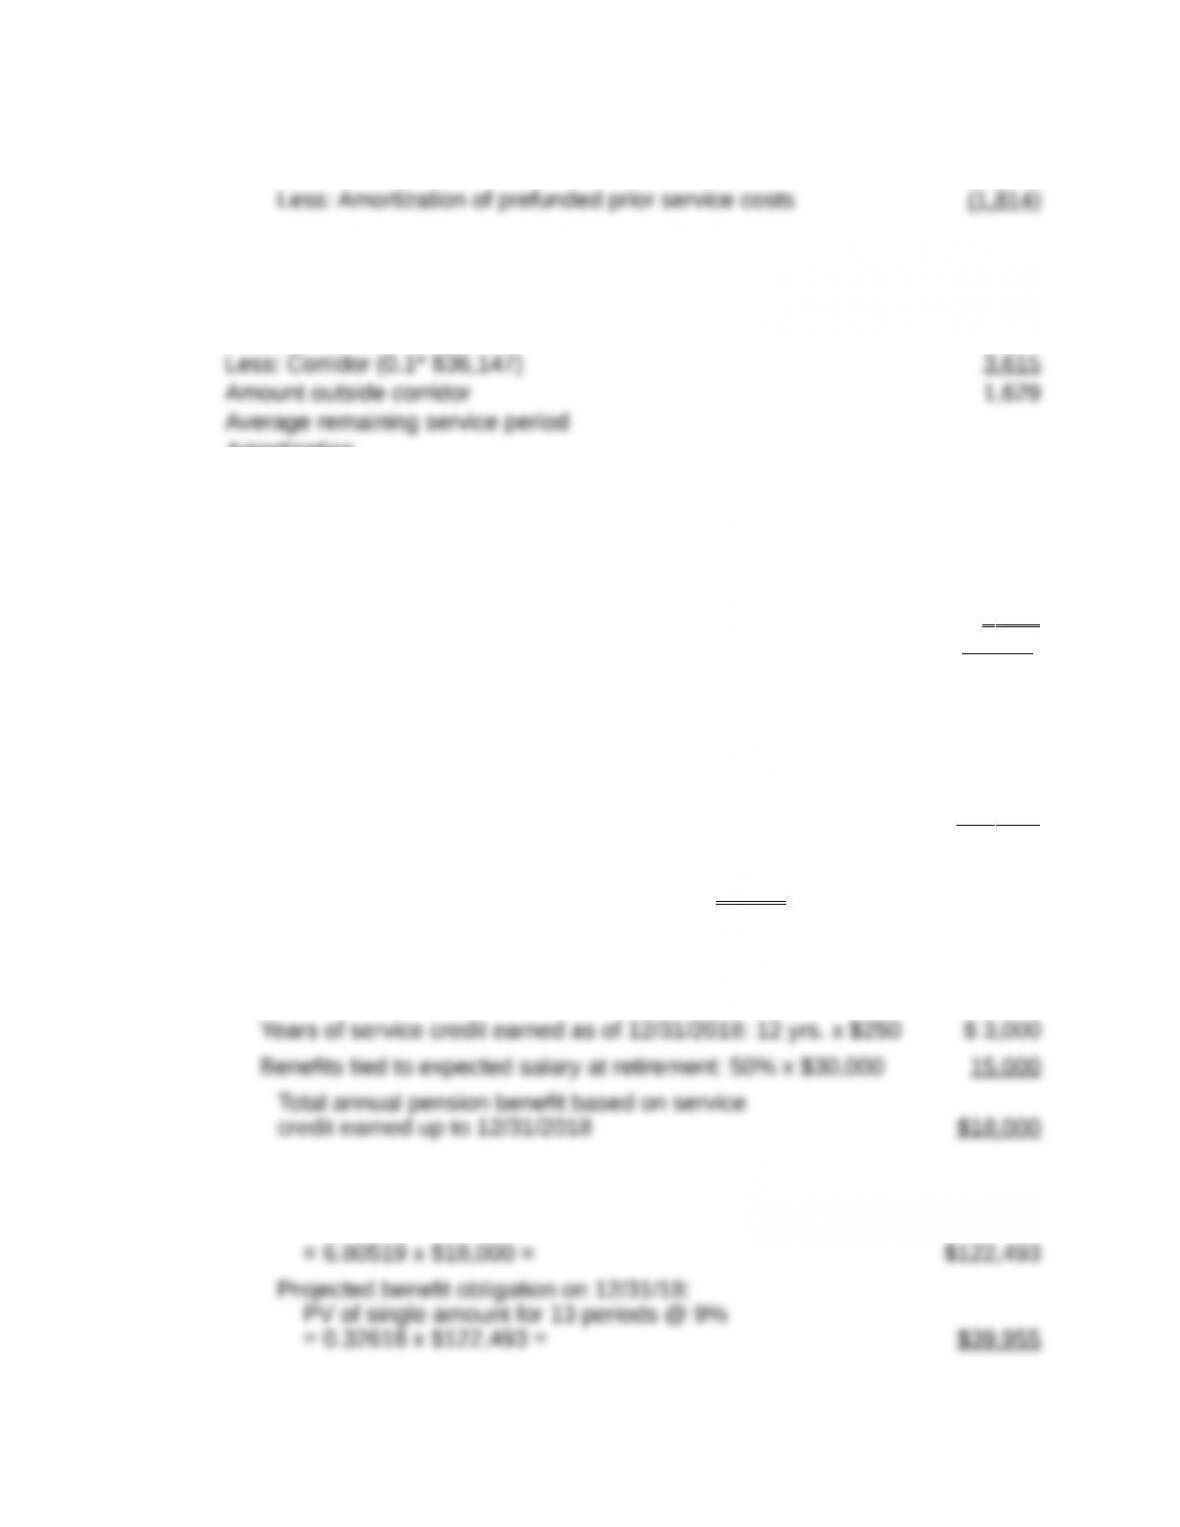
Total pension expense for 2018 $2,648
Amount of pension expense funded in 2018
*Amortization of actuarial loss
Actuarial loss on 1/1/2018 $5,244
Amortization
Requirement 4: Calculation of funded status on December 31, 2018:
Projected benefit obligation on Dec. 31, 2017 $36,147
Service cost
Interest cost 3 ,253
Projected benefit obligation on Dec. 31, 2018 $39 ,955#
Fair value of plan assets on Dec. 31, 2017 $30,903
Actual return on plan assets in 2018
10% x $30,903 3,090
2018 funding on Dec. 31, 2018
Total pension assets on Dec. 31, 2018 $34 ,827
Net underfunded position on 12/31/2018$5,128
#Check on PBO:
Annual pension benefits starting on 12/31/2031 and continuing for 10 years
thereafter (11 years total).
PVOA of expected pension benefits as of 1/1/31 (date of retirement):
PVOA for 11 periods @ 9% x $18,000
© 2018 by McGraw-Hill Education. This is proprietary material solely for authorized instructor use. Not authorized for
sale or distribution in any manner. This document may not be copied, scanned, duplicated, forwarded, distributed, or
posted on a website, in whole or part. 14-5
P14-7. Identifying effect of funding and discount rate assumption on pension ex–
pense (LO14-2, LO14-3, LO14-5)
Requirement 1:
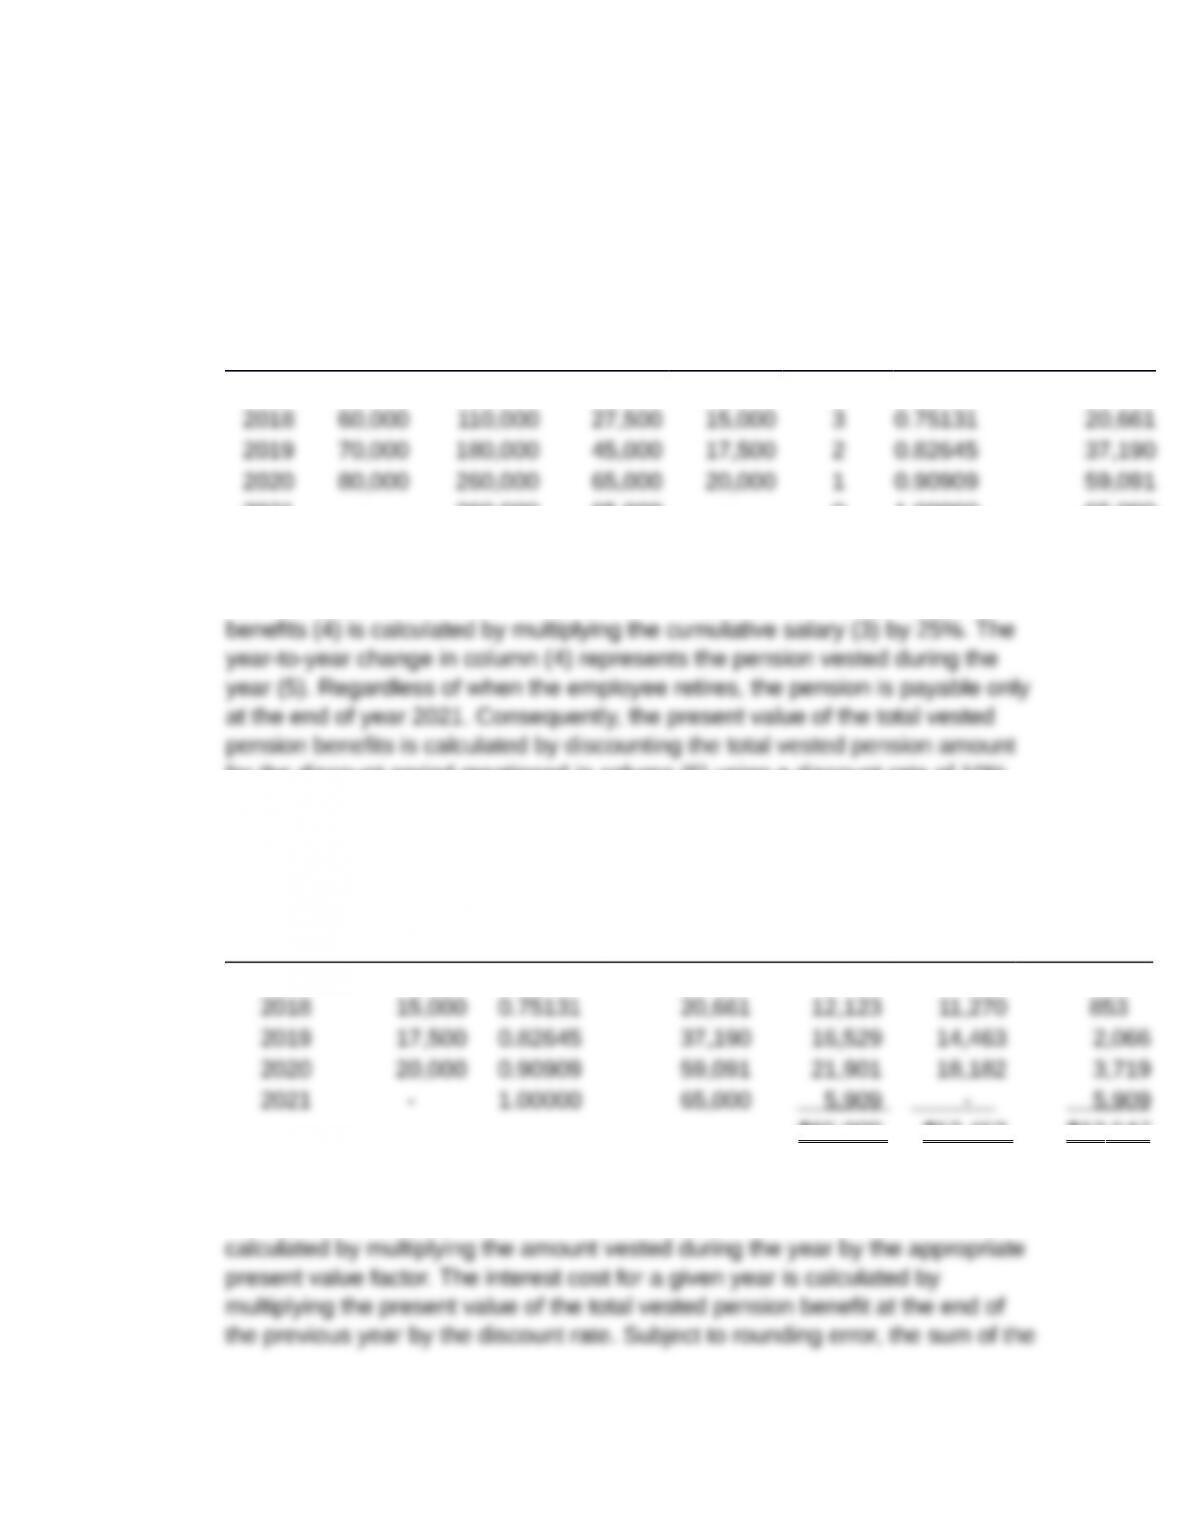
Total Vested PV of
End of Annual Cumulative Vested During Discount Total Vested
Year Salary Salary Pension the Year Period PV Factor Pension
1 2 3 4 5 6 7 8
2017 $50,000 $50,000 $12,500 $12,500 4 0.68301 $8,538
2021 – 260,000 65,000 – 0 1.00000 65,000
The above table shows the present value of the total vested pension benefits
over the period 2017–2021. At the end of each year, the total vested pension
for the discount period mentioned in column (6) using a discount rate of 10%.
Based on this information, the pension expense is calculated as follows:
Vested PV of Change
During Total Vested in the Service Interest
Year the Year PV Factor Pension PV Cost Cost
2017 $12,500 0.68301 $8,538 $8,538 $8,538 –
$65 ,000 $52 ,453 $12 ,547
Conceptually, the annual pension expense for an unfunded plan is the change
in the present value of the total vested pension benefit. The service cost is
© 2018 by McGraw-Hill Education. This is proprietary material solely for authorized instructor use. Not authorized for
sale or distribution in any manner. This document may not be copied, scanned, duplicated, forwarded, distributed, or
posted on a website, in whole or part. 14-6
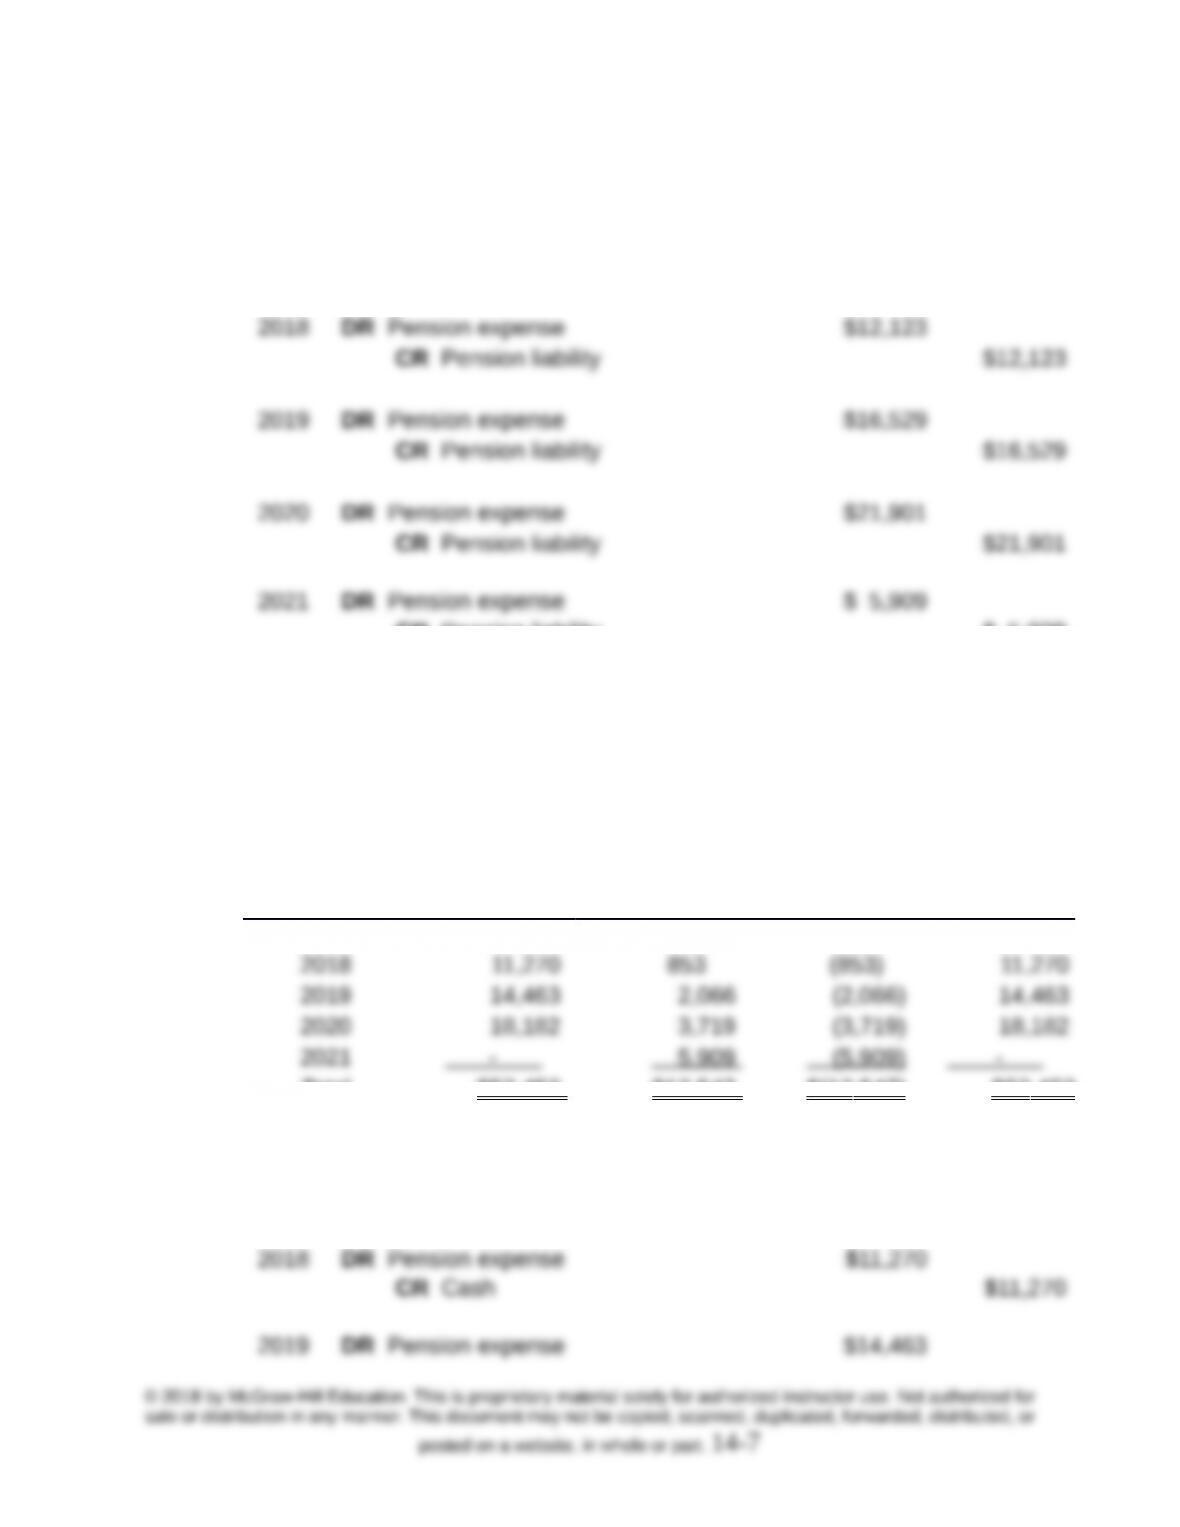
service cost and the interest cost equals the change in the present value of the
total vested pension benefits.
2017 DR Pension expense $ 8,538
CR Pension liability $ 8,538
CR Pension liability $ 5,909
DR Pension liability $65,000
CR Cash $65,000
Requirement 2:
In this case, the pension expense will exactly equal the service cost:
Service Interest Return on Pension
Year Cost Cost Plan Assets Expense
2017 $ 8,538 – – $ 8,538
Total $52 ,453 $12 ,547 $(12 ,547) $52 ,453
2017 DR Pension expense $ 8,538
CR Cash $ 8,538
2021 DR Pension expense –
CR Cash –
Requirement 3:
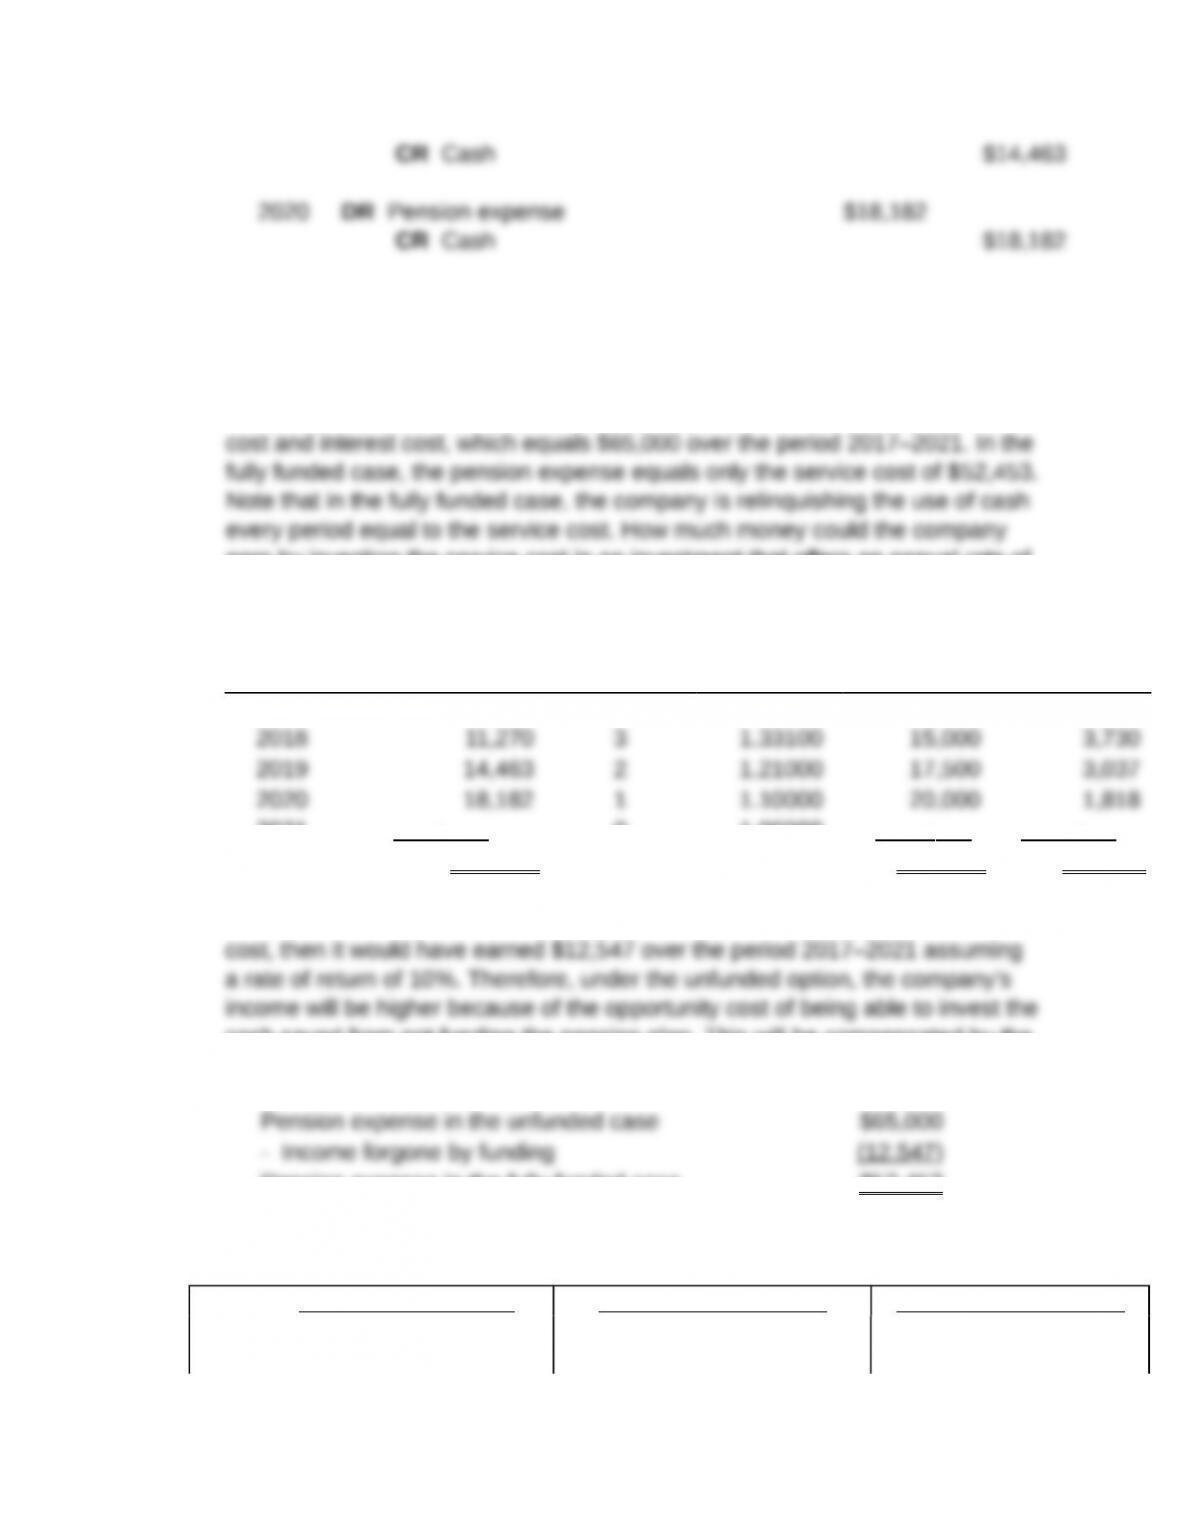
Under the unfunded scenario, the pension expense is the sum of the service
earn by investing the service cost in an investment that offers an annual rate of
return of 10%?
Annual Investment Future Income
Year Contributions Period FV Factor Value Earned
2017 $ 8,538 4 1.46410 $12,500 $ 3,962
2021 – 0 1.00000 – –
Total $52 ,453 $65 ,000 $12 ,547
Consequently, in the unfunded case, if the company had invested the service
cash saved from not funding the pension plan. This will be compensated by the
higher pension expense.
Pension expense in the fully funded case $52 ,453
Requirement 4:
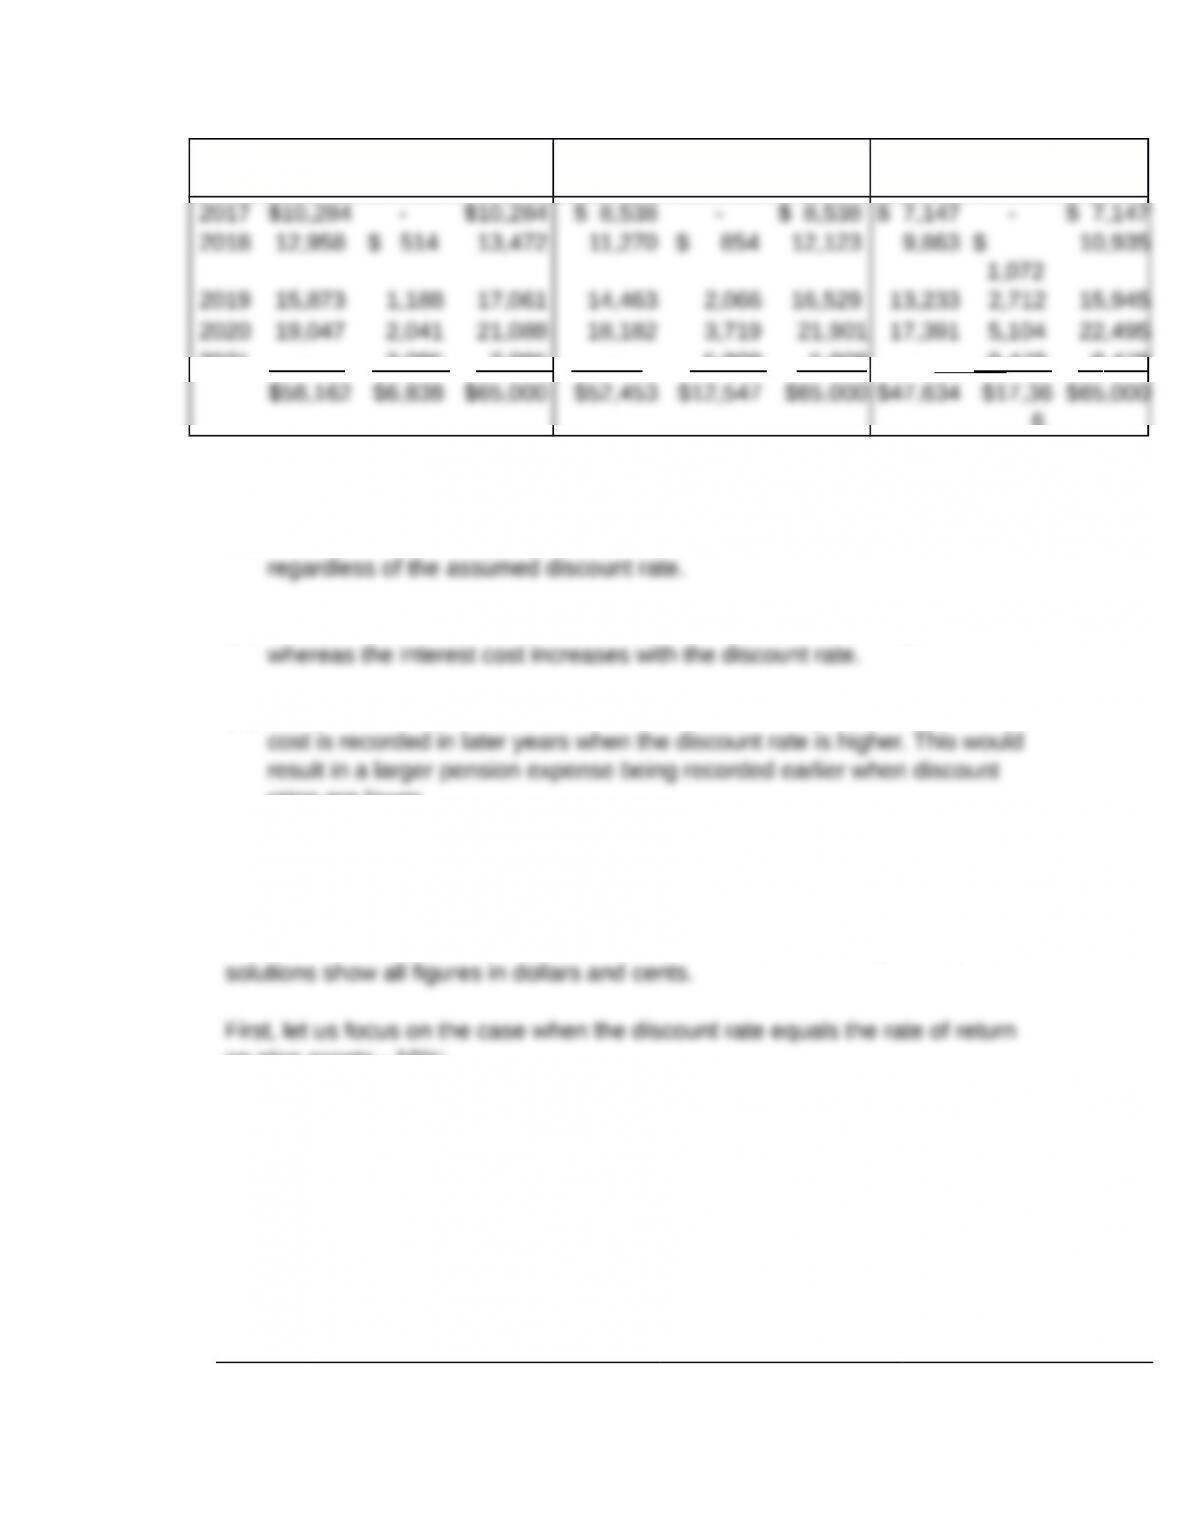
Discount Rate = 5% Discount Rate = 10% Discount Rate = 15%
Service Interest Total Service Interest Total Service Interes
t
Total
© 2018 by McGraw-Hill Education. This is proprietary material solely for authorized instructor use. Not authorized for
sale or distribution in any manner. This document may not be copied, scanned, duplicated, forwarded, distributed, or
posted on a website, in whole or part. 14-8
Year Cost Cost Expense Cost Cost Expens
e
Cost Cost Expens
e
2021 – 3 ,095 3 ,095 – 5 ,909 5 ,909 – 8 ,478 8 ,478
6
The following observations emerge from this comparison:
(1) Over the life of a company, the total pension expense is the same
(2) However, the service cost is lower when the discount rate is higher,
(3) Since interest cost represents the time value of money, more of the interest
rates are lower.
P14-8. Determining effect of discount rate assumption on pension expense
and PBO (LO14-2, LO14-3, LO14-5)
Note to the instructor: In order to minimize the effects of rounding errors, the
on plan assets – 10%:
Requirement 1: Annual pension expense
Assumptions: Discount rate = 10% and Rate of return on plan assets =
10%
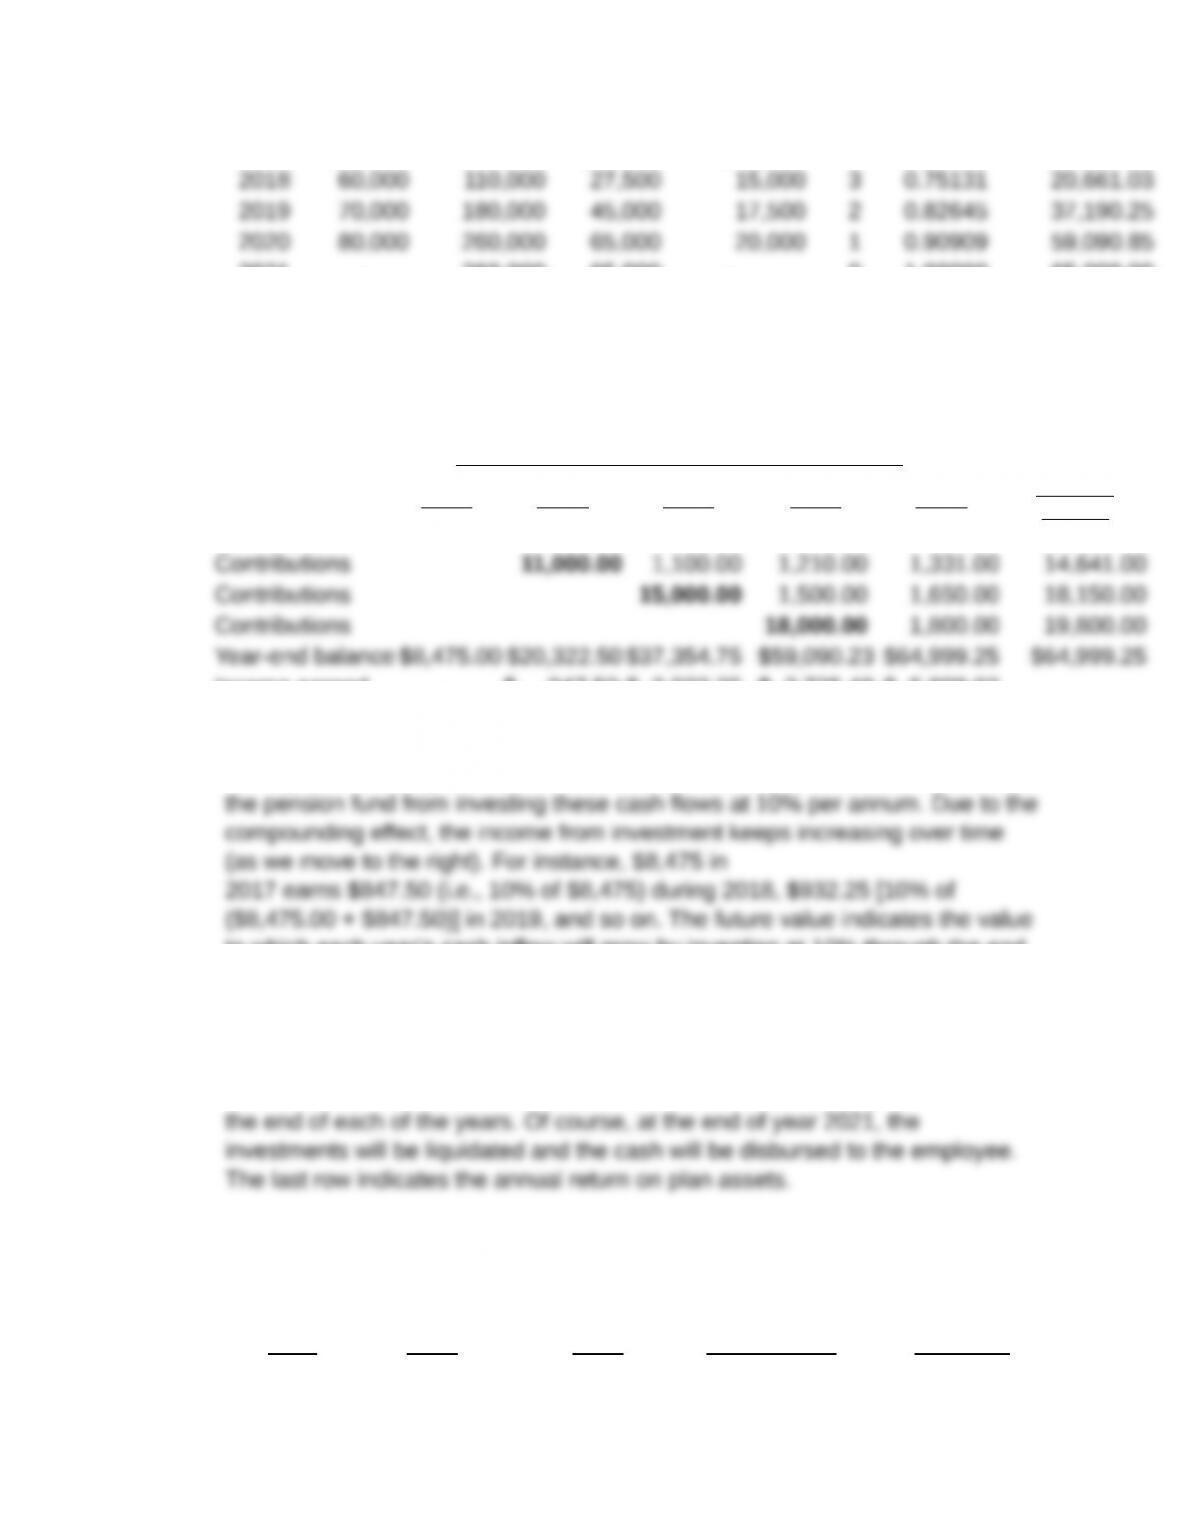
Total Vested PV of
End of Annual Cumulative Vested During Discoun
t
PV Total Vested
Year Salary Salary Pension the Year Period Factor Pension
1 2 3 4 5 6 7 8
© 2018 by McGraw-Hill Education. This is proprietary material solely for authorized instructor use. Not authorized for
sale or distribution in any manner. This document may not be copied, scanned, duplicated, forwarded, distributed, or
posted on a website, in whole or part. 14-9
2017 $50,000 $50,000 $12,500 $12,500 4 0.68301 $8,537.63
2021 – 260,000 65,000 – 0 1.00000 65,000.00
Note that the PV of total vested pension represents the projected benefit
obligation.
The following table summarizes the activities in the pension fund.
Pension Fund Investments and Earnings
2017 2018 2019 2020 2021 Future
Value
Contributions $8,475.00 $ 847.50 $ 932.25 $ 1,025.48 $ 1,128.02 $12,408.25
Income earned – $ 847.50 $ 2,032.25 $ 3,735.48 $ 5,909.02
The highlighted diagonal figures represent the inflow of cash from Magee Corp.
The figures to the right of these numbers represent the future return earned by
to which each year’s cash inflow will grow by investing at 10% through the end
of 2021. Except for rounding errors, note that the future value of each year’s
cash inflow corresponds to the pension vested during the same year shown in
the previous table.
The row titled “Year-end balance” provides the fair value of the plan assets at
Based on the above information, we now calculate the pension expense as
follows:
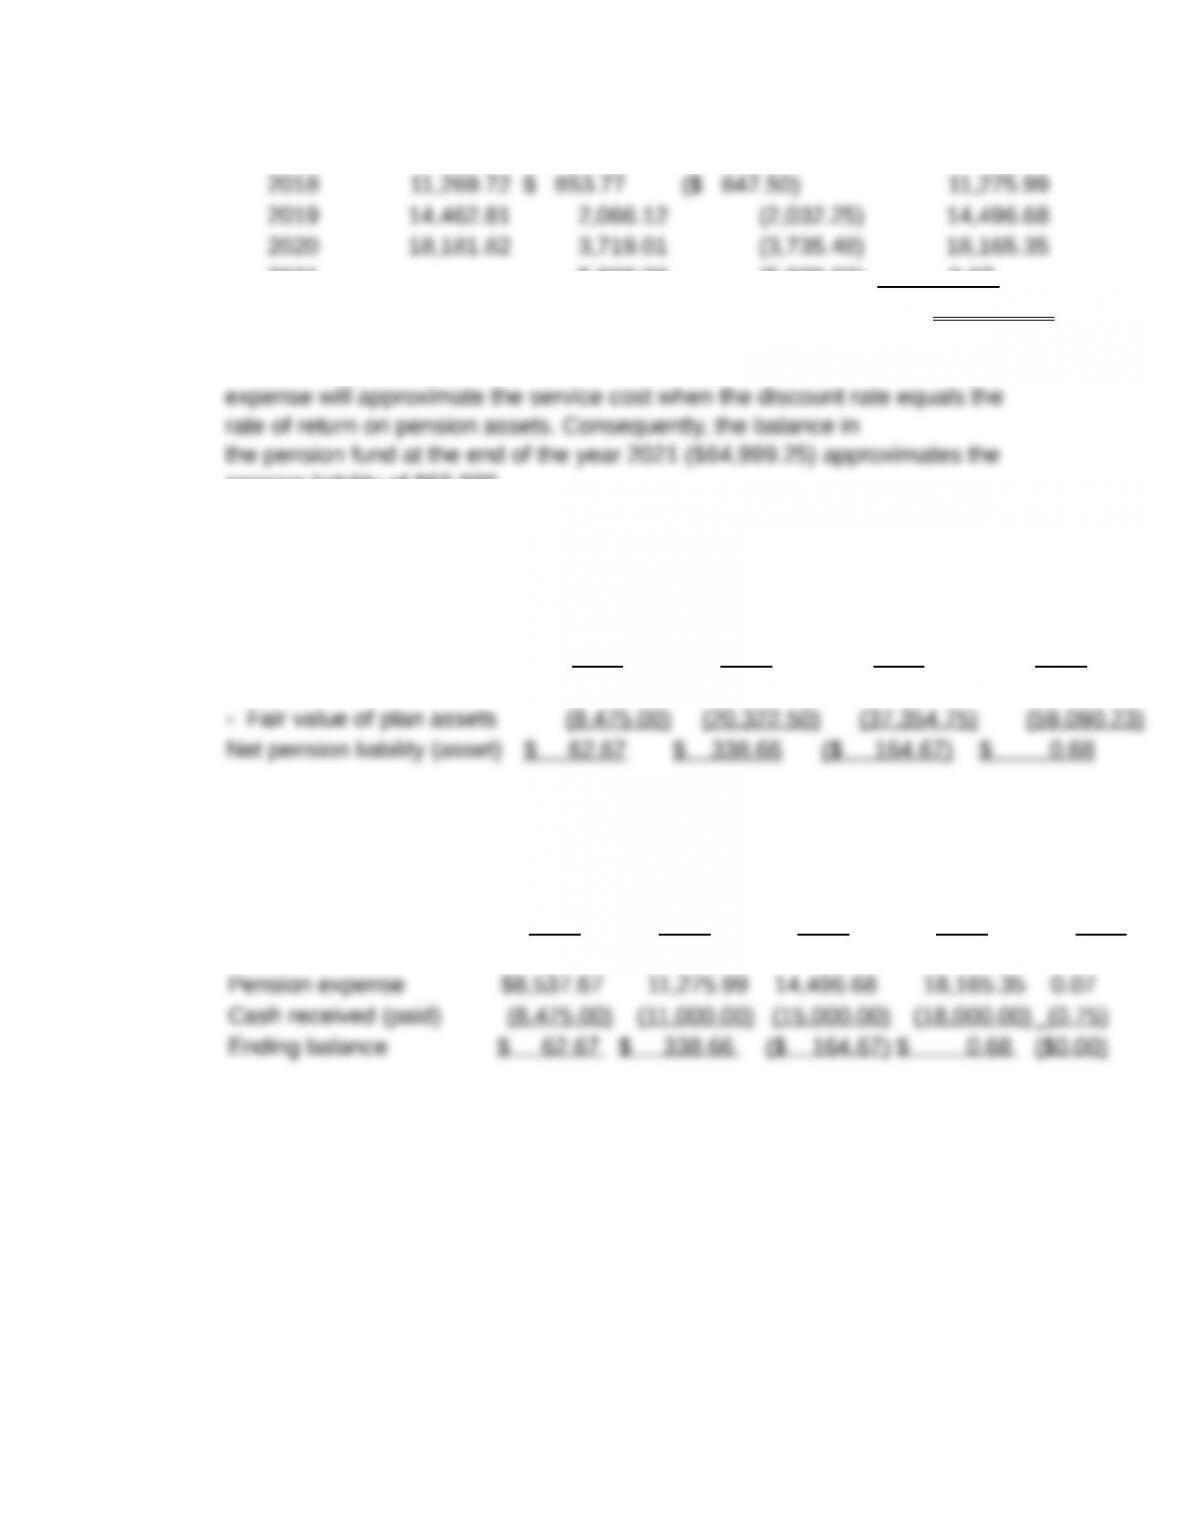
Service Interest Return on Pension
Year Cost Cost Plan Assets Expense
© 2018 by McGraw-Hill Education. This is proprietary material solely for authorized instructor use. Not authorized for
sale or distribution in any manner. This document may not be copied, scanned, duplicated, forwarded, distributed, or
posted on a website, in whole or part. 14-10
2017 $ 8,537.67 – – $ 8,537.67
2021 5,909.09 (5,909.02) 0.07
$52 ,475.76
Note: The figures for pension contributions were chosen such that the pension
pension liability of $65,000.
The funding status of the pension plan is provided below:
Requirement 2: Funded status under 10% discount rate
End of Year 2017 2018 2019 2020
Projected benefit obligation $8,537.67 $20,661.16 $37,190.08 $59,090.91
The balance in net pension liability (asset) can verified by preparing the
T-account:
Pension Liability
(Asset) at Year-End 2017 2018 2019 2020 2021
Beginning balance – $ 62.67 $ 338.66 ($ 164.67) $ 0.68
The tables are now reported under the other two scenarios regarding the
discount rates.
© 2018 by McGraw-Hill Education. This is proprietary material solely for authorized instructor use. Not authorized for
sale or distribution in any manner. This document may not be copied, scanned, duplicated, forwarded, distributed, or
posted on a website, in whole or part. 14-11