CHAPTER 11
RISK AND RETURN: THE CAPITAL
ASSET PRICING MODEL (CAPM)
Answers to Concepts Review and Critical Thinking Questions
1. Some of the risk in holding any asset is unique to the asset in question. By investing in a variety of
assets, this unique portion of the total risk can be eliminated at little cost. On the other hand, there
2. a. systematic
b. unsystematic
3. No to both questions. The portfolio expected return is a weighted average of the asset’s returns, so it
4. False. The variance of the individual assets is a measure of the total risk. The variance on a well-
5. Yes, the standard deviation can be less than that of every asset in the portfolio. However, p cannot
6. Yes. It is possible, in theory, to construct a zero beta portfolio of risky assets whose return would be
equal to the risk-free rate. It is also possible to have a negative beta; the return would be less than the
7. The covariance is a more appropriate measure of a security’s risk in a well-diversified portfolio
because the covariance reflects the effect of the security on the variance of the portfolio. Investors
8. If we assume that the market has not stayed constant during the past three years, then the lack in
movement of Southern Co.’s stock price only indicates that the stock either has a standard deviation
or a beta that is very near to zero. The large amount of movement in Texas Instruments’ stock price
does not imply that the firm’s beta is high. Total volatility (the price fluctuation) is a function of both
9. The wide fluctuations in the price of oil stocks do not indicate that these stocks are a poor
investment. If an oil stock is purchased as part of a well-diversified portfolio, only its contribution to
the risk of the entire portfolio matters. This contribution is measured by systematic risk or beta.
10. The statement is false. If a security has a negative beta, investors would want to hold the asset to
reduce the variability of their portfolios. Those assets will have expected returns that are lower than
the risk-free rate. To see this, examine the Capital Asset Pricing Model:
Solutions to Questions and Problems
NOTE: All end-of-chapter problems were solved using a spreadsheet. Many problems require multiple
steps. Due to space and readability constraints, when these intermediate steps are included in this
solutions manual, rounding may appear to have occurred. However, the final answer for each problem is
found without rounding during any step in the problem.
Basic
1. The portfolio weight of an asset is total investment in that asset divided by the total portfolio value.
First, we will find the portfolio value, which is:
The portfolio weight for each stock is:
2. The expected return of a portfolio is the sum of the weight of each asset times the expected return of
each asset. The total value of the portfolio is:
So, the expected return of this portfolio is:
3. The expected return of a portfolio is the sum of the weight of each asset times the expected return of
each asset. So, the expected return of the portfolio is:
4. Here we are given the expected return of the portfolio and the expected return of each asset in the
portfolio and are asked to find the weight of each asset. We can use the equation for the expected
return of a portfolio to solve this problem. Since the total weight of a portfolio must equal 1 (100%),
the weight of Stock Y must be one minus the weight of Stock X. Mathematically speaking, this
means:
So, the dollar amount invested in Stock X is the weight of Stock X times the total portfolio value, or:
5. The expected return of an asset is the sum of the probability of each state occurring times the rate of
return if that state occurs. So, the expected return of each stock asset is:
To calculate the standard deviation, we first need to calculate the variance. To find the variance, we
find the squared deviations from the expected return. We then multiply each possible squared
deviation by its probability, and then add all of these up. The result is the variance. So, the variance
and standard deviation of each stock are:
6. The expected return of an asset is the sum of the probability of each return occurring times the
probability of that return occurring. So, the expected return of the stock is:
To calculate the standard deviation, we first need to calculate the variance. To find the variance, we
find the squared deviations from the expected return. We then multiply each possible squared
deviation by its probability, and then add all of these up. The result is the variance. So, the variance
and standard deviation are:
7. The expected return of a portfolio is the sum of the weight of each asset times the expected return of
each asset. So, the expected return of the portfolio is:
If we own this portfolio, we would expect to earn a return of 11.35 percent.
8. a. To find the expected return of the portfolio, we need to find the return of the portfolio in each
state of the economy. This portfolio is a special case since all three assets have the same weight.
To find the expected return in an equally weighted portfolio, we can sum the returns of each
asset and divide by the number of assets, so the expected return of the portfolio in each state of
the economy is:
To find the expected return of the portfolio, we multiply the return in each state of the economy
b. This portfolio does not have an equal weight in each asset. We still need to find the return of the
portfolio in each state of the economy. To do this, we will multiply the return of each asset by
its portfolio weight and then sum the products to get the portfolio return in each state of the
economy. Doing so, we get:
And the expected return of the portfolio is:
To find the variance, we find the squared deviations from the expected return. We then multiply
each possible squared deviation by its probability, and then add all of these up. The result is the
9. a. This portfolio does not have an equal weight in each asset. We first need to find the return of
the portfolio in each state of the economy. To do this, we will multiply the return of each asset
by its portfolio weight and then sum the products to get the portfolio return in each state of the
economy. Doing so, we get:
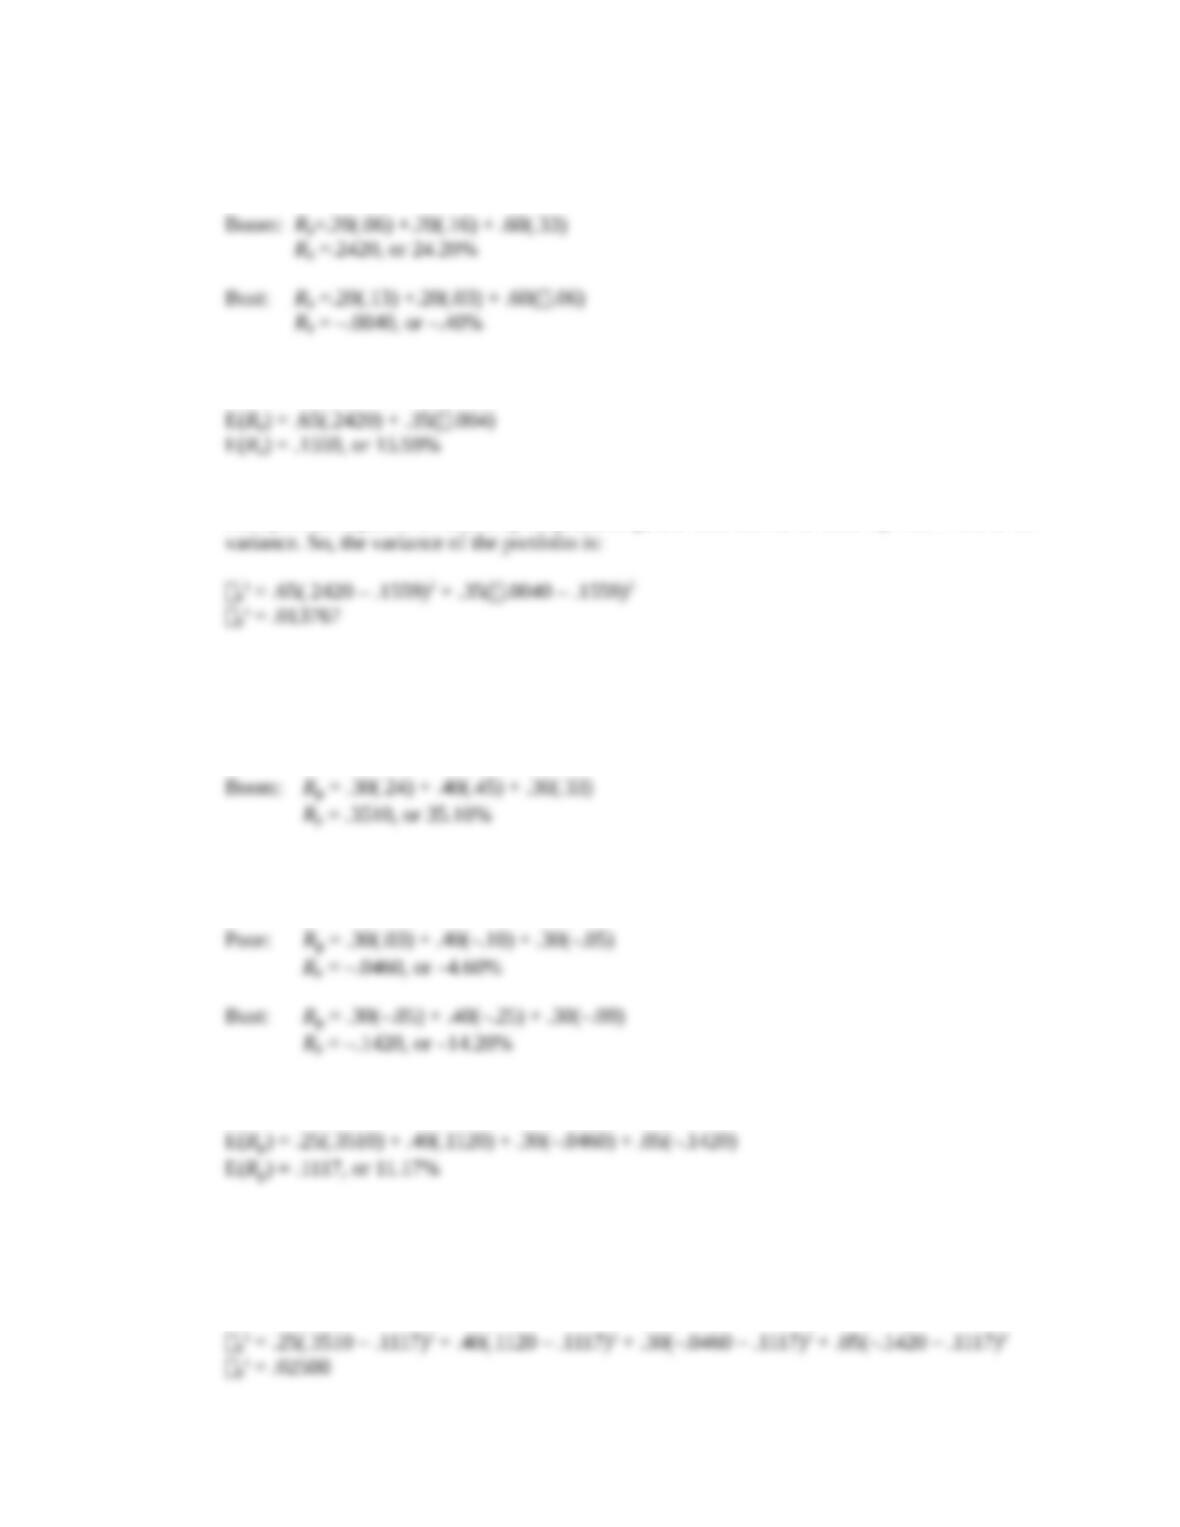
Good: Rp = .30(.09) + .40(.10) + .30(.15)
Rp = .1120, or 11.20%
And the expected return of the portfolio is:
b. To calculate the standard deviation, we first need to calculate the variance. To find the variance,
we find the squared deviations from the expected return. We then multiply each possible
squared deviation by its probability, and then add all of these up. The result is the variance. So,
the variance and standard deviation of the portfolio are:
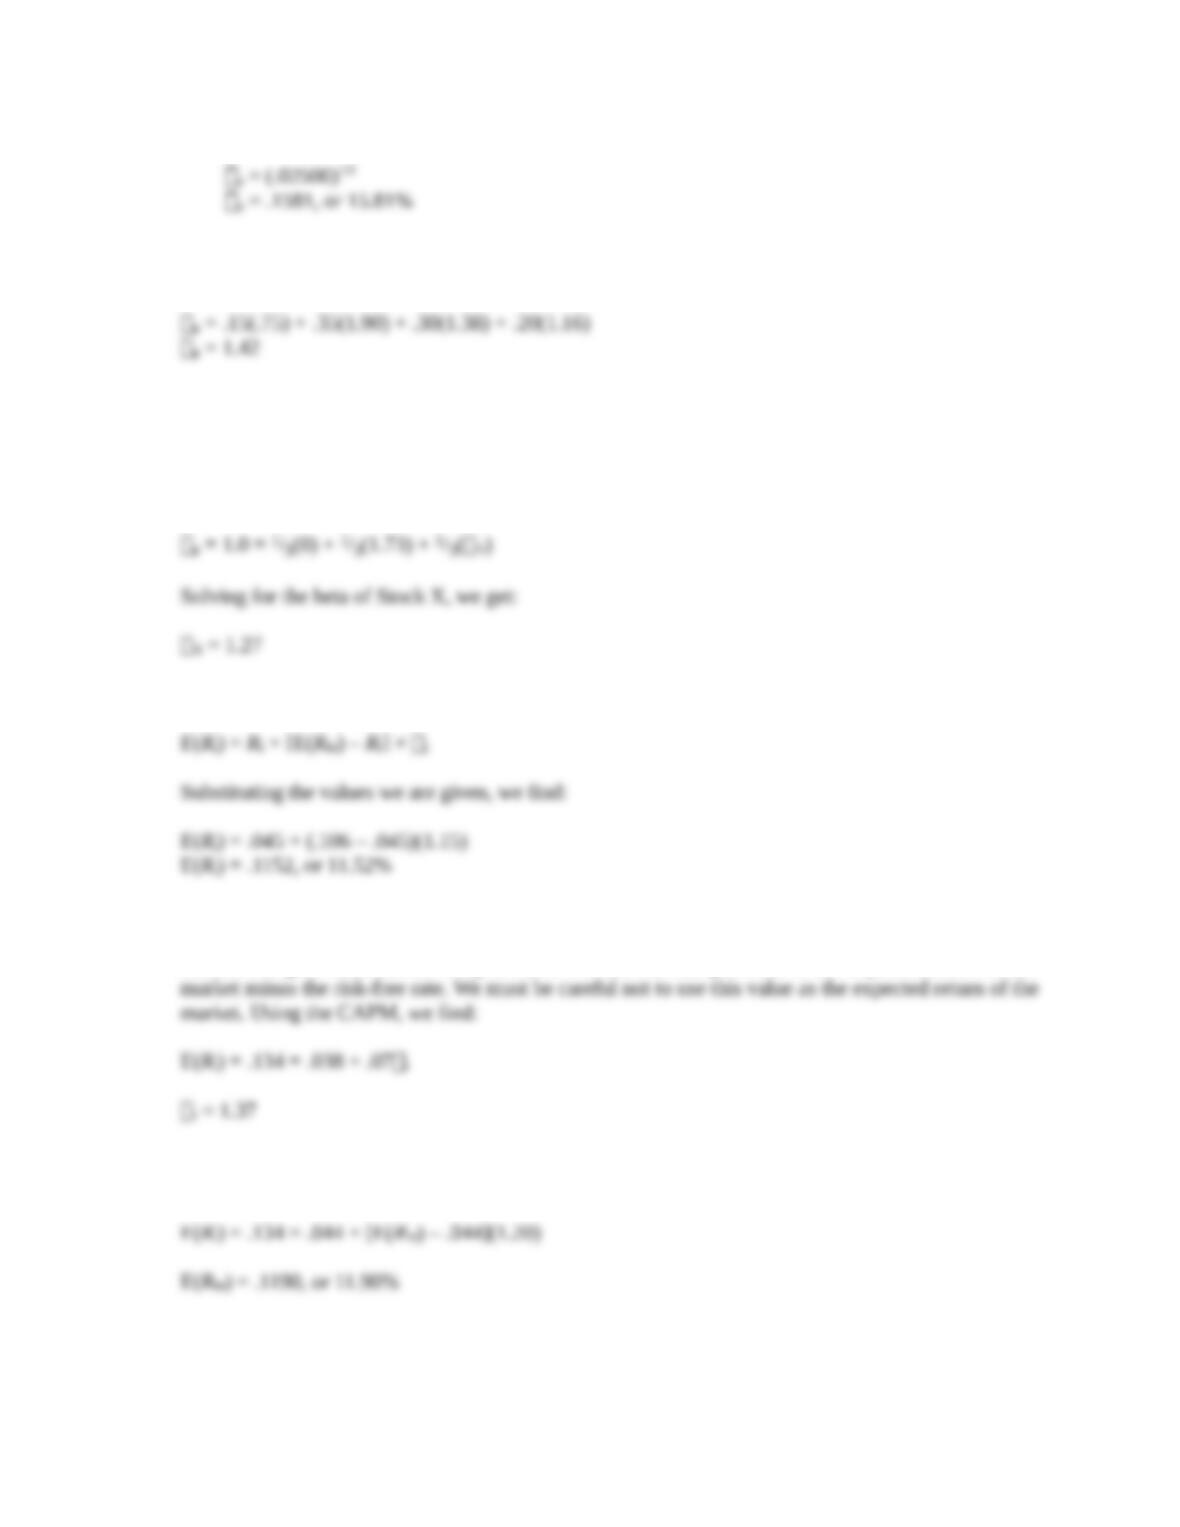
10. The beta of a portfolio is the sum of the weight of each asset times the beta of each asset. So, the
beta of the portfolio is:
11. The beta of a portfolio is the sum of the weight of each asset times the beta of each asset. If the
portfolio is as risky as the market it must have the same beta as the market. Since the beta of the
market is one, we know the beta of our portfolio is one. We also need to remember that the beta of
the risk-free asset is zero. It has to be zero since the asset has no risk. Setting up the equation for the
beta of our portfolio, we get:
12. CAPM states the relationship between the risk of an asset and its expected return. CAPM is:
13. We are given the values for the CAPM except for the of the stock. We need to substitute these
values into the CAPM, and solve for the of the stock. One important thing we need to realize is
that we are given the market risk premium. The market risk premium is the expected return of the
14. Here we need to find the expected return of the market using the CAPM. Substituting the values
given, and solving for the expected return of the market, we find:
15. Here we need to find the risk-free rate using the CAPM. Substituting the values given, and solving
for the risk-free rate, we find:
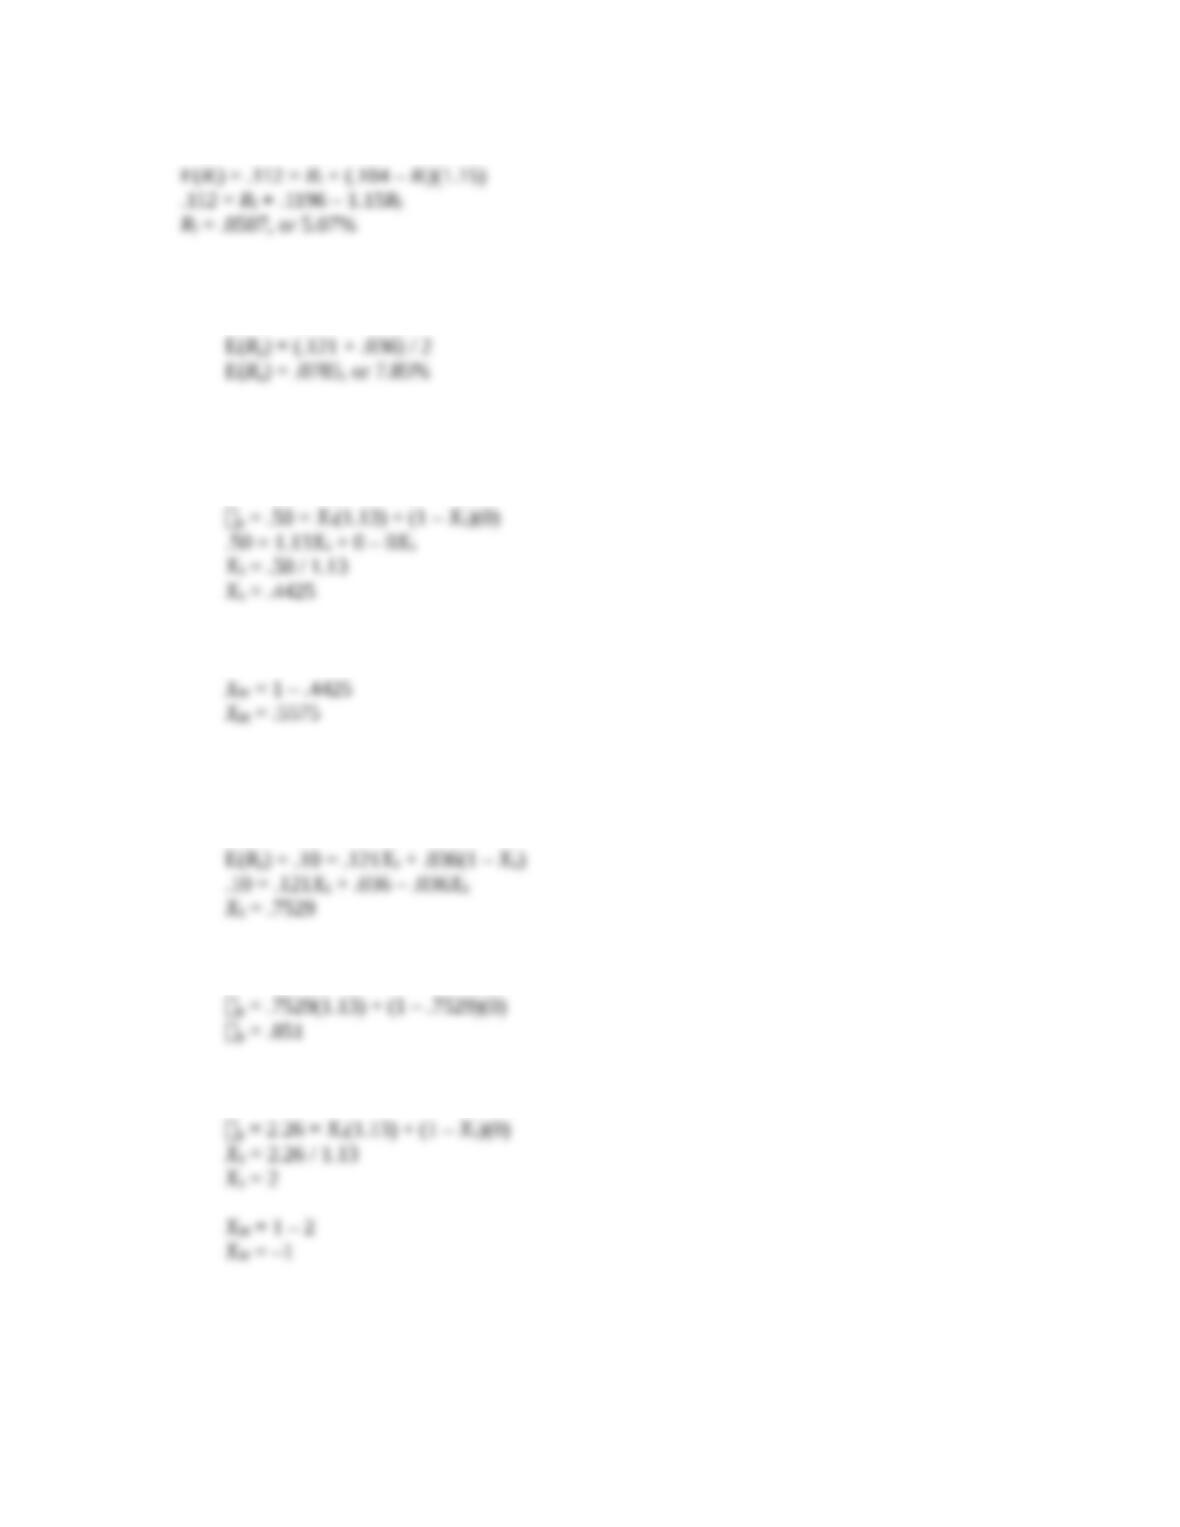
16. a. We have a special case where the portfolio is equally weighted, so we can sum the returns of
each asset and divide by the number of assets. The expected return of the portfolio is:
b. We need to find the portfolio weights that result in a portfolio with a of .50. We know the of
the risk-free asset is zero. We also know the weight of the risk-free asset is one minus the
weight of the stock since the portfolio weights must sum to one, or 100 percent. So:
And, the weight of the risk-free asset is:
c. We need to find the portfolio weights that result in a portfolio with an expected return of 10
percent. We also know the weight of the risk-free asset is one minus the weight of the stock
since the portfolio weights must sum to one, or 100 percent. So:
So, the of the portfolio will be:
d. Solving for the of the portfolio as we did in part b, we find:
The portfolio is invested 200% in the stock and –100% in the risk-free asset. This represents
borrowing at the risk-free rate to buy more of the stock.
17. First, we need to find the of the portfolio. The of the risk-free asset is zero, and the weight of the
risk-free asset is one minus the weight of the stock, so the of the portfolio is:
ßp = XW(1.2) + (1 – XW)(0) = 1.2XW
So, to find the of the portfolio for any weight of the stock, we multiply the weight of the stock
times its .
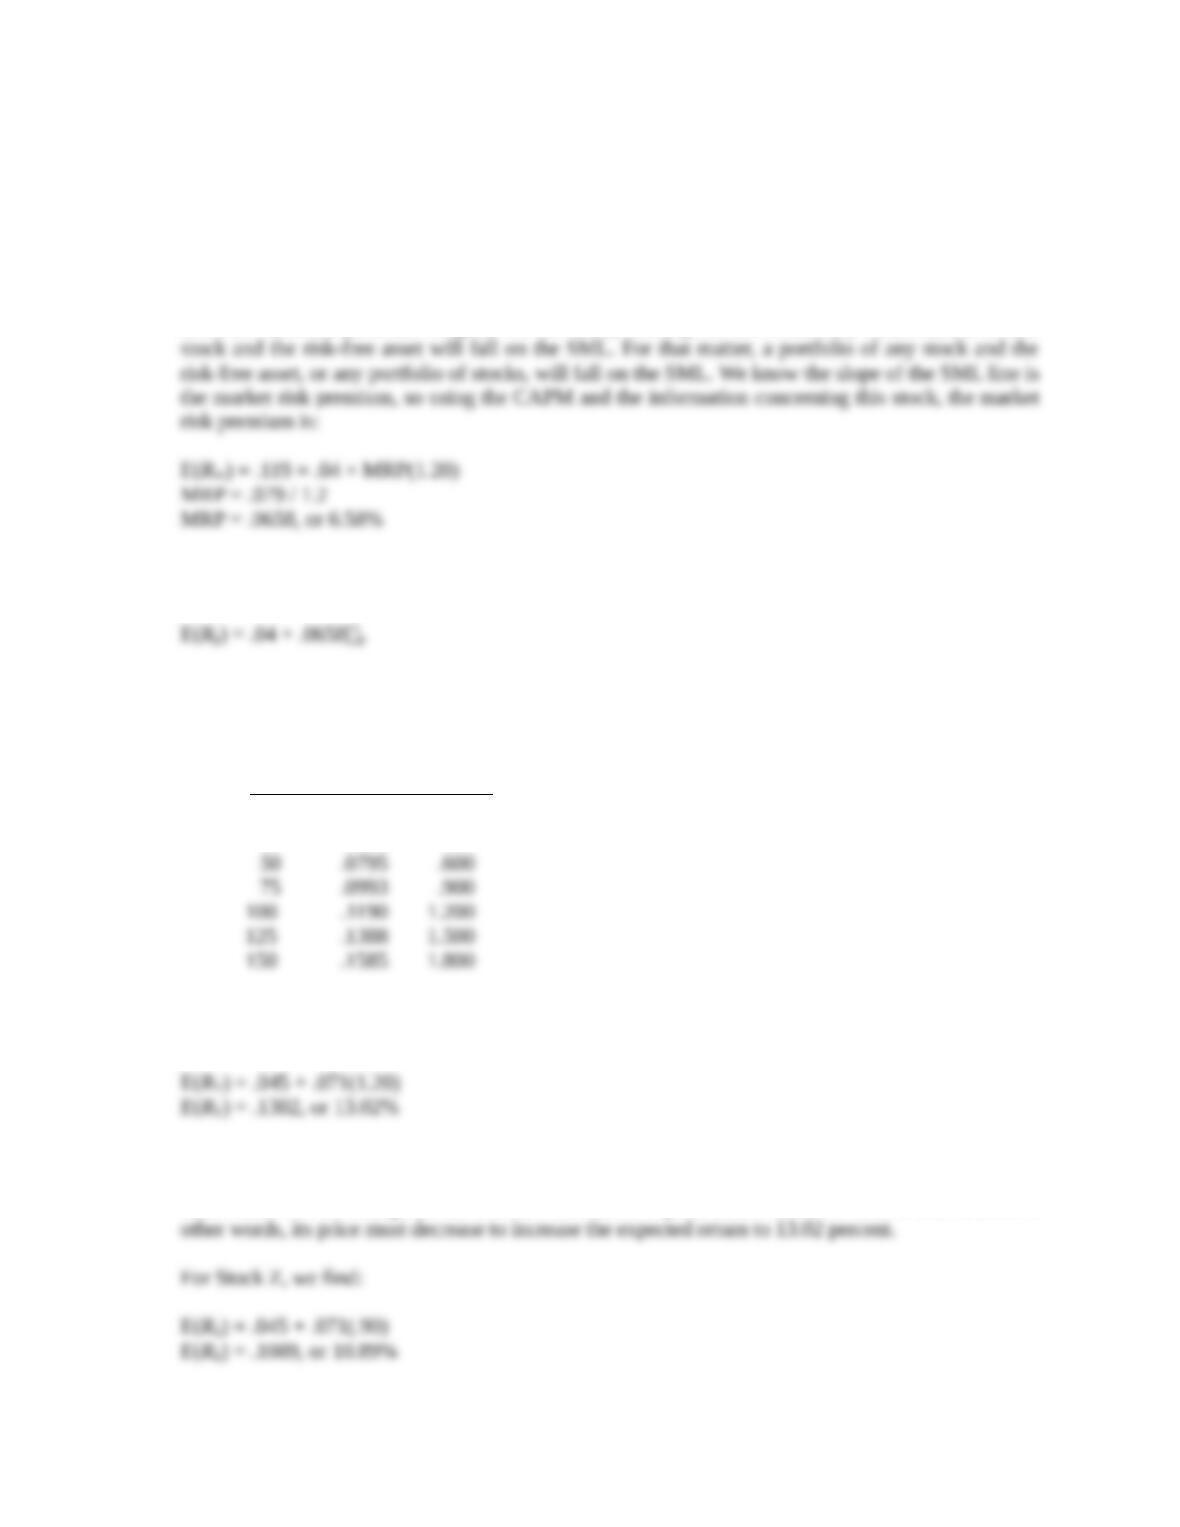
Even though we are solving for the and expected return of a portfolio of one stock and the risk-free
asset for different portfolio weights, we are really solving for the SML. Any combination of this
So, now we know the CAPM equation for any stock is:
The slope of the SML is equal to the market risk premium, which is .0658. Using these equations to
fill in the table, we get the following results:
XWE(Rp) ßp
0% .0400 0
25 .0598 .300
18. There are two ways to correctly answer this question. We will work through both. First, we can use
the CAPM. Substituting in the value we are given for each stock, we find:
It is given in the problem that the expected return of Stock Y is 12.7 percent, but according to the
CAPM, the return of the stock based on its level of risk should be 13.02 percent. This means the
stock return is too low, given its level of risk. Stock Y plots below the SML and is overvalued. In
The return given for Stock Z is 11.1 percent, but according to the CAPM the expected return of the
We can also answer this question using the reward-to-risk ratio. All assets must have the same
reward-to-risk ratio, that is, every asset must have the same ratio of the asset risk premium to its
beta. This follows from the linearity of the SML in Figure 11.11. The reward-to-risk ratio is the risk
The reward-to-risk ratio for Stock Y is too low, which means the stock plots below the SML, and the
stock is overvalued. Its price must decrease until its reward-to-risk ratio is equal to the market
reward-to-risk ratio. For Stock Z, we find:
19. We need to set the reward-to-risk ratios of the two assets equal to each other (see the previous
problem), which is:
(.127 – Rf) / 1.20 = (.111 – Rf) / .90
We can cross multiply to get: