1. c 6.
2. e 7.
3. c 8.
4. b 9.
5. a 10.
2014 2013 2012 2011 2010
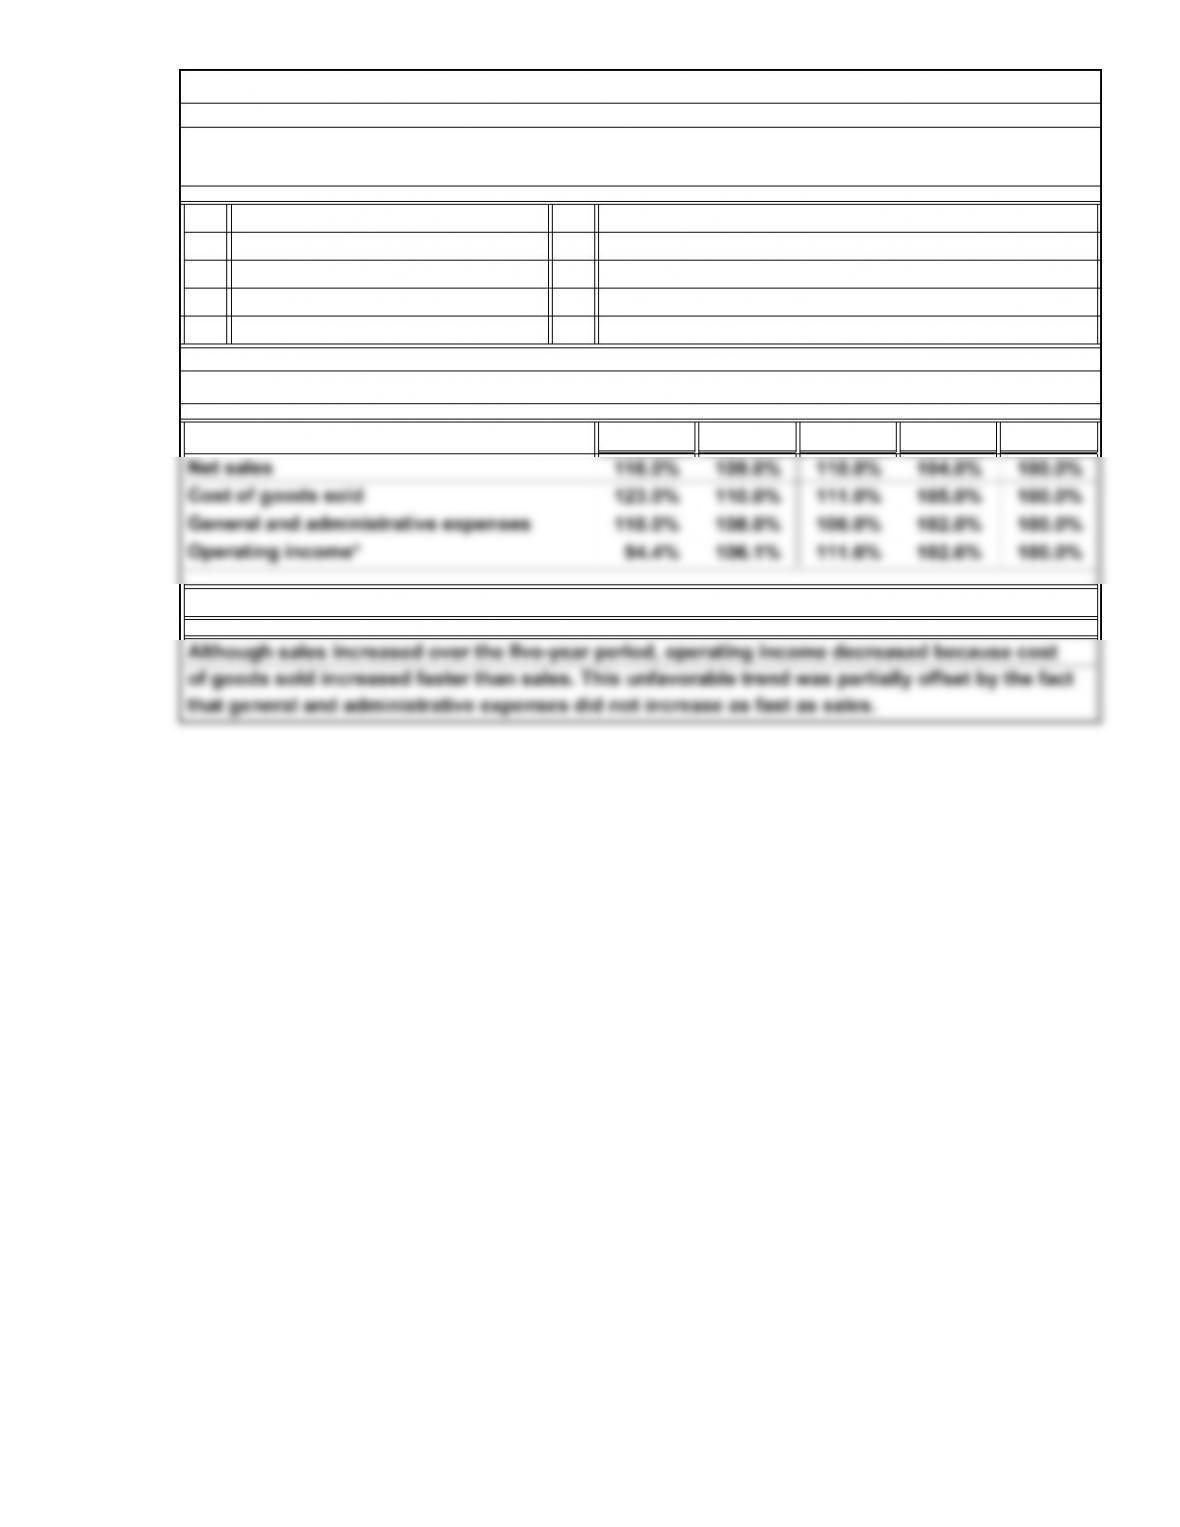
*Rounded
Exercises: Set A
d
b
E2A. Trend Analysis
d
a
E1A. Issues in Financial Performance Evaluation: Objectives, Standards, Sources of Information,
and Executive Compensation
d
16-11
© 2014 Cengage Learning. All Rights Reserved. May not be scanned, copied, duplicated, or posted to a publicly accessible website, in whole or in part.
2014 2013 Amount Percentage*
2014 2013
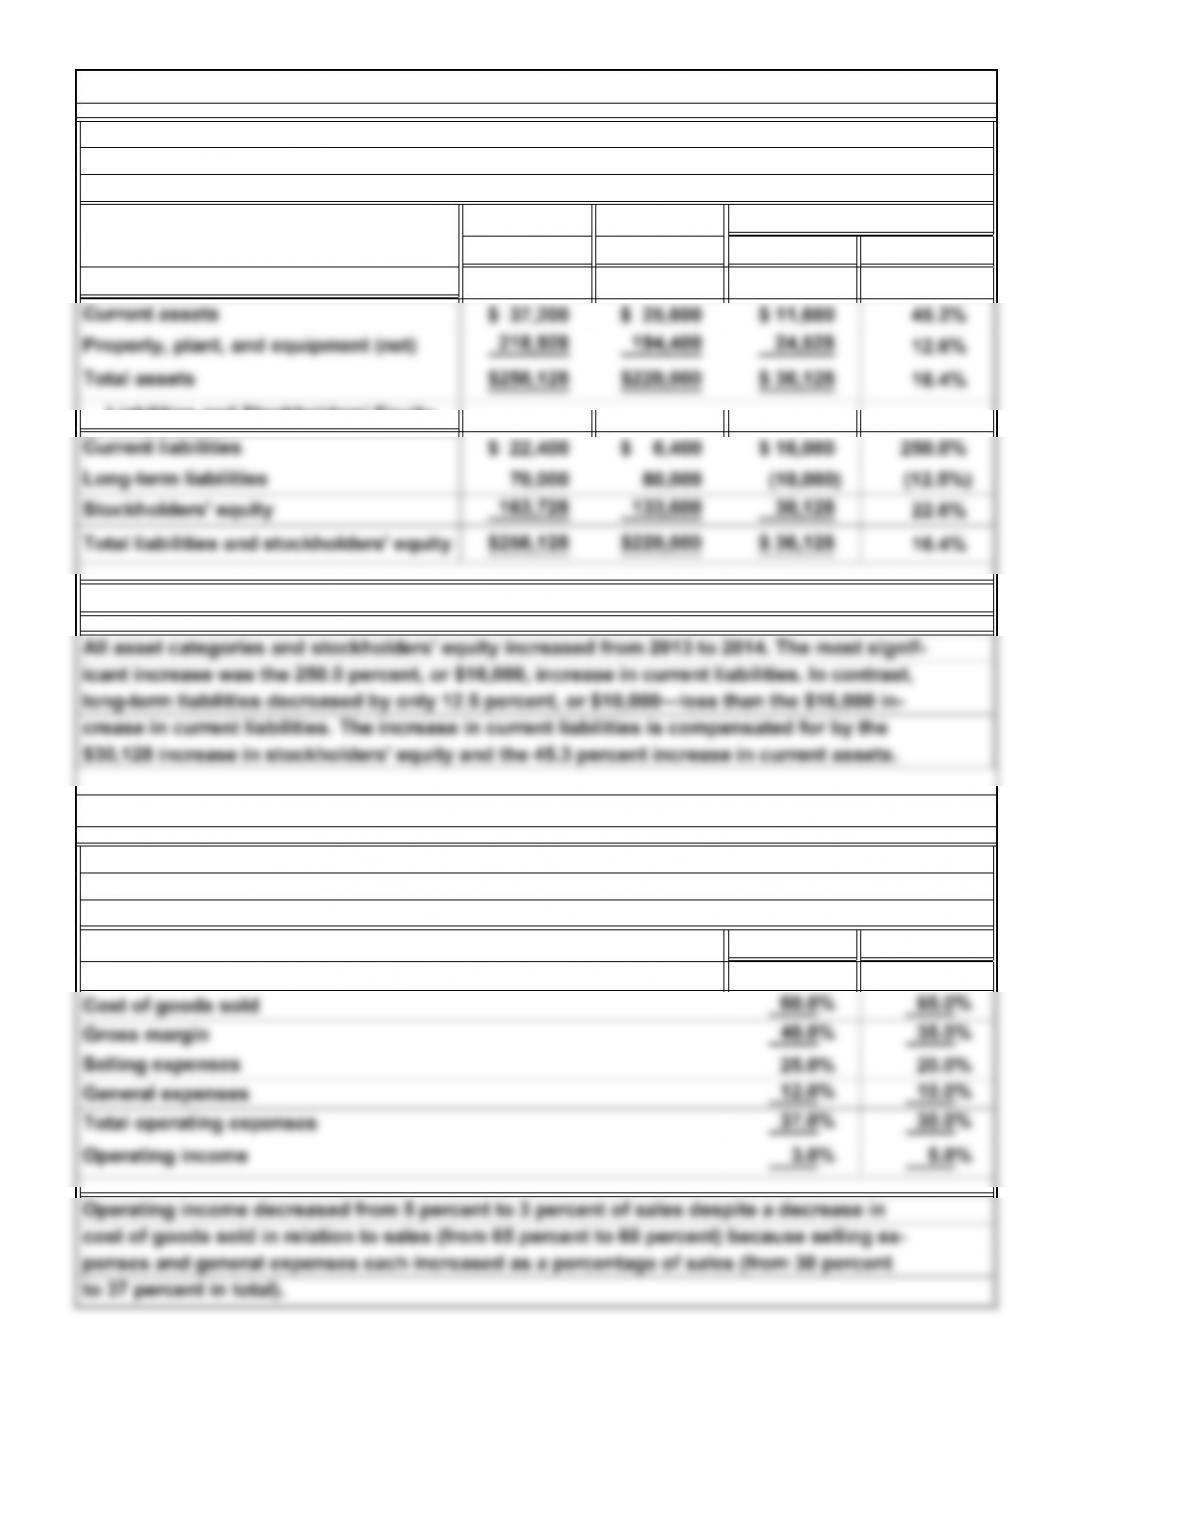
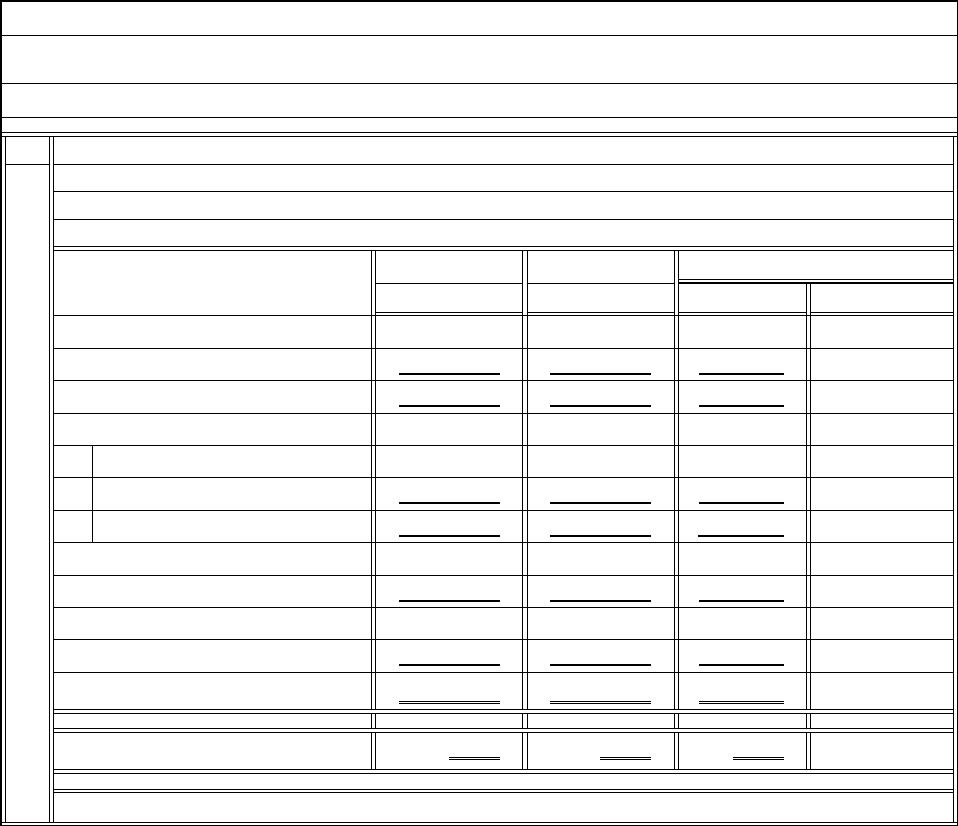
100.0% 100.0%
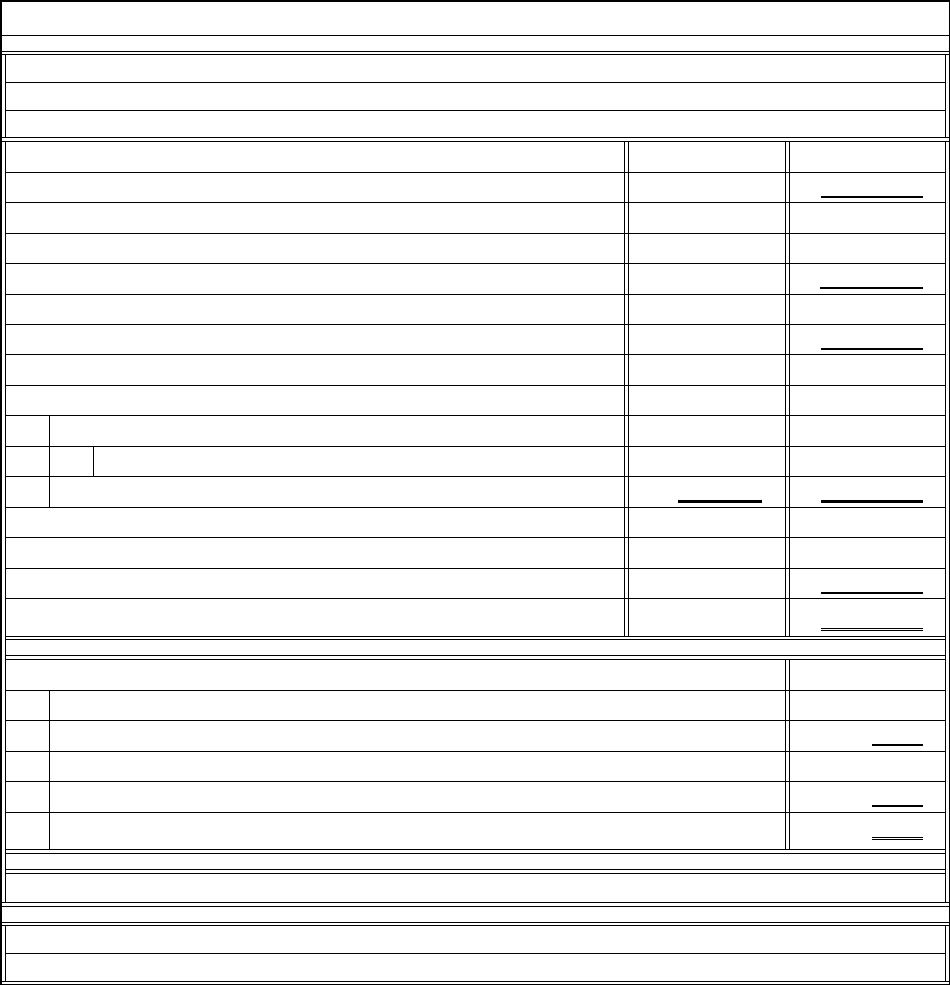
crease in current liabilities. The increase in current liabilities is compensated for by the
All asset categories and stockholders’ equity increased from 2013 to 2014. The most signif-
icant increase was the 250.0 percent, or $16,000, increase in current liabilities. In contrast,
Comparative Balance Sheets
December 31, 2014 and 2013
Increase or Decrease
E3A. Horizontal Analysis
Rivera Company
*Rounded
Assets
Rivera Company
E4A. Vertical Analysis
For the Years Ended December 31, 2014 and 2013
Net sales
Common-Size Income Statements
16-12
© 2014 Cengage Learning. All Rights Reserved. May not be scanned, copied, duplicated, or posted to a publicly accessible website, in whole or in part.
++ ++
==
45.5=
times days*
$17,200
Quick ratio
times*
$40,000
$13,600
times=
$40,000 times
Receivables
turnover
2.2
$35,600
$28,200
1.6 times*
$7,200 $10,400
$28,200
3.0 4.0
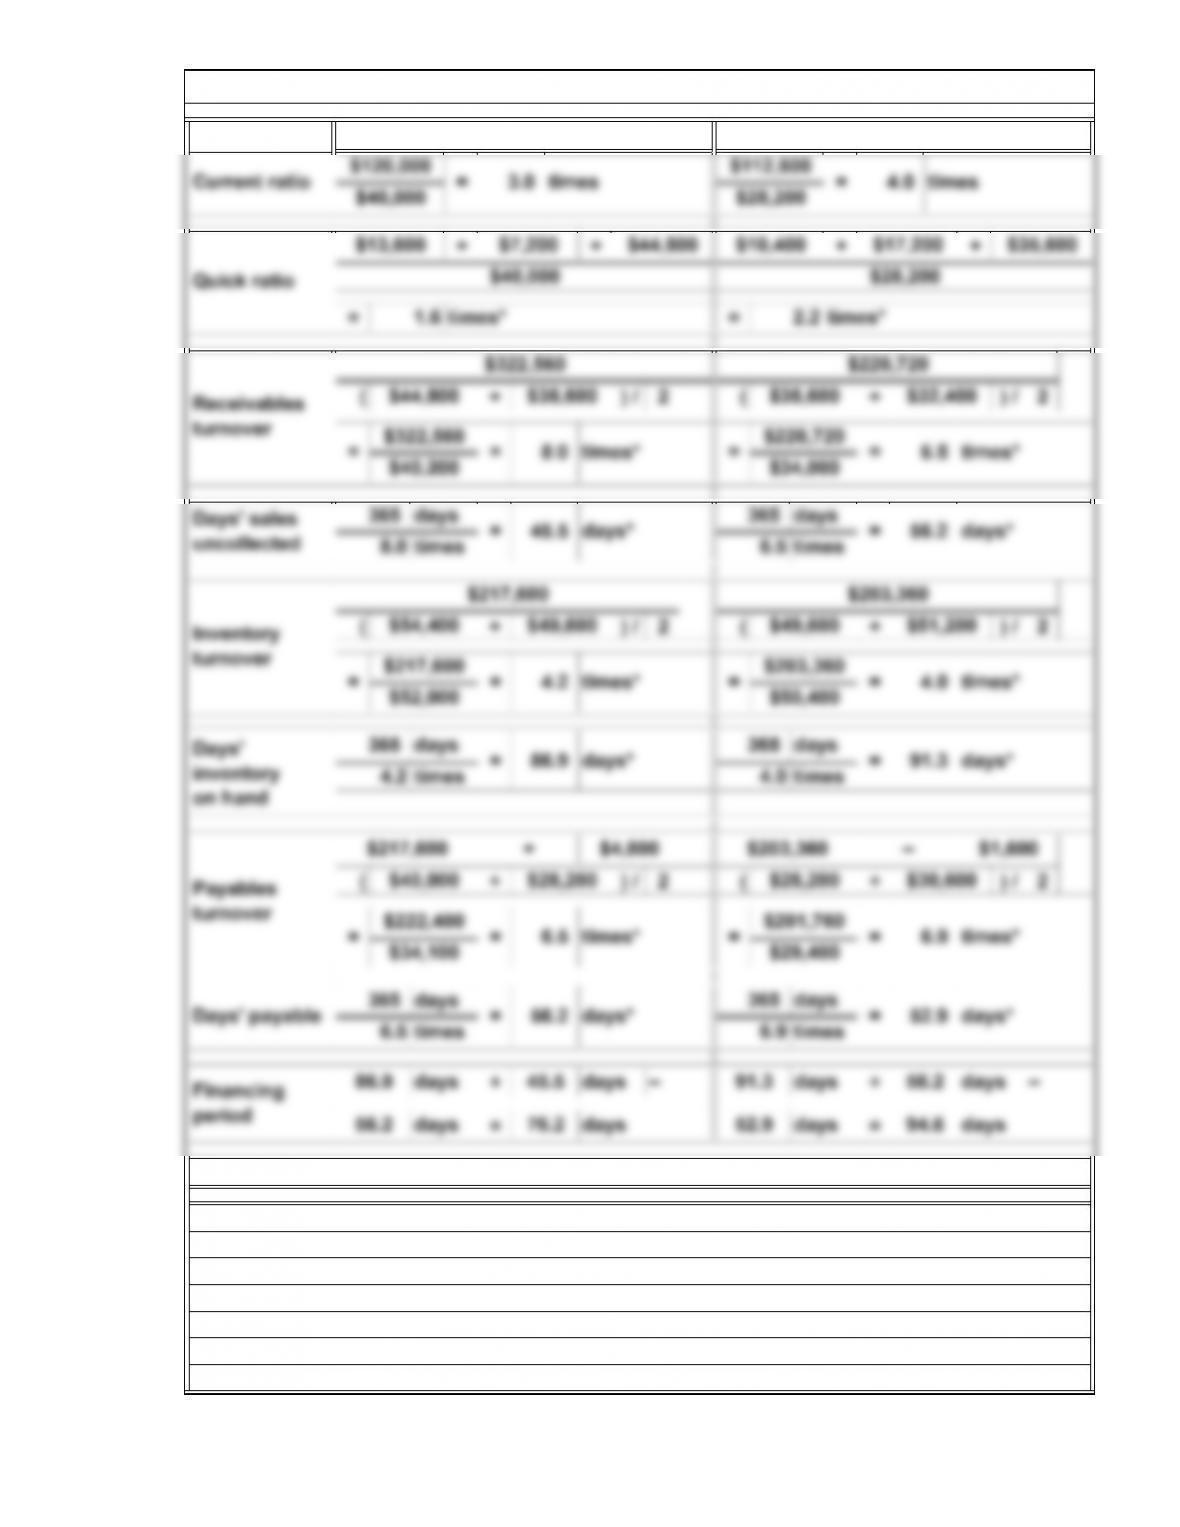
76.2 days. This is a favorable development.
=
ratio (from 2.2 to 1.6). Also, its payables turnover and days’ payable were less favorable
6.58.0 56.2
in 2014 than in 2013. However, the operating cycle declined from 147.5 days (56.2 + 91.3)
orated, probably because of decreases in the current ratio (from 4.0 to 3.0) and the quick
Current ratio
2014
*Rounded
to 132.4 days (45.5 + 86.9). The required days of financing decreased from 94.6 days to
Although Posad Company’s receivables turnover, inventory turnover, days’ sales uncol-
lected, and days’ inventory on hand improved, its operating asset management deteri-
$44,800
2013
=
times days*
uncollected
E5A. Operating Asset Management Analysis
16-13
© 2014 Cengage Learning. All Rights Reserved. May not be scanned, copied, duplicated, or posted to a publicly accessible website, in whole or in part.
times=
times= –
times
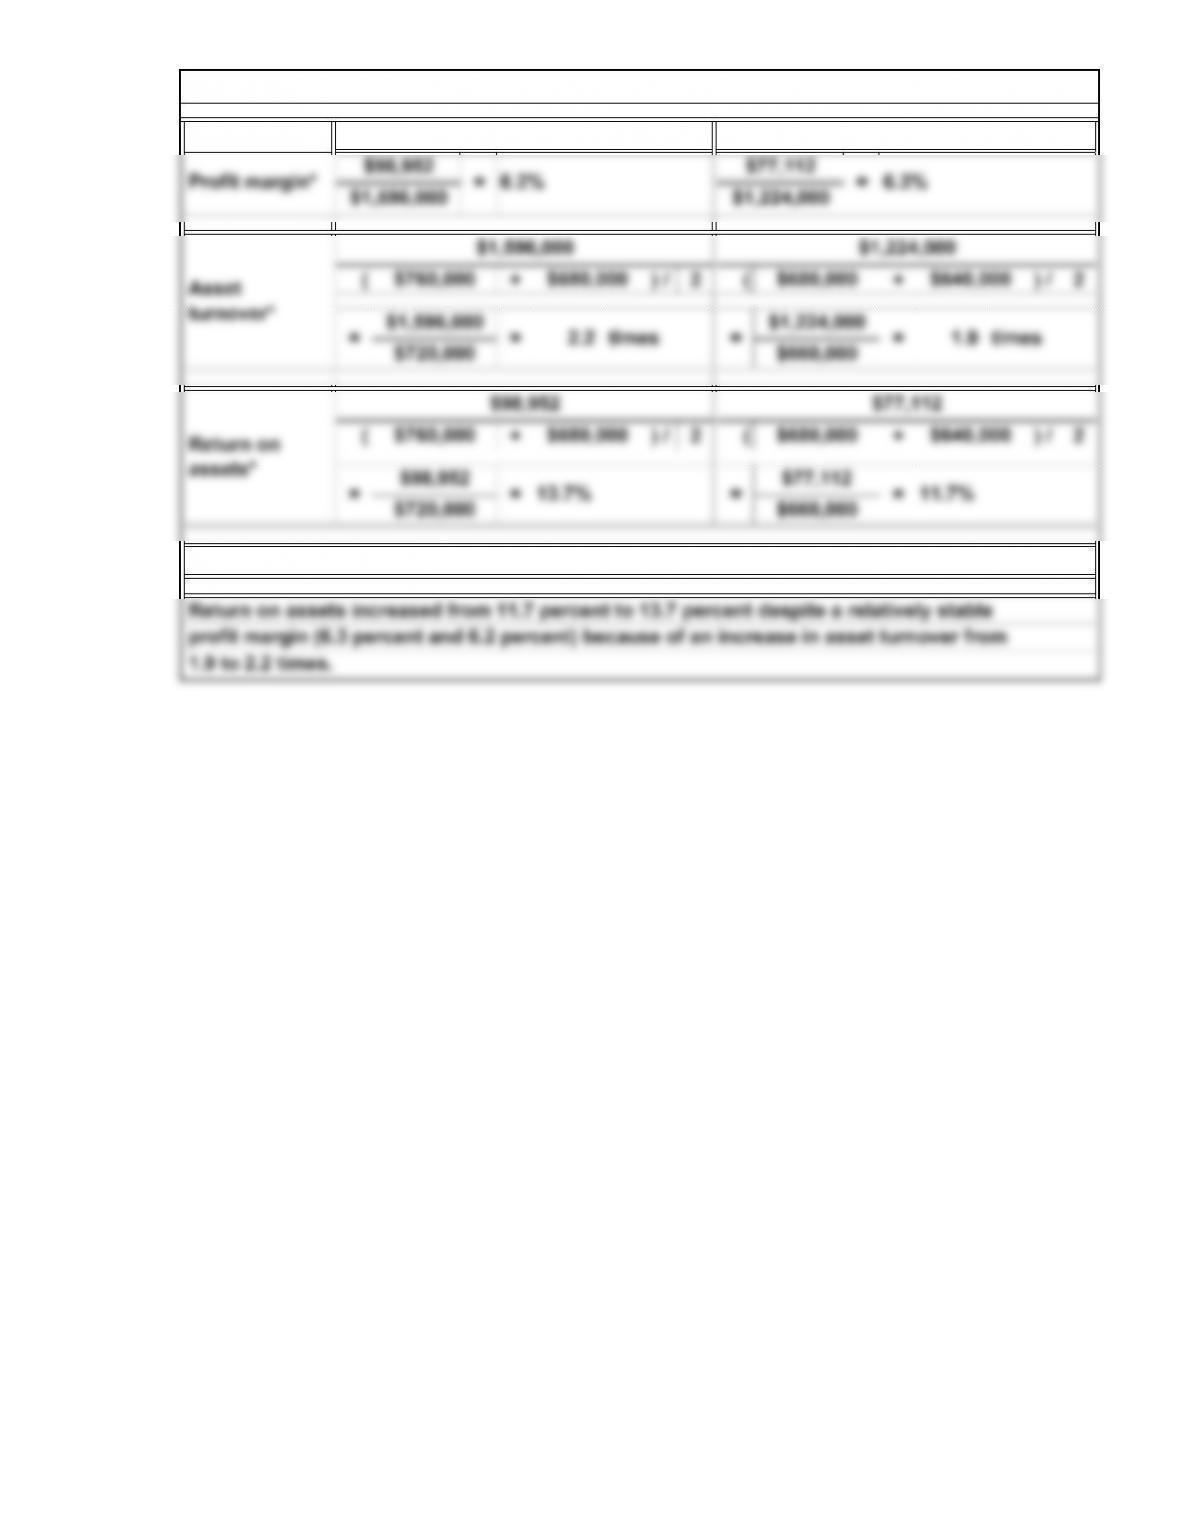
profit margin (6.3 percent and 6.2 percent) because of an increase in asset turnover from
1.9 to 2.2 times.
E7A. Profitability and Total Asset Management Analysis
2013
2014
16-15
© 2014 Cengage Learning. All Rights Reserved. May not be scanned, copied, duplicated, or posted to a publicly accessible website, in whole or in part.
=
9.5
Price/earnings
(P/E) ratio
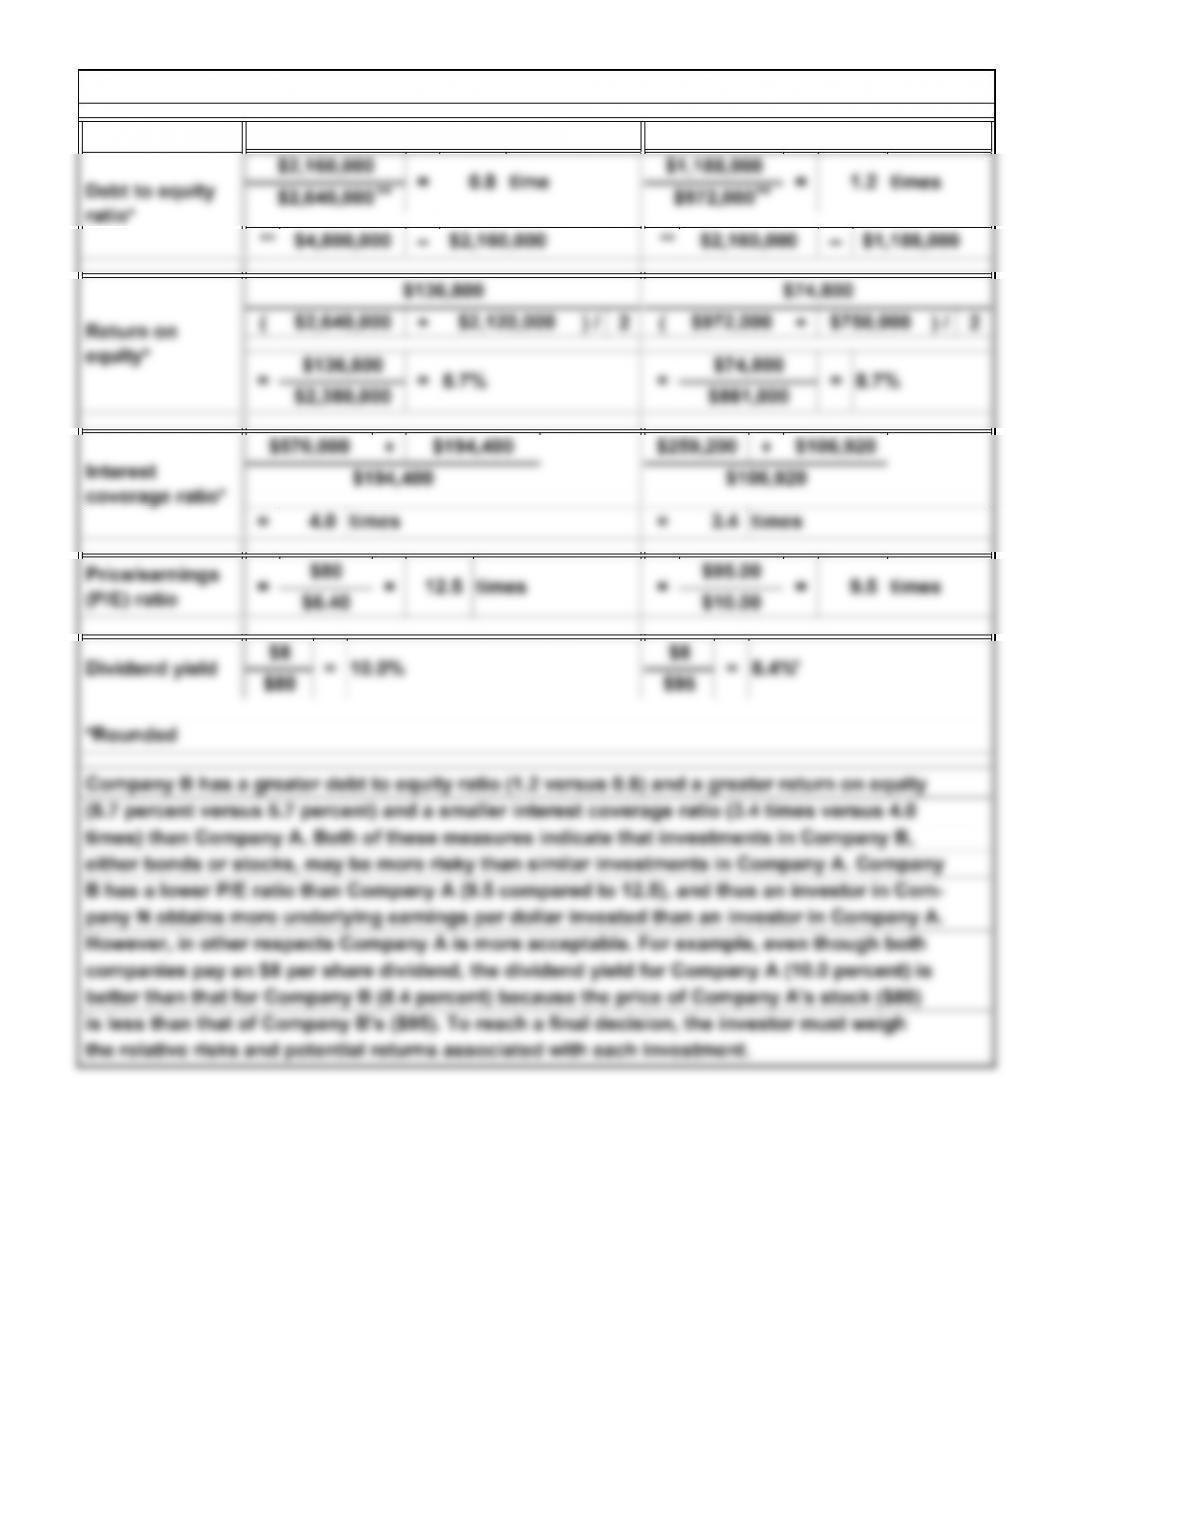
E8A. Financial Risk and Market Strength Ratios
Company B
However, in other respects Company A is more acceptable. For example, even though both
times) than Company A. Both of these measures indicate that investments in Company B,
Company B has a greater debt to equity ratio (1.2 versus 0.8) and a greater return on equity
*Rounded
B has a lower P/E ratio than Company A (9.5 compared to 12.5), and thus an investor in Com-
companies pay an $8 per share dividend, the dividend yield for Company A (10.0 percent) is
pany N obtains more underlying earnings per dollar invested than an investor in Company A.
=
better than that for Company B (8.4 percent) because the price of Company A’s stock ($80)
is less than that of Company B’s ($95). To reach a final decision, the investor must weigh
either bonds or stocks, may be more risky than similar investments in Company A. Company
ratio*
Return on
equity*
Company A
the relative risks and potential returns associated with each investment.
$106,920
= times
12.5 times $95.00
$10.00
$194,400
$6.40
$80
Interest
coverage ratio*
=
16-16
© 2014 Cengage Learning. All Rights Reserved. May not be scanned, copied, duplicated, or posted to a publicly accessible website, in whole or in part.
(+) /2
=–– =
1.
( $47,500 – $45,000
2.
( $43,000 – $45,000
3.
4.
5.
E9A. Liquidity Analysis
=
$456,000
$456,000 15.2%
$352,000
$2,890,000
1.3
$456,000
$3,120,000
$456,000
=
=
$3,005,000
$298,000 $38,000$120,000
=
E10A. Effect of Alternative Accounting Methods
*Rounded
Cash flow yield
Cash flows to sales
Cash flows to assets
Free cash flow
$19,500
2,500
)
Net income under FIFO
$17,000Net income under average-cost method
Difference between FIFO and average-cost inventory
$15,000
(2,000)
Net income under LIFO
$17,000Net income under average-cost method
Difference between average-cost and LIFO inventory
)
Most accountants would consider the LIFO method the more conservative procedure
because it yields a lower asset value and a lower net income (in a period of rising
No, the choice of LIFO will not violate the consistency convention. Because this is
the company’s first year of operation, there has been no change in methods.
prices).
in the financial statements.
Yes, the full-disclosure convention requires disclosure of the inventory method used
= times*
$3,200,000
$456,000 14.3%*
*
16-17
© 2014 Cengage Learning. All Rights Reserved. May not be scanned, copied, duplicated, or posted to a publicly accessible website, in whole or in part.
$3,800,000
2,100,000
$1,700,000
$ 100,000
80,000
180,000
$1,520,000
600,000
$ 920,000
(net of taxes, $60,000) $(100,000)
(70,000) (170,000)
$ 750,000
25,000
$ 775,000
Income taxes expense
Income from continuing operations
Cost of goods sold
Operating expenses:
Selling expenses
Stream Toy Corporation
Income from continuing operations before
Net sales
Total operating expenses
Income Statement
Discontinued operations:
E11A. Corporate Income Statement
Gross margin
Loss from operations of discontinued segment
For the Year Ended June 30, 2014
Administrative expenses
income taxes
Loss on disposal of segment (net of taxes, $26,000)
Income before extraordinary items
Extraordinary gain (net of taxes, $7,000)
Net income
16-18
© 2014 Cengage Learning. All Rights Reserved. May not be scanned, copied, duplicated, or posted to a publicly accessible website, in whole or in part.
$1,110,000
550,000
$ 560,000
(225,000)
(110,000)
$ 225,000
67,500
$ 157,500
(net of taxes, $48,000) $112,000
98,000 210,000
$ 367,500
50,400
$ 417,900
$0.79
1.05
$1.84
0.25
$2.09
Earnings per common share:*
Income from continuing operations
Discontinued operations (net of taxes)
Income before extraordinary items
Note to Instructor: Solutions for Exercises: Set B are provided separately on the Instructor’s
Extraordinary gain (net of taxes)
Net income
*Rounded
Gain on disposal of segment (net of taxes, $42,000)
Income before extraordinary items
Extraordinary gain on retirement of bonds (net of taxes,
$21,600)
Net Income
Income from continuing operations
Discontinued operations:
Income from operations of discontinued segment
Sales
Cost of goods sold
Gross margin
Operating expenses
Restructuring
Income from continuing operations before income taxes
Income taxes expense
Van Corporation
Income Statement
For the Year Ended December 31, 2014
Resource CD and website.
E12A. Corporate Income Statement
16-19
© 2014 Cengage Learning. All Rights Reserved. May not be scanned, copied, duplicated, or posted to a publicly accessible website, in whole or in part.
1.
2014 2013 Amount Percentage*
$3,276,800 $3,146,400 $130,400 4.1%
2,088,800 2,008,400 80,400 4.0%
$1,188,000 $1,138,000 $ 50,000 4.4%
Selling expenses $ 476,800 $ 518,000 $ (41,200) (8.0%)
Administrative expenses 447,200 423,200 24,000 5.7%
Total operating expenses $ 924,000 $ 941,200 $ (17,200) (1.8%)
$ 264,000 $ 196,800 $ 67,200 34.1%
65,600 39,200 26,400 67.3%
$ 198,400 $ 157,600 $ 40,800 25.9%
62,400 56,800 5,600 9.9%
$ 136,000 $ 100,800 $ 35,200 34.9%
$3.40 $2.52 $0.88 34.9%
Increase or Decrease
Cost of goods sold
Net income
Income from operations
Gross margin
Interest expense
Operating expenses:
Income before income taxes
Income taxes expense
For the Years Ended December 31, 2014 and 2013
Comparative Income Statements
Earnings per share
Problems
P1. Horizontal and Vertical Analysis
Obras Corporation
(in thousands of dollars)
*Rounded
Net sales
16-20
© 2014 Cengage Learning. All Rights Reserved. May not be scanned, copied, duplicated, or posted to a publicly accessible website, in whole or in part.