DQ1.
DQ2.
DQ3.
DQ4.
DQ9.
DQ10.
are full values similar to those at year end. Thus, any ratios that use data from the
income statement or statement of cash flows as their basis will be less than they
increase in receivables.
On quarterly financial statements, all numbers on the income statement and state-
CHAPTER 16—Solutions
analysis will be different each year.
A limitation of using past performance as a benchmark is that it may not be a good
Discussion Questions
In a five-year trend analysis for a new five-year period, the base year changes.
A company’s past performance indicates whether performance is improving, but
may not be strictly comparable with other companies in the industry.
industry norms tell how well a company is performing in relation to its peer group.
measure of present needs. A limitation of using industry norms is that the company
If the overall financial plan is expected to increase the owners’ wealth, then linking
Unless two successive base years have exactly the same dollar values, the trend
own and the owners’ best interests.
Many companies attempt to improve their earnings per share by reducing the num-
ber of shares outstanding through buybacks of their own stock.
managers’ compensation to financial targets encourages managers to act in their
receivable to finance. Consequently, the company needs more cash to cover the
When receivable turnover decreases, it means that the company has more days’
FINANCIAL STATEMENT ANALYSIS
16-1
© 2014 Cengage Learning. All Rights Reserved. May not be scanned, copied, duplicated, or posted to a publicly accessible website, in whole or in part.
1. c 4.
2. b 5.
3. a 6.
1. c 4.
2. a 5.
3. d
2014 2013 2012
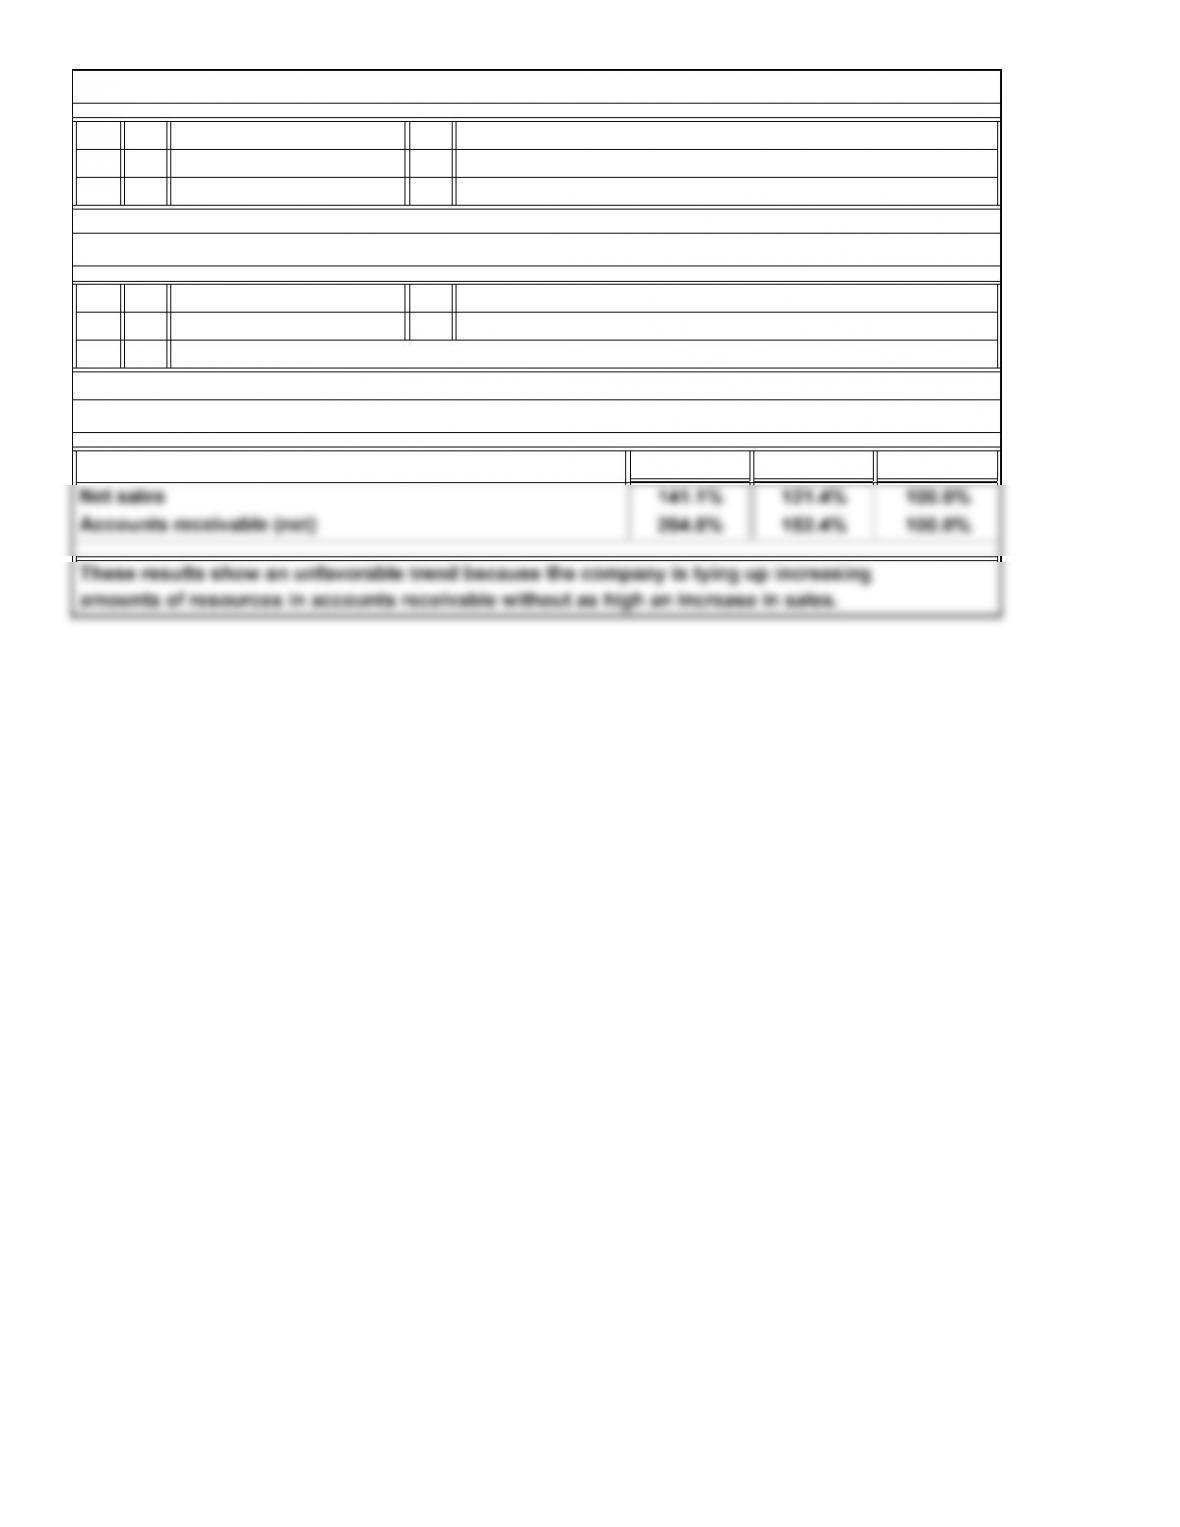
SE3. Trend Analysis
SE1. Objectives and Standards of Financial Performance Evaluation
b
SE2. Sources of Information
b
a
c
c
16-2
© 2014 Cengage Learning. All Rights Reserved. May not be scanned, copied, duplicated, or posted to a publicly accessible website, in whole or in part.
2014 2013 Amount Percentage
2014 2013
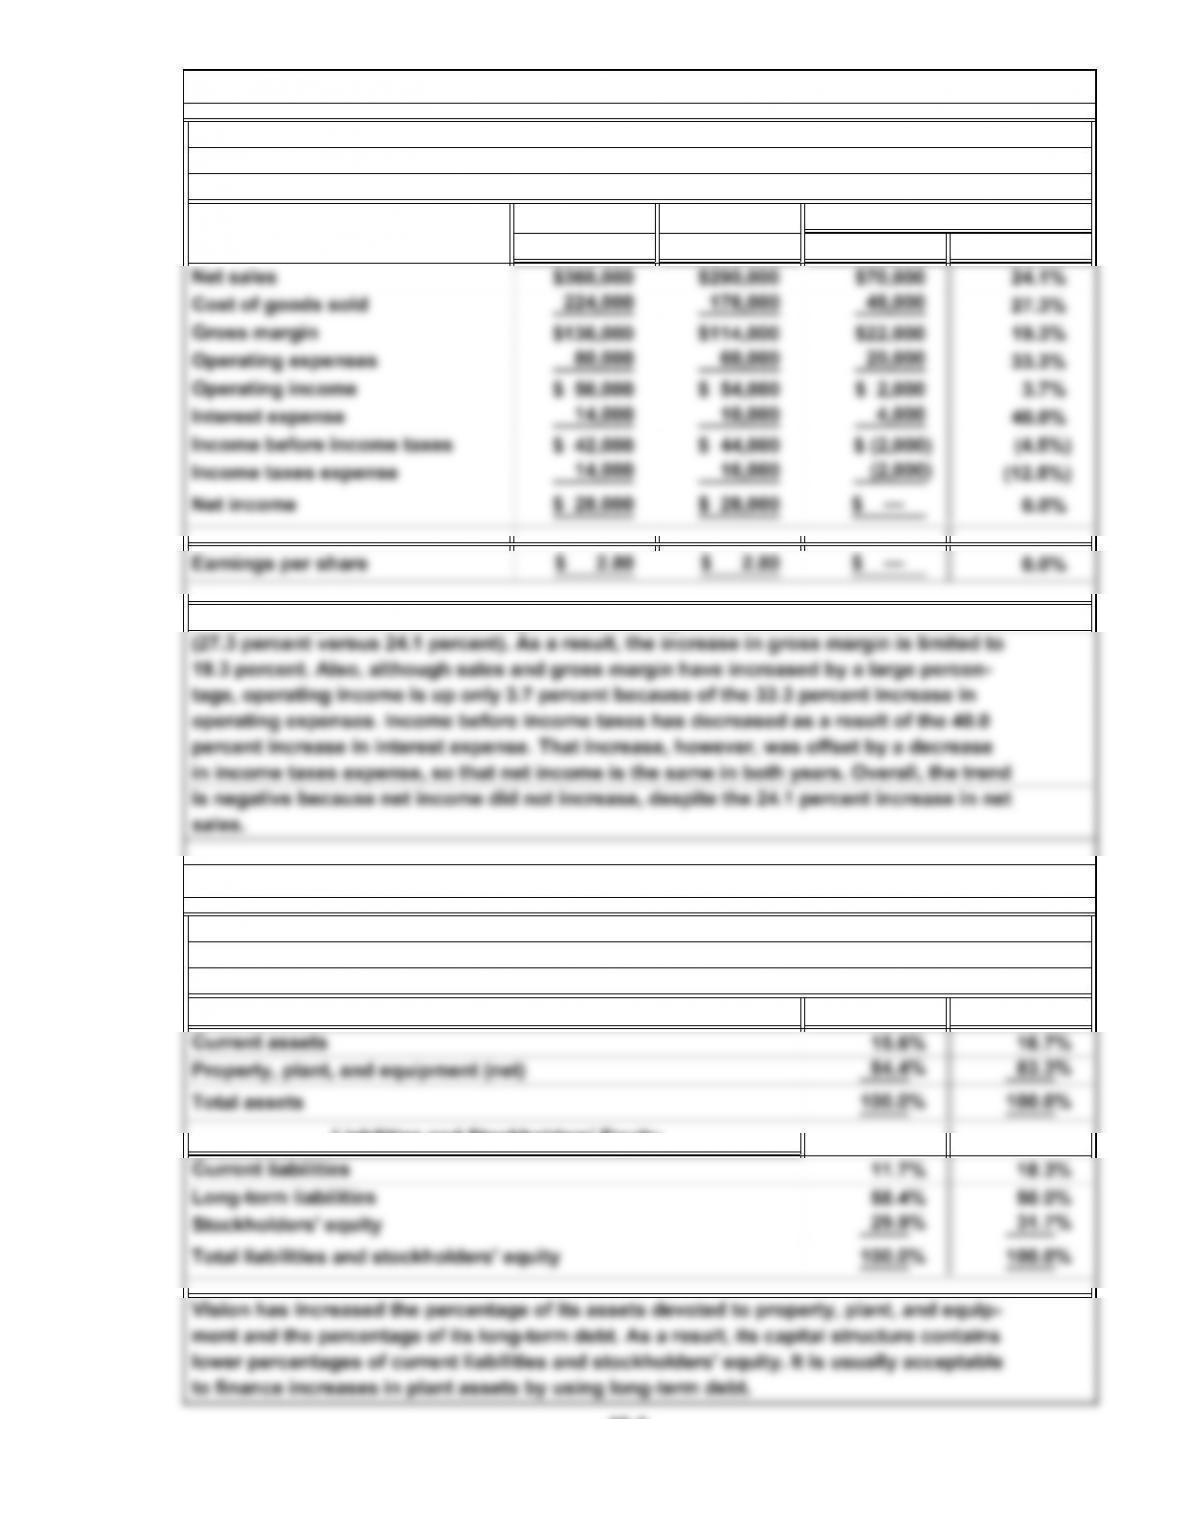
Common-Size Balance Sheets
December 31, 2014 and 2013
Comparative Income Statements
For the Years Ended December 31, 2014 and 2013
Vision, Inc.
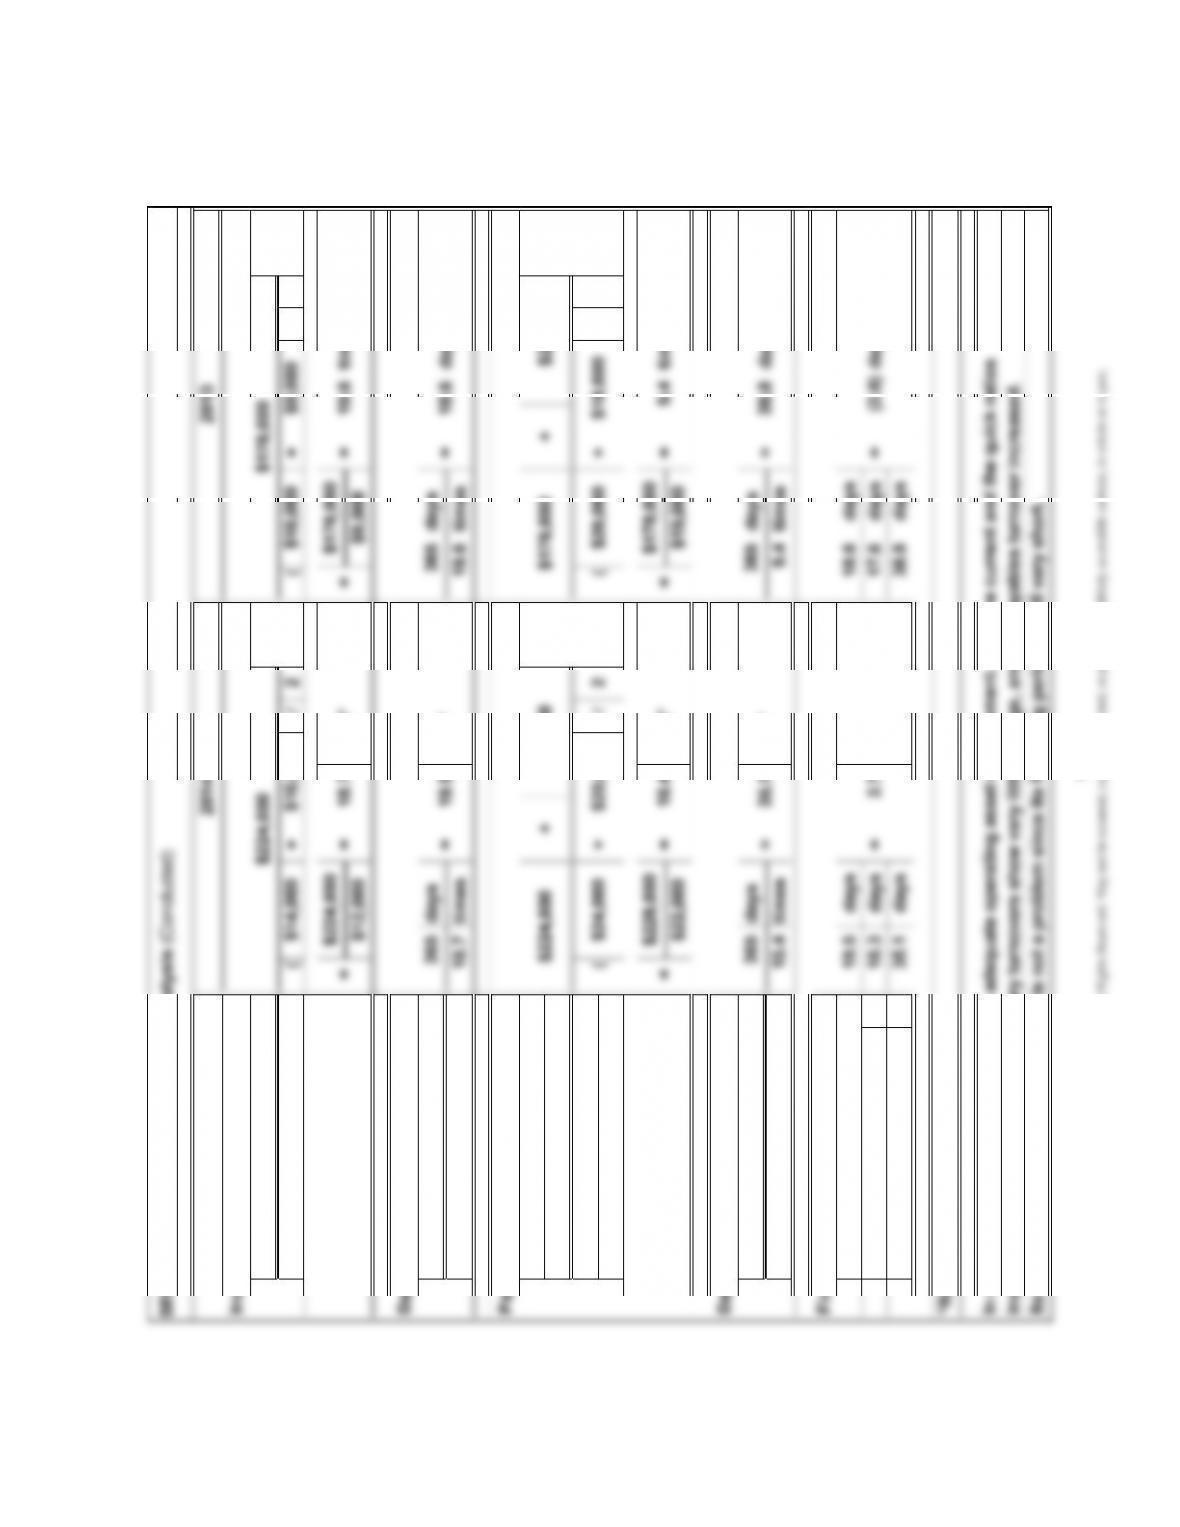
SE5. Vertical Analysis
SE4. Horizontal Analysis
Vision, Inc.
Increase or Decrease
19.3 percent. Also, although sales and gross margin have increased by a large percen-
tage, operating income is up only 3.7 percent because of the 33.3 percent increase in
operating expenses. Income before income taxes has decreased as a result of the 40.0
percent increase in interest expense. That increase, however, was offset by a decrease
(27.3 percent versus 24.1 percent). As a result, the increase in gross margin is limited to
Assets
The percentage increase in cost of goods sold was greater than the increase in net sales
16-3
© 2014 Cengage Learning. All Rights Reserved. May not be scanned, copied, duplicated, or posted to a publicly accessible website, in whole or in part.
Current Assets
Current Liabilities
Cash + Marketable
Securities + Receivables + + + +
Current Liabilities
** – – *** – –
Net Sales
Average Accounts ( + ) / 2 ( + ) / 2
Receivable
Days in Year
Receivable Turnover
Current ratio:
=
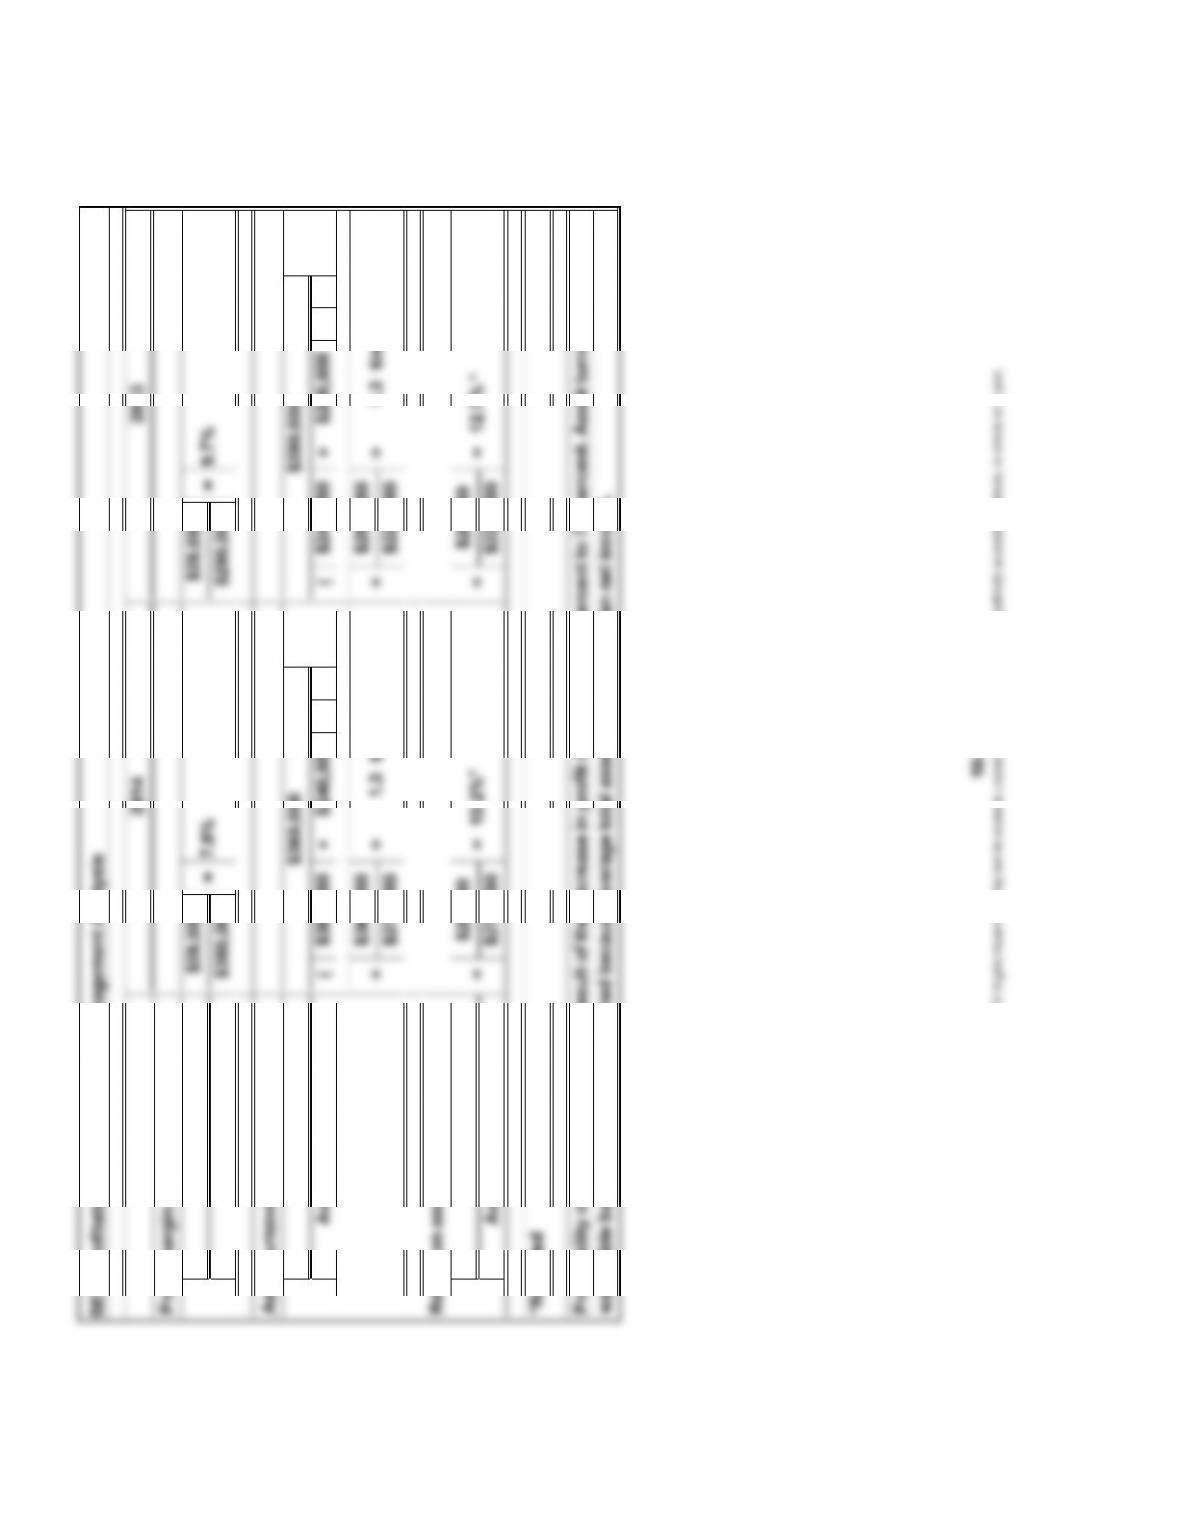
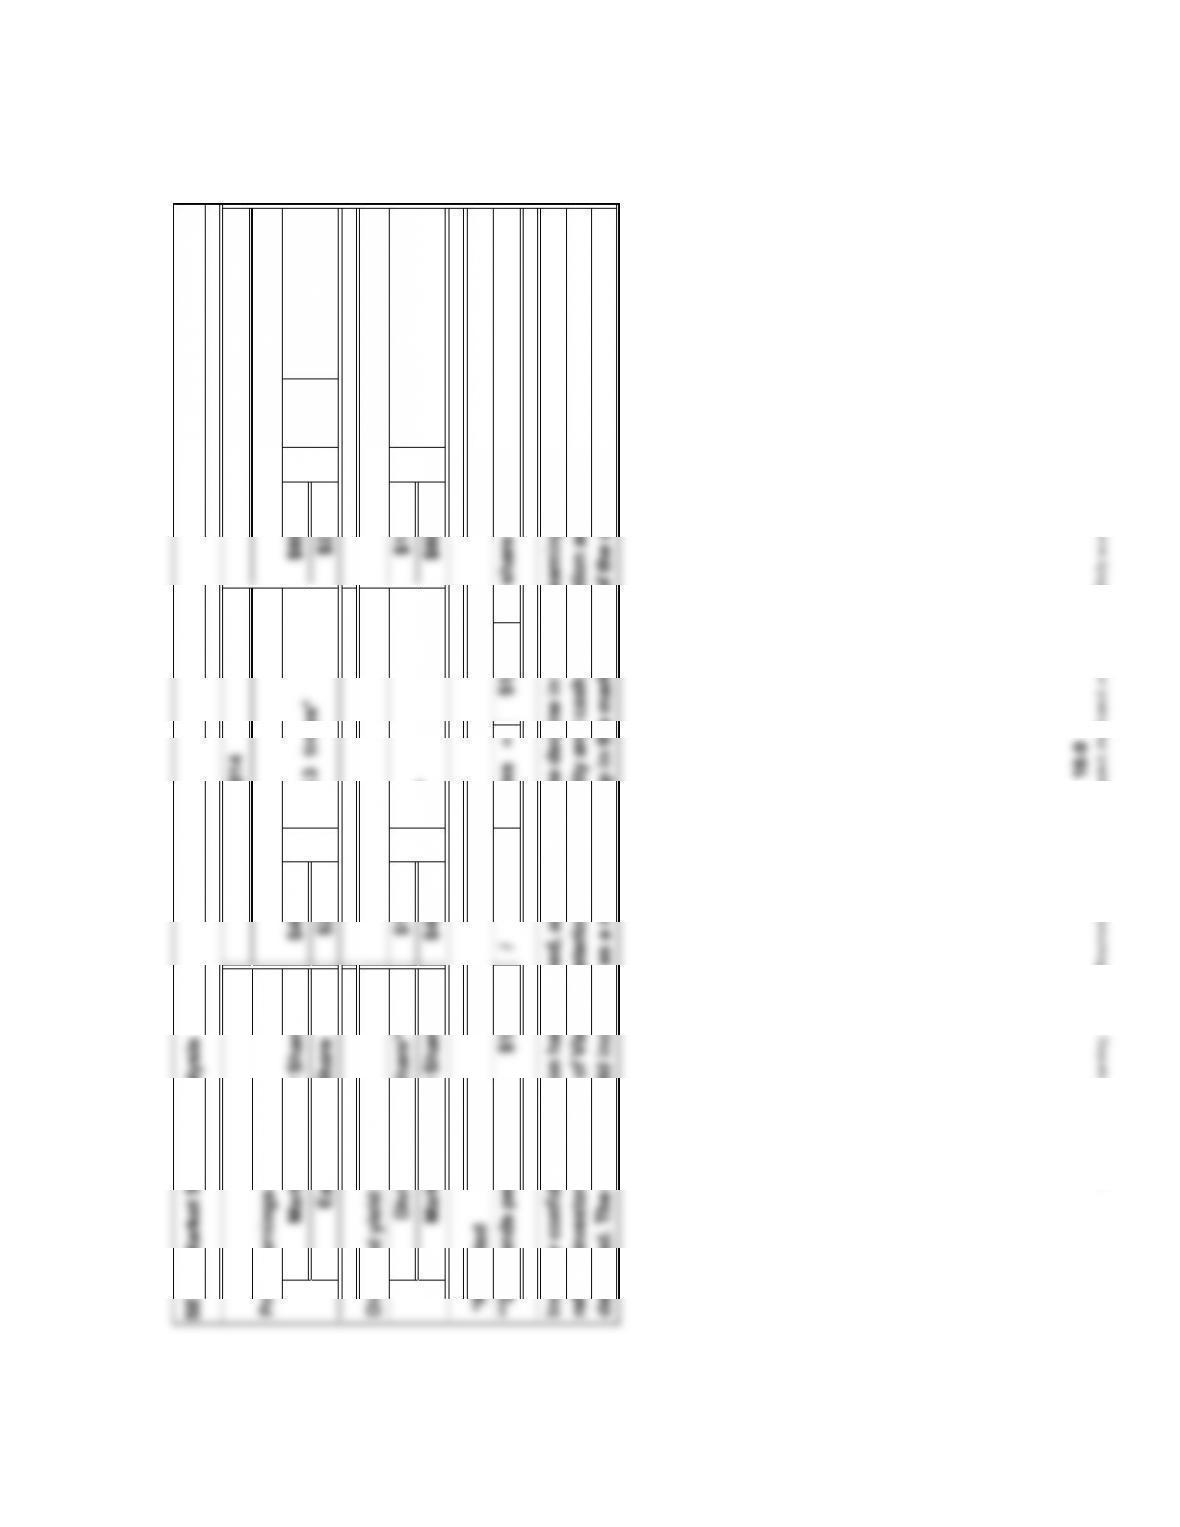
SE6. Operating Asset Management Analysis
$36,000
Days’ sales uncollected:
days
Quick ratio:
365
$360,000 ==
$360,000
*Rounded
Receivables turnover:
© 2014 Cengage Learning. All Rights Reserved. May not be scanned, copied, duplicated, or posted to a publicly accessible website, in whole or in part.
Days’ sales uncollected +
Days’ payable –
Days in Year
Inventory Turnover
Accounts Payable
Average
Days’ inventory on hand
Days in Year
Payables Turnover
=
Cost of Goods Sold
Average Inventory
=
times*19.6=
times*
Change in Inventories
Cost of Goods Sold +/‒
daysdays
© 2014 Cengage Learning. All Rights Reserved. May not be scanned, copied, duplicated, or posted to a publicly accessible website, in whole or in part.
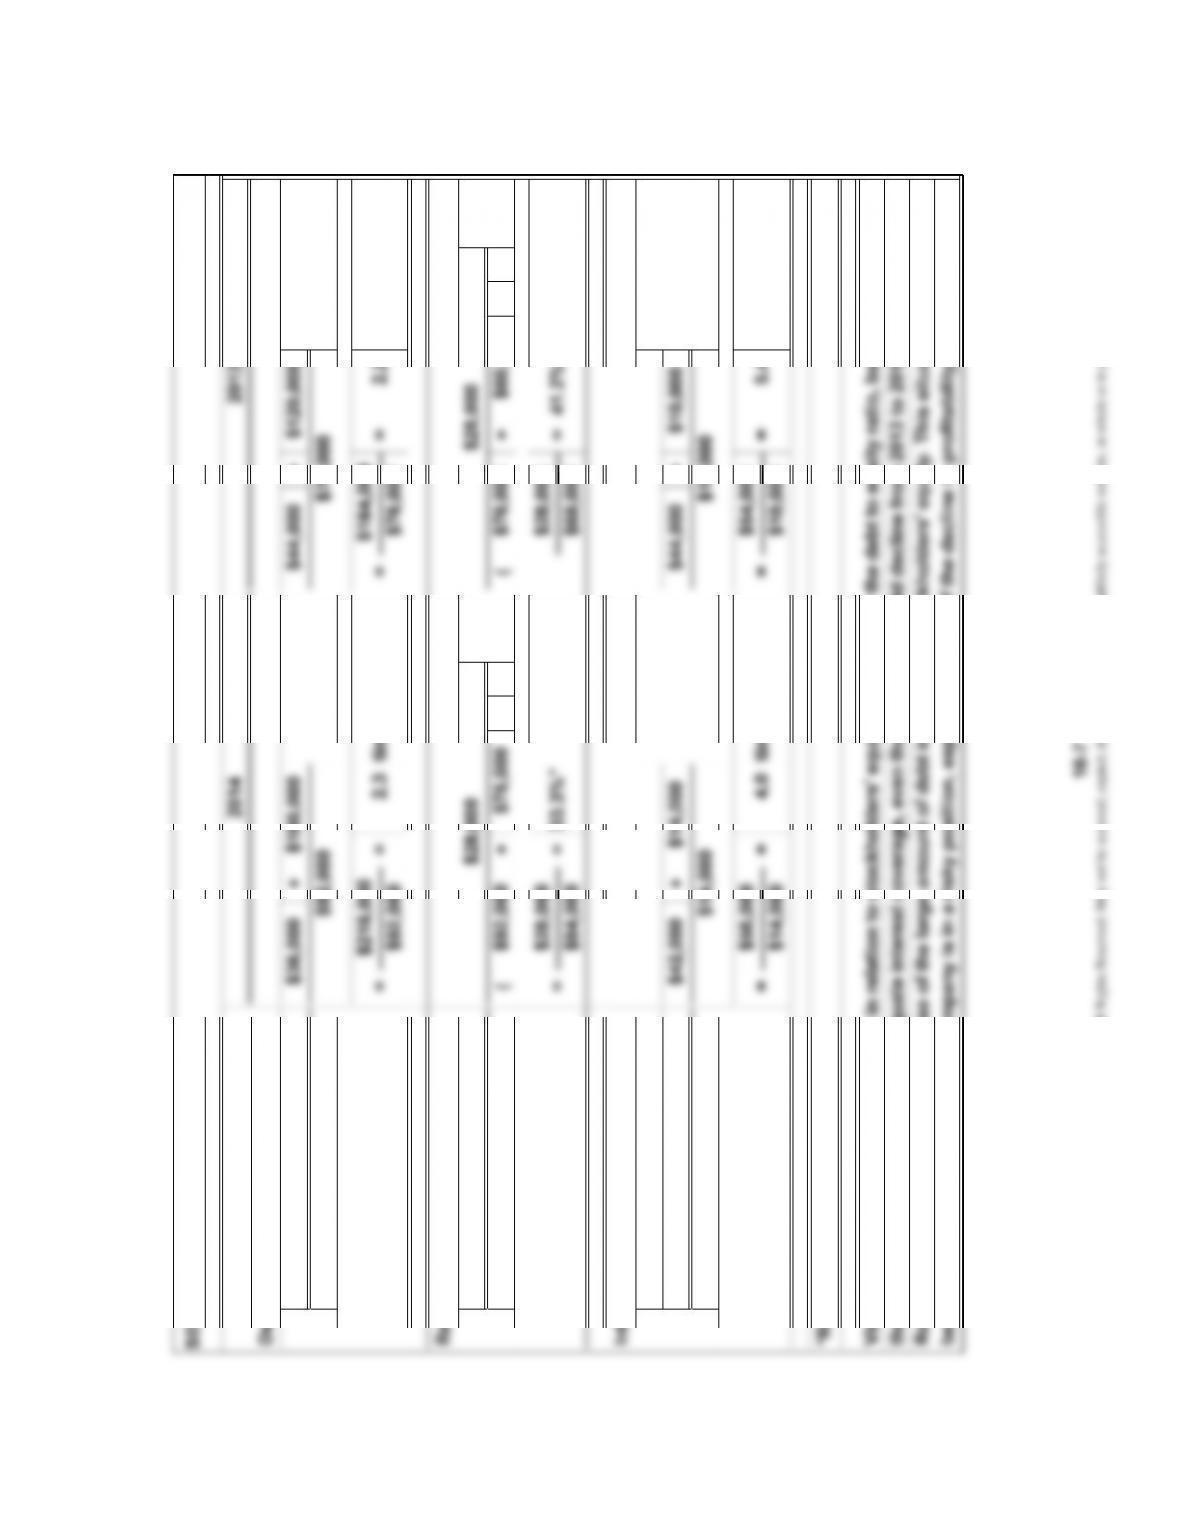
Total Liabilities + +
Stockholders’ Equity
Net Income
Average Stockholders’ Equity ( + ) / 2 ( + ) / 2
Income Before Income
Taxes + Interest Expense + +
Interest Expense
$14,000 timestimes
5.4
times*
$216,000
$92,000
$84,000
$92,000 $76,000 $76,000
41.2%
© 2014 Cengage Learning. All Rights Reserved. May not be scanned, copied, duplicated, or posted to a publicly accessible website, in whole or in part.
Net Cash Flows from
Operating Activities
Net Income
Net Cash Flows from
Operating Activities
Net Sales
Net Cash Flows from
Operating Activities
Average Total Assets ( + ) / 2 ( + ) / 2
Net Cash Flows from Operating – – – –
Activities ‒ Dividends ‒ Net
Capital Expenditures = =
© 2014 Cengage Learning. All Rights Reserved. May not be scanned, copied, duplicated, or posted to a publicly accessible website, in whole or in part.
/=
=
$2.80 == 14.3
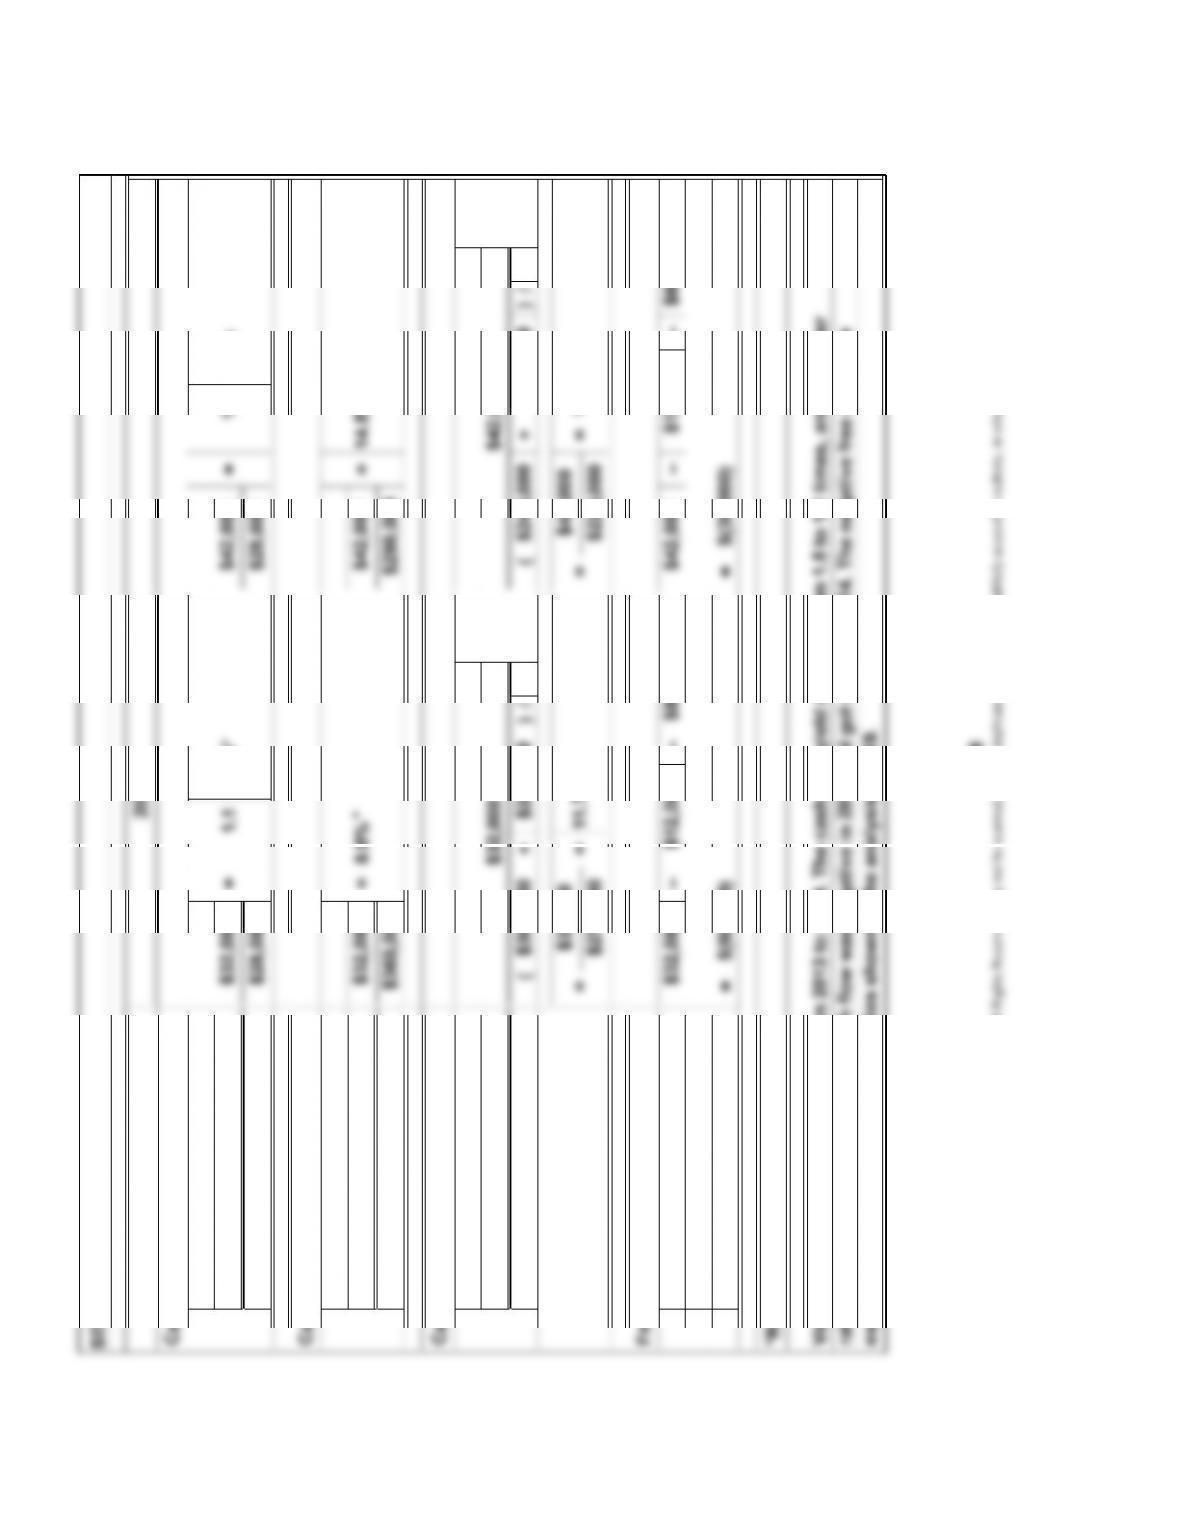
SE10. Market Strength Analysis
Earnings per Share 21.4
=
Price/earnings (P/E) ratio:
Dividend yield:
2013
2014
*Rounded
Investor confidence in Vision has declined, as reflected by the decline in the price/earnings (P/E) ratio. This may
reflect investor awareness of Vision’s deteriorating profitability and cash flow situation and its increasingly heavy
debt load. The dividend yield increased as a result of the drop in the market value of the stock.
$1.20 per share10,000 shares
16-9
© 2014 Cengage Learning. All Rights Reserved. May not be scanned, copied, duplicated, or posted to a publicly accessible website, in whole or in part.
2.
5.
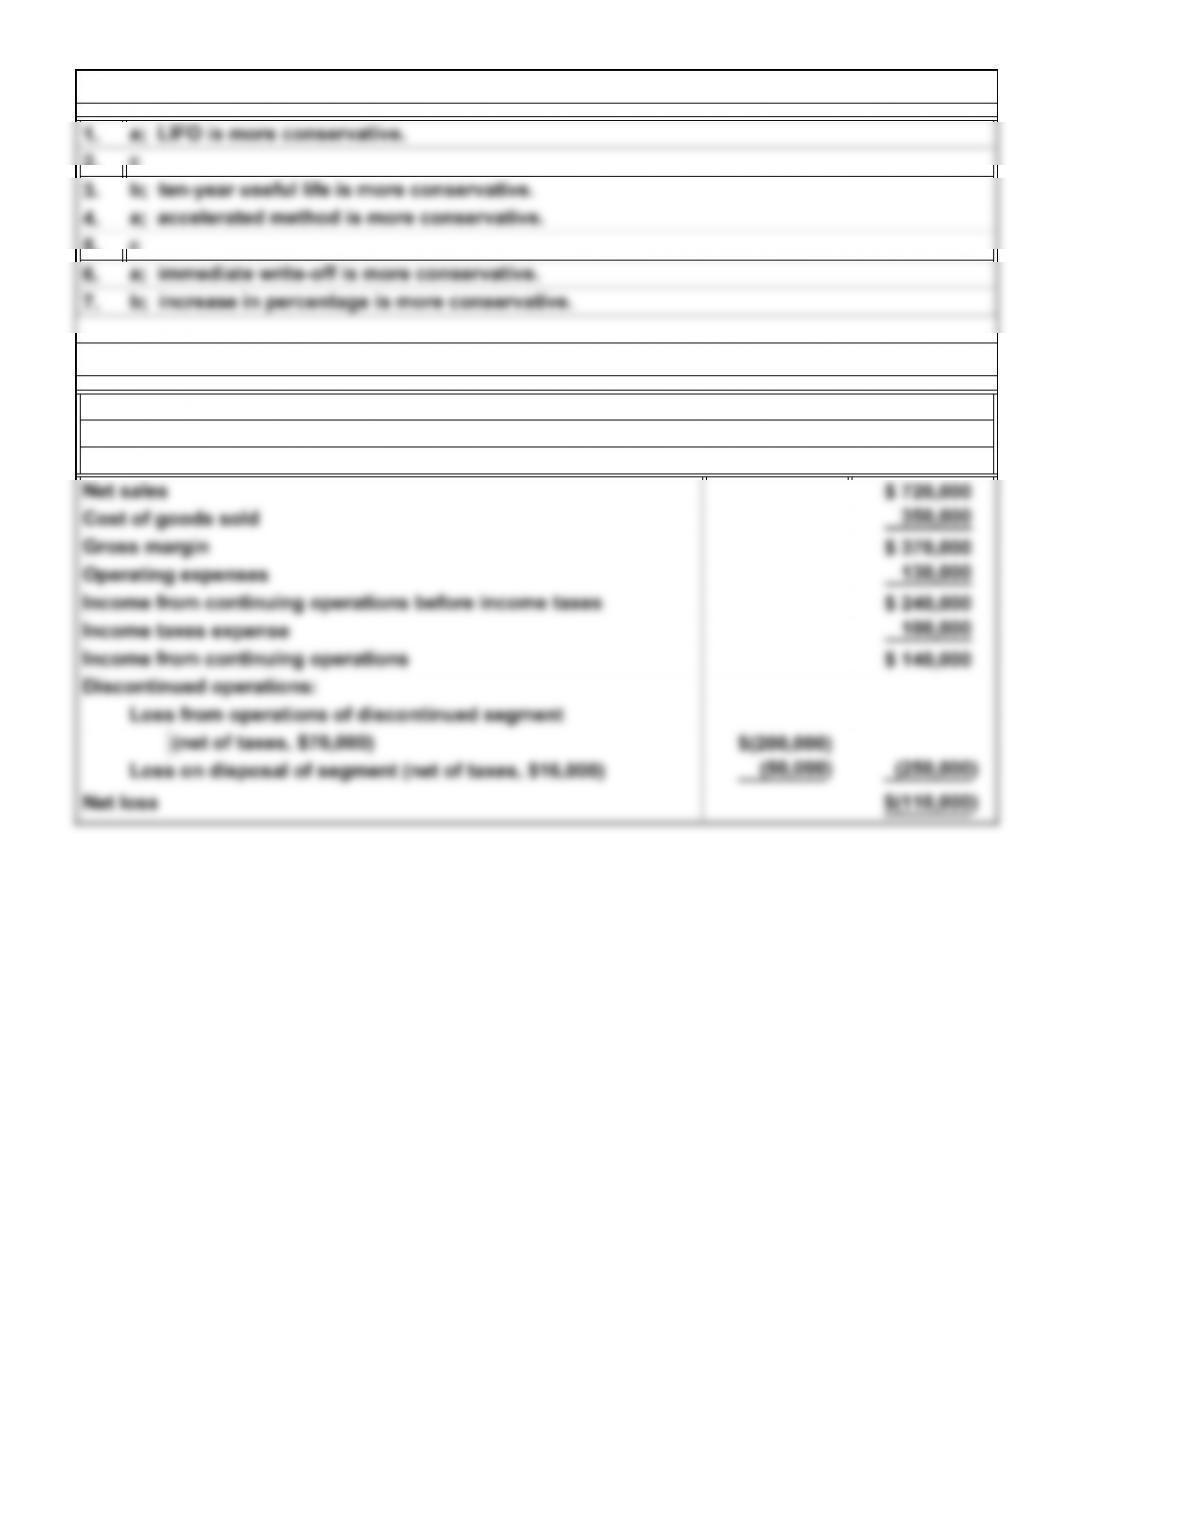
SE11. Quality of Earnings
Income Statement
For the Year Ended June 30, 2014
c
c
SE12. Corporate Income Statement
Karib Corporation
16-10
© 2014 Cengage Learning. All Rights Reserved. May not be scanned, copied, duplicated, or posted to a publicly accessible website, in whole or in part.