ating activities. The financial press would give a better picture of a company’s cash posi-
tion by focusing on cash flows from operating activities and cash flow yield.
assets and current liabilities, which can have a significant effect on cash flows from oper-
tion and amortization are added back to earnings (net income), but interest and taxes re-
quire cash and are unavoidable. Second, there may be one-time charges included in net
income, such as gains and losses, write-offs, and restructuring charges, that affect cash
flows from operating activities. Third, EBITDA ignores the effects of changes in current
of cash flows. It is not a good approximation because it leaves out many factors that affect
Cases
C1. Conceptual Understanding: EBITDA and the Statement of Cash Flows
EBITDA (earnings before interest, taxes, depreciation, and amortization) is often used in
15-27
© 2014 Cengage Learning. All Rights Reserved. May not be scanned, copied, duplicated, or posted to a publicly accessible website, in whole or in part.
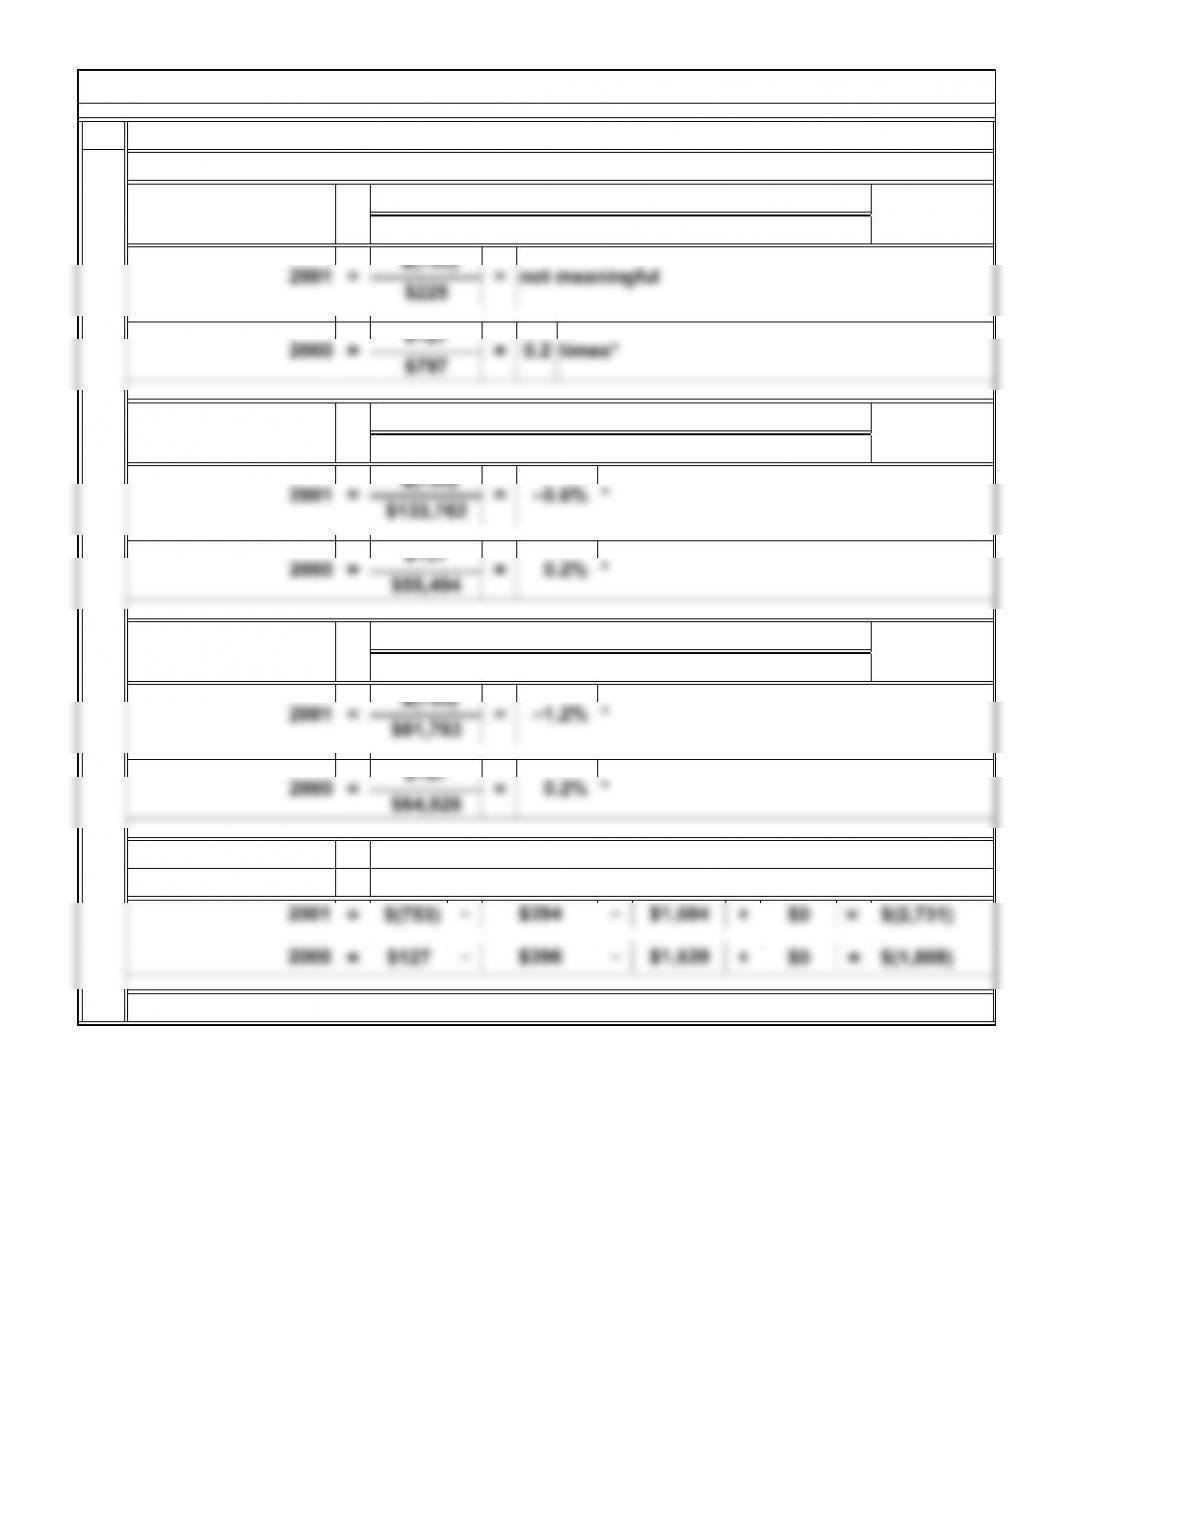
1.
=
C2. Interpreting Financial Reports: Classic Case—Anatomy of a Disaster
*
Free Cash Flow Net Cash Flows from Operating Activities ‒ Dividends ‒
Purchases of Plant Assets + Sales of Plant Assets
2000 = $127 =
$64,926 *0.2%
2001 = $(753) =
$61,783 *–1.2%
Cash Flows to Assets = Net Cash Flows from Operating Activities
Total Assets
2000 = $127 =
$55,494 *
2001 = $(753) =
$133,762
Cash Flows to Sales = Net Cash Flows from Operating Activities
Net Sales
2000 = $127 = 0.2
$797 times*
2001 = $(753) =
$225 not meaningful
All dollar amounts are in millions.
Cash Flow Yield = Net Cash Flows from Operating Activities
Net Income
Attachment
*Rounded
–0.6%
0.2%
15-28
© 2014 Cengage Learning. All Rights Reserved. May not be scanned, copied, duplicated, or posted to a publicly accessible website, in whole or in part.
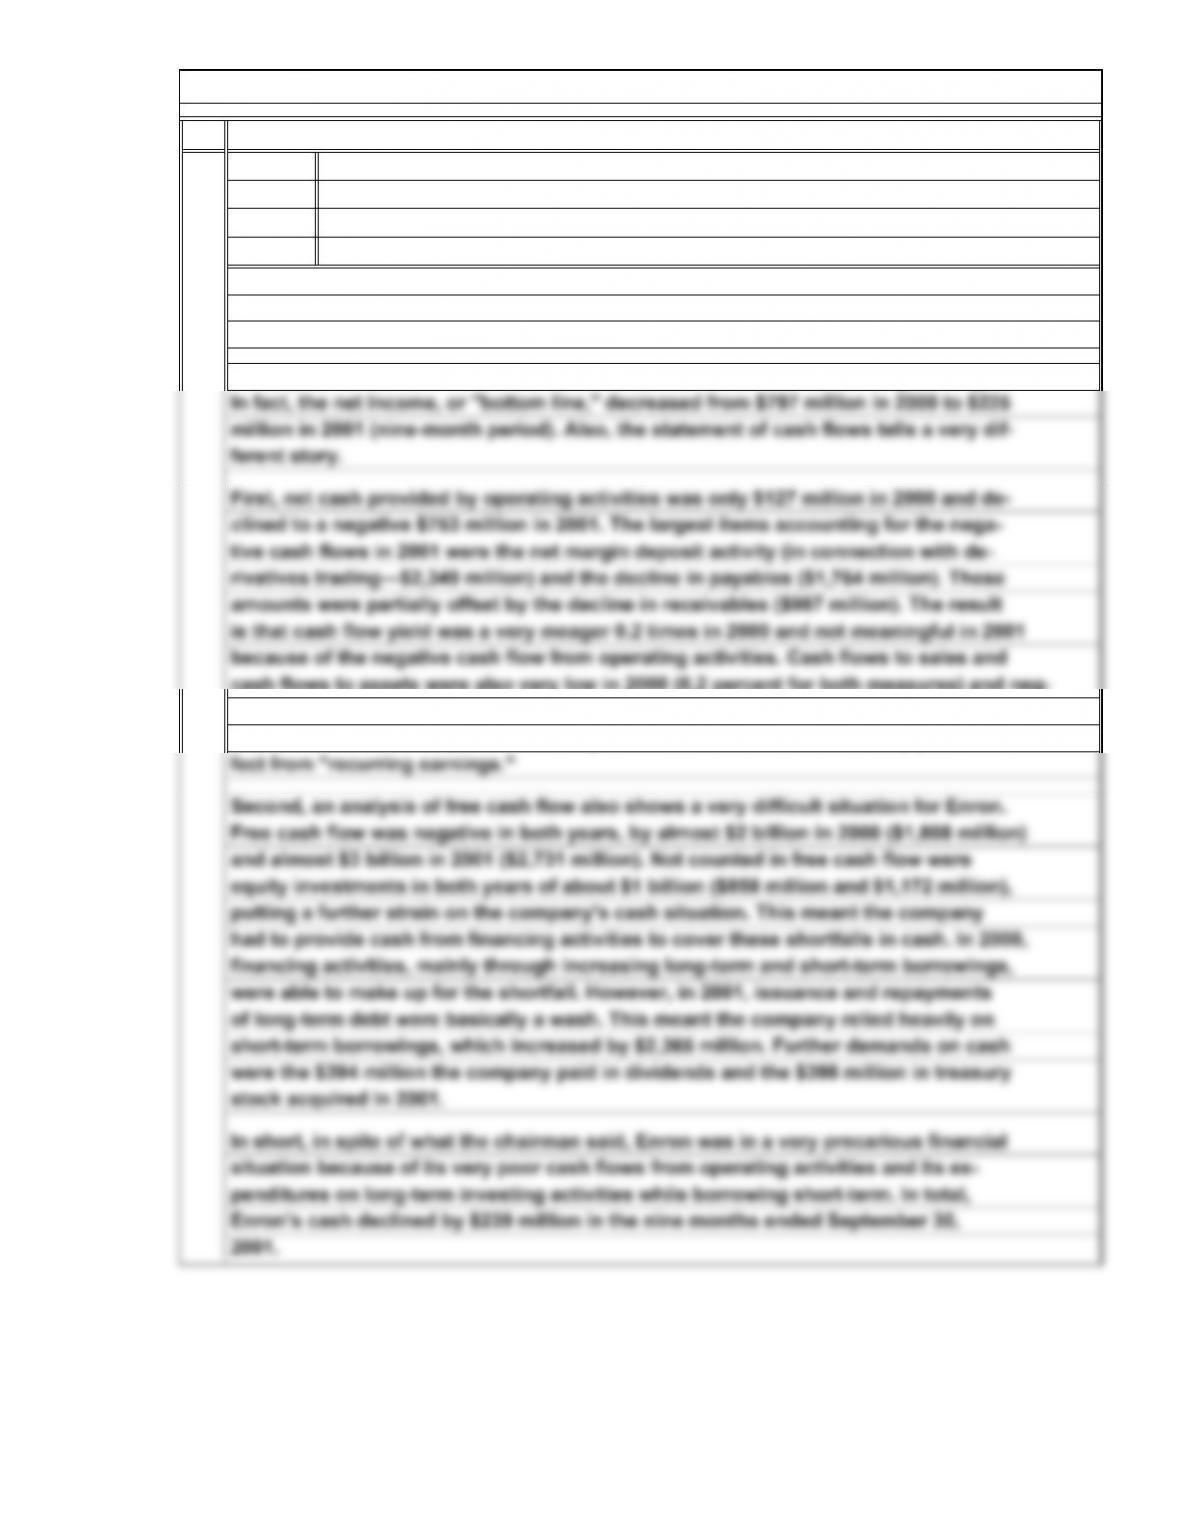
2.
Date: Today’s Date
In short, in spite of what the chairman said, Enron was in a very precarious financial
financing activities, mainly through increasing long-term and short-term borrowings,
were able to make up for the shortfall. However, in 2001, issuance and repayments
situation because of its very poor cash flows from operating activities and its ex-
penditures on long-term investing activities while borrowing short-term. In total,
of long-term debt were basically a wash. This meant the company relied heavily on
short-term borrowings, which increased by $2,365 million. Further demands on cash
were the $394 million the company paid in dividends and the $398 million in treasury
stock acquired in 2001.
and almost $3 billion in 2001 ($2,731 million). Not counted in free cash flow were
equity investments in both years of about $1 billion ($858 million and $1,172 million),
putting a further strain on the company’s cash situation. This meant the company
had to provide cash from financing activities to cover these shortfalls in cash. In 2000,
fect from “recurring earnings.”
Second, an analysis of free cash flow also shows a very difficult situation for Enron.
Free cash flow was negative in both years, by almost $2 billion in 2000 ($1,808 million)
because of the negative cash flow from operating activities. Cash flows to sales and
cash flows to assets were also very low in 2000 (0.2 percent for both measures) and neg-
ative in 2001 (–0.6 percent cash flows to sales and –1.2 percent in 2001). It is clear that
Enron’s other activities, such as trading activities, have overwhelmed any positive ef-
tive cash flows in 2001 were the net margin deposit activity (in connection with de-
rivatives trading—$2,349 million) and the decline in payables ($1,764 million). These
amounts were partially offset by the decline in receivables ($987 million). The result
is that cash flow yield was a very meager 0.2 times in 2000 and not meaningful in 2001
ferent story.
First, net cash provided by operating activities was only $127 million in 2000 and de-
clined to a negative $753 million in 2001. The largest items accounting for the nega-
Mr. Lay, Chairman of Enron, referred to a 26 percent increase in recurring earnings.
Memorandum
To: Investment Analyst
From: Student
Re: Assessment of Enron’s Statements of Cash Flows
C2. Interpreting Financial Reports: Classic Case—Anatomy of a Disaster (Concluded)
At your request, I have prepared an analysis of Enron Corporation’s statement of cash
flows. Enron’s statement of cash flows and the computation on which this analysis is
based are presented in attachments.
15-29
© 2014 Cengage Learning. All Rights Reserved. May not be scanned, copied, duplicated, or posted to a publicly accessible website, in whole or in part.

Students will disagree on this case. Some will think the president’s order is tantamount
C3. Ethical Dilemma: Ethics and Cash Flow Classifications
would permit the reclassification. Also, the 3.0 ratio requirement is quite arbitrary. Why
risk a serious situation over such a small thing? Most will argue that the company bene-
fits in the short term by changing the classification of the proceeds from the note pay-
15-30
© 2014 Cengage Learning. All Rights Reserved. May not be scanned, copied, duplicated, or posted to a publicly accessible website, in whole or in part.
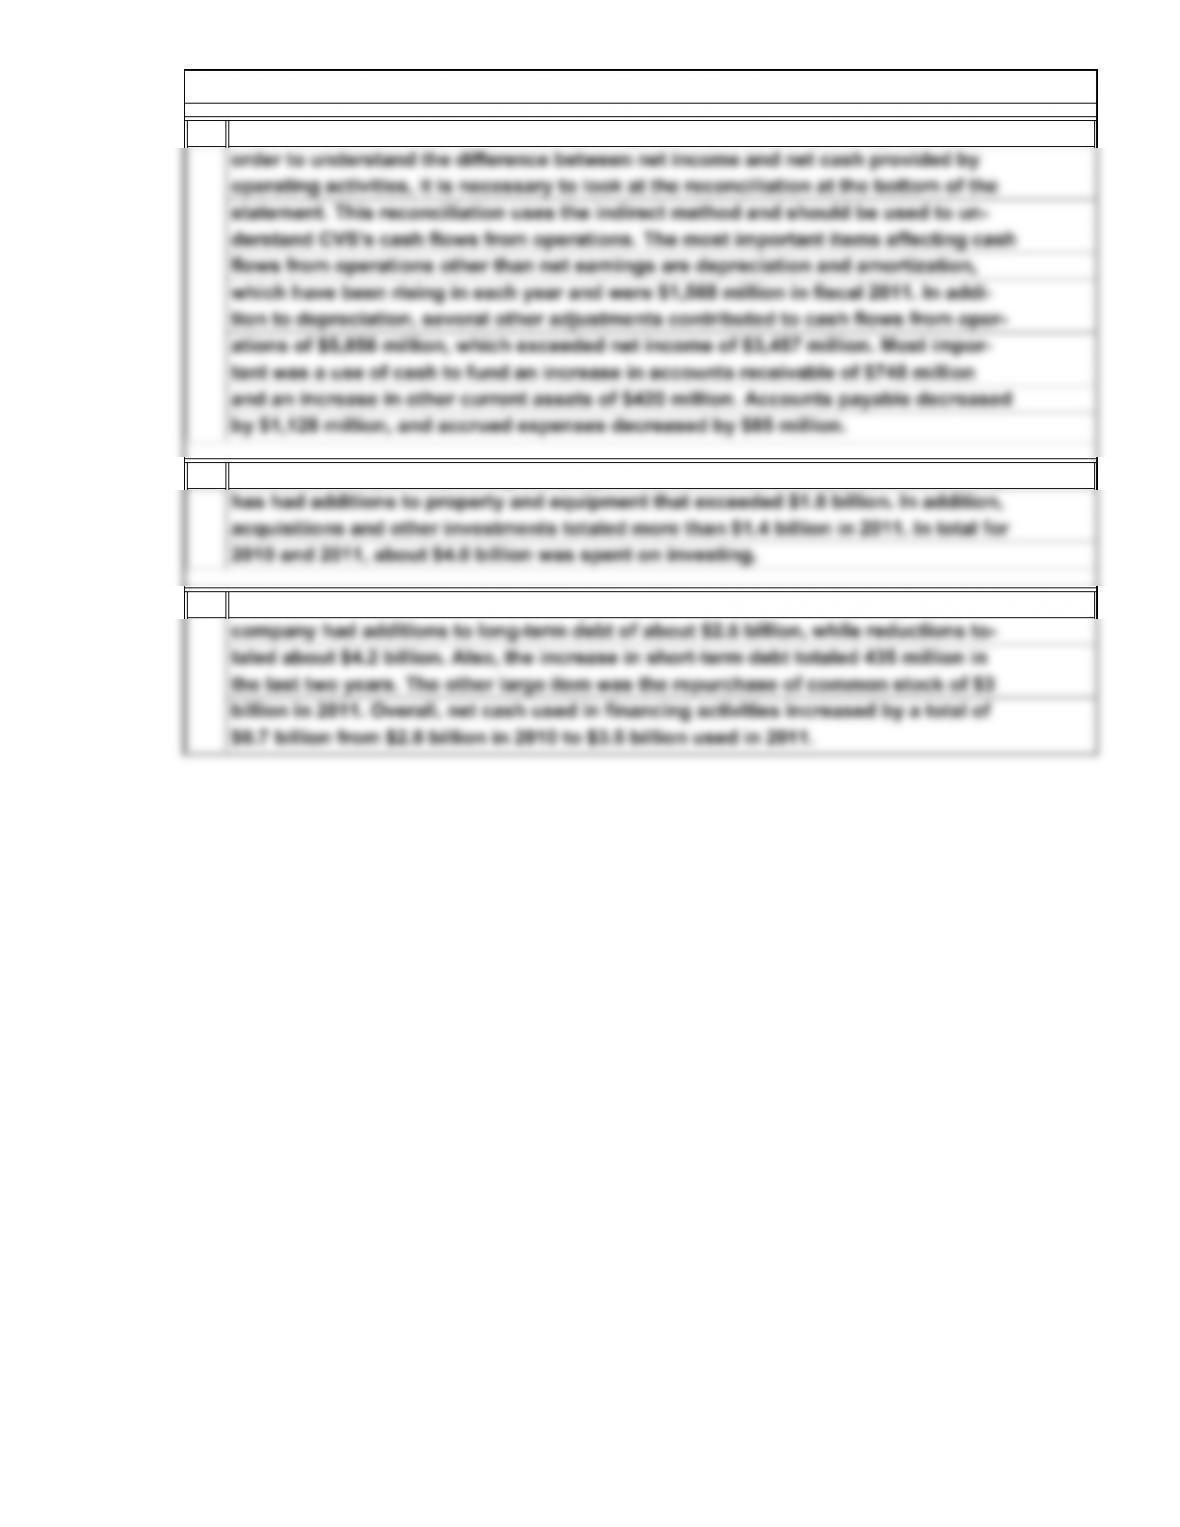
1.
2.
3. Indeed, CVS was active in its financing activities. In total in the last two years, the
company had additions to long-term debt of about $2.5 billion, while reductions to-
taled about $4.2 billion. Also, the increase in short-term debt totaled 435 million in
the last two years. The other large item was the repurchase of common stock of $3
billion in 2011. Overall, net cash used in financing activities increased by a total of
$0.7 billion from $2.8 billion in 2010 to $3.5 billion used in 2011.
by $1,128 million, and accrued expenses decreased by $85 million.
CVS is definitely an expanding company. In each of the last two years, the company
has had additions to property and equipment that exceeded $1.8 billion. In addition,
acquisitions and other investments totaled more than $1.4 billion in 2011. In total for
2010 and 2011, about $4.0 billion was spent on investing.
ations of $5,856 million, which exceeded net income of $3,457 million. Most impor-
tant was a use of cash to fund an increase in accounts receivable of $748 million
and an increase in other current assets of $420 million. Accounts payable decreased
C5. Interpreting Financial Reports: Analysis of the Statement of Cash Flows
No, CVS uses the direct method of reporting cash flows from operating activities. In
15-31
© 2014 Cengage Learning. All Rights Reserved. May not be scanned, copied, duplicated, or posted to a publicly accessible website, in whole or in part.
( + ) / 2
( + ) / 2
=
Net Cash Flows from Operating Activities ‒ Dividends ‒
Purchases of Plant Assets + Sales of Plant Assets
Free Cash Flow
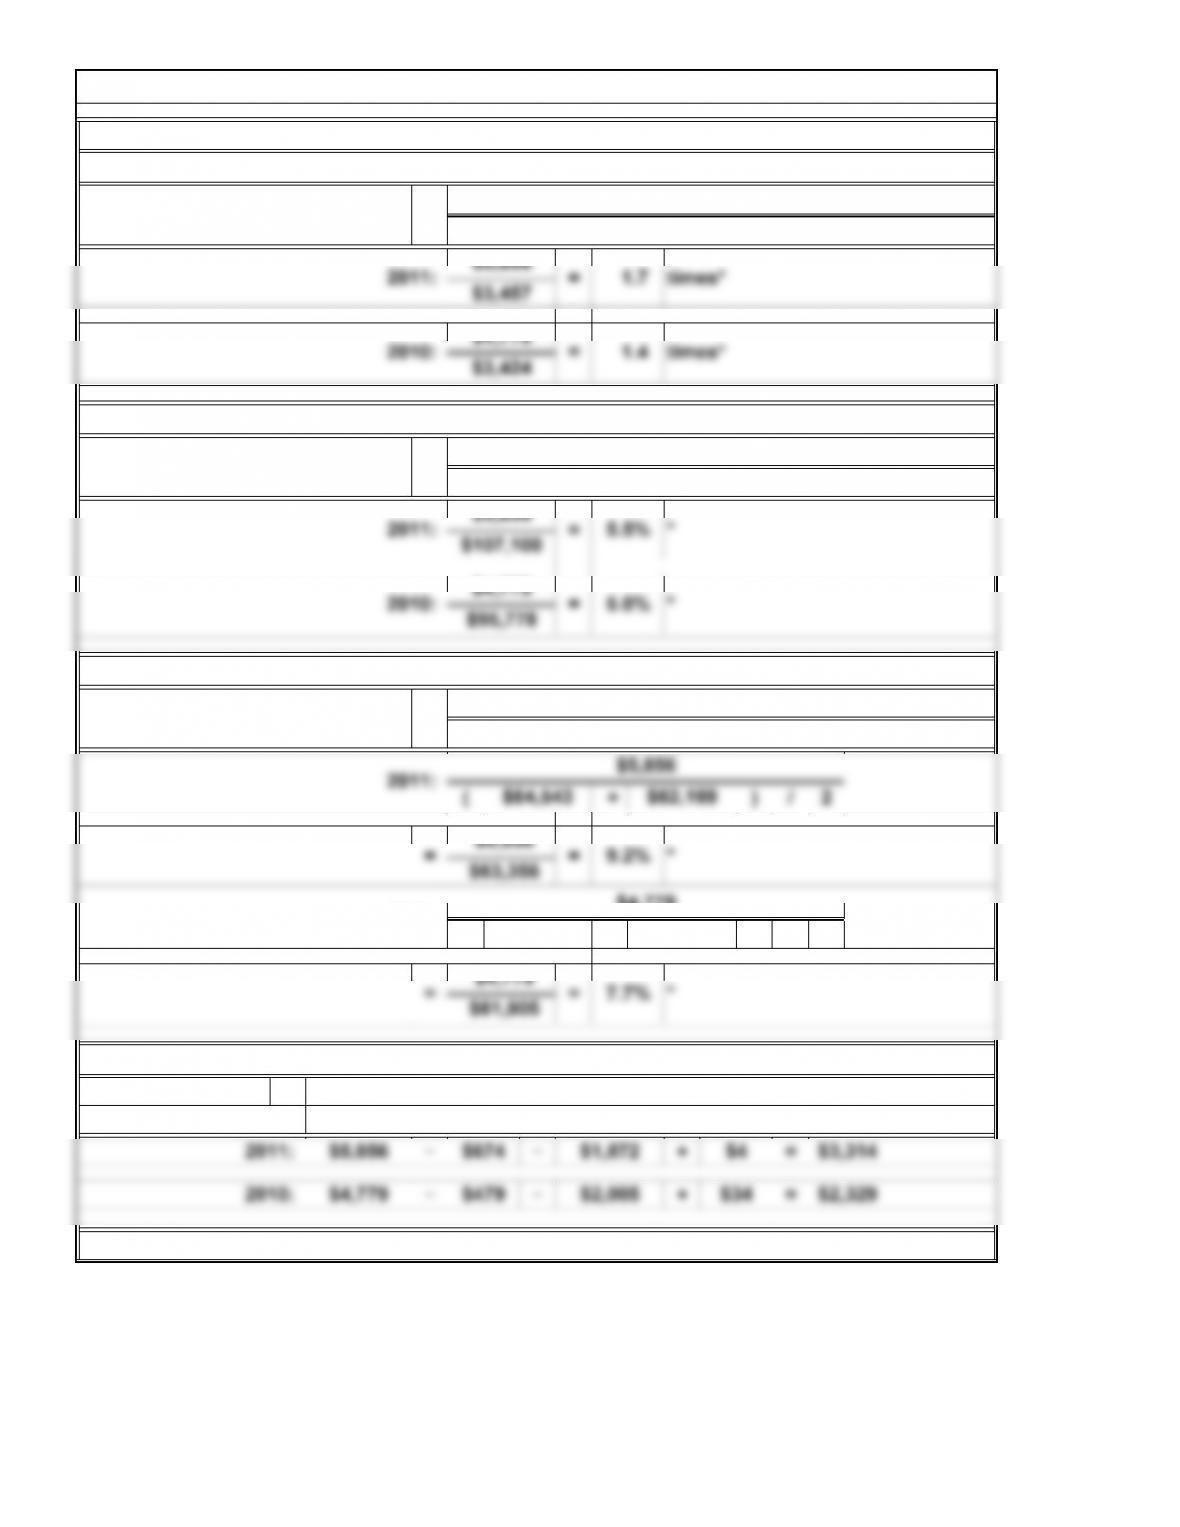
CVS’s free cash flow:
$62,169 $61,641
2010: $4,779
2011: $64,543 $62,169
$5,856
Cash Flows to Assets = Net Cash Flows from Operating Activities
Average Total Assets
CVS’s cash flows to assets:
2010: $4,779 =
$95,778 5.0% *
2011: $5,856 =
$107,100 5.5% *
Cash Flows to Sales = Net Cash Flows from Operating Activities
Sales
CVS’s cash flows to sales:
$3,424
$3,457
CVS’s cash flow yield:
Cash Flow Yield = Net Cash Flows from Operating Activities
Net Income
C6. Interpreting Financial Reports: Cash Flows Analysis
(dollars in millions)
*Rounded
$63,356
15-32
© 2014 Cengage Learning. All Rights Reserved. May not be scanned, copied, duplicated, or posted to a publicly accessible website, in whole or in part.
(+)/2
(+)/2
=
Net Cash Flows from Operating Activities ‒ Dividends ‒
Purchases of Plant Assets + Sales of Plant Assets
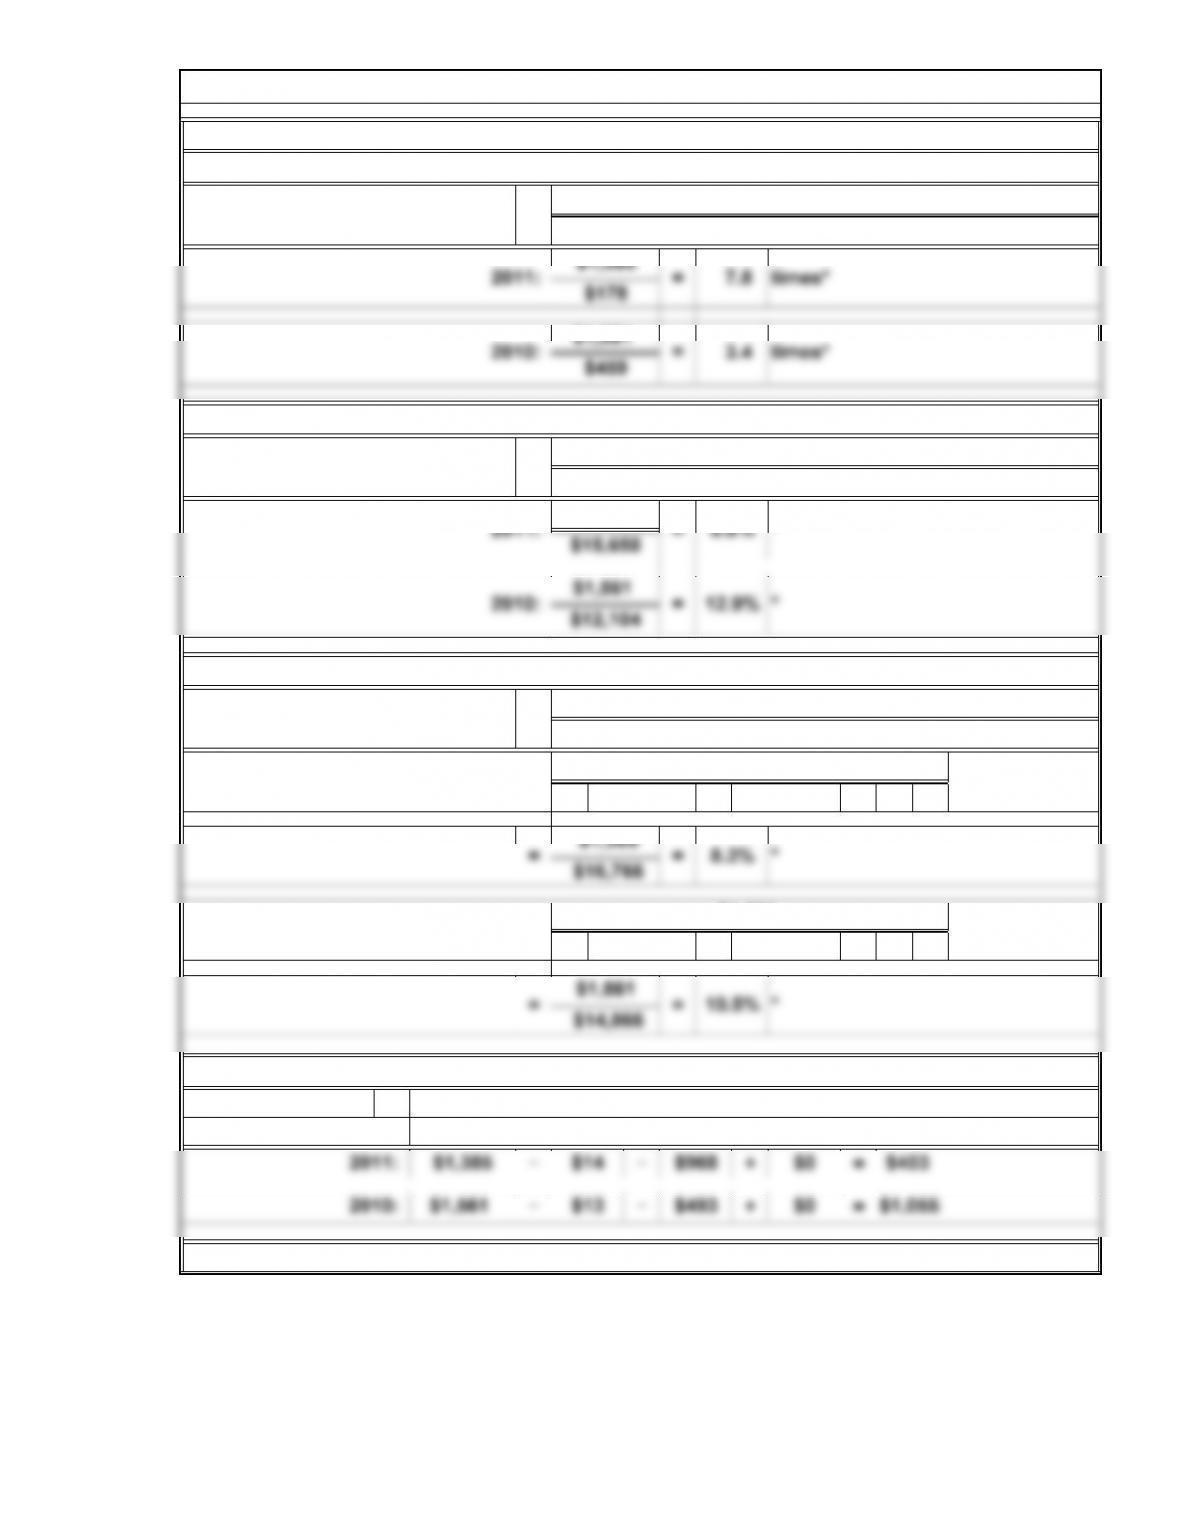
Southwest’s free cash flow:
2011: $18,068
$12,104
Southwest’s cash flows to assets:
Cash Flows to Assets = Cash Flows from Operating Activities
Average Total Assets
2011: $1,385 =
Cash Flows to Sales = Net Cash Flows from Operating Activities
Sales
Southwest’s cash flows to sales:
2010: $1,561 =
$459 3.4 times*
2011: $1,385 = 7.8 times*
$178
Cash Flow Yield = Net Cash Flows from Operating Activities
Net Income
C6. Interpreting Financial Reports: Cash Flows Analysis (Continued)
(dollars in millions)
*Rounded
Southwest’s cash flow yield:
$16,766
$1,561 = 12.9%
2010: $15,463
Free Cash Flow
$14,269
$15,463
$1,385
$1,561
15-33
© 2014 Cengage Learning. All Rights Reserved. May not be scanned, copied, duplicated, or posted to a publicly accessible website, in whole or in part.
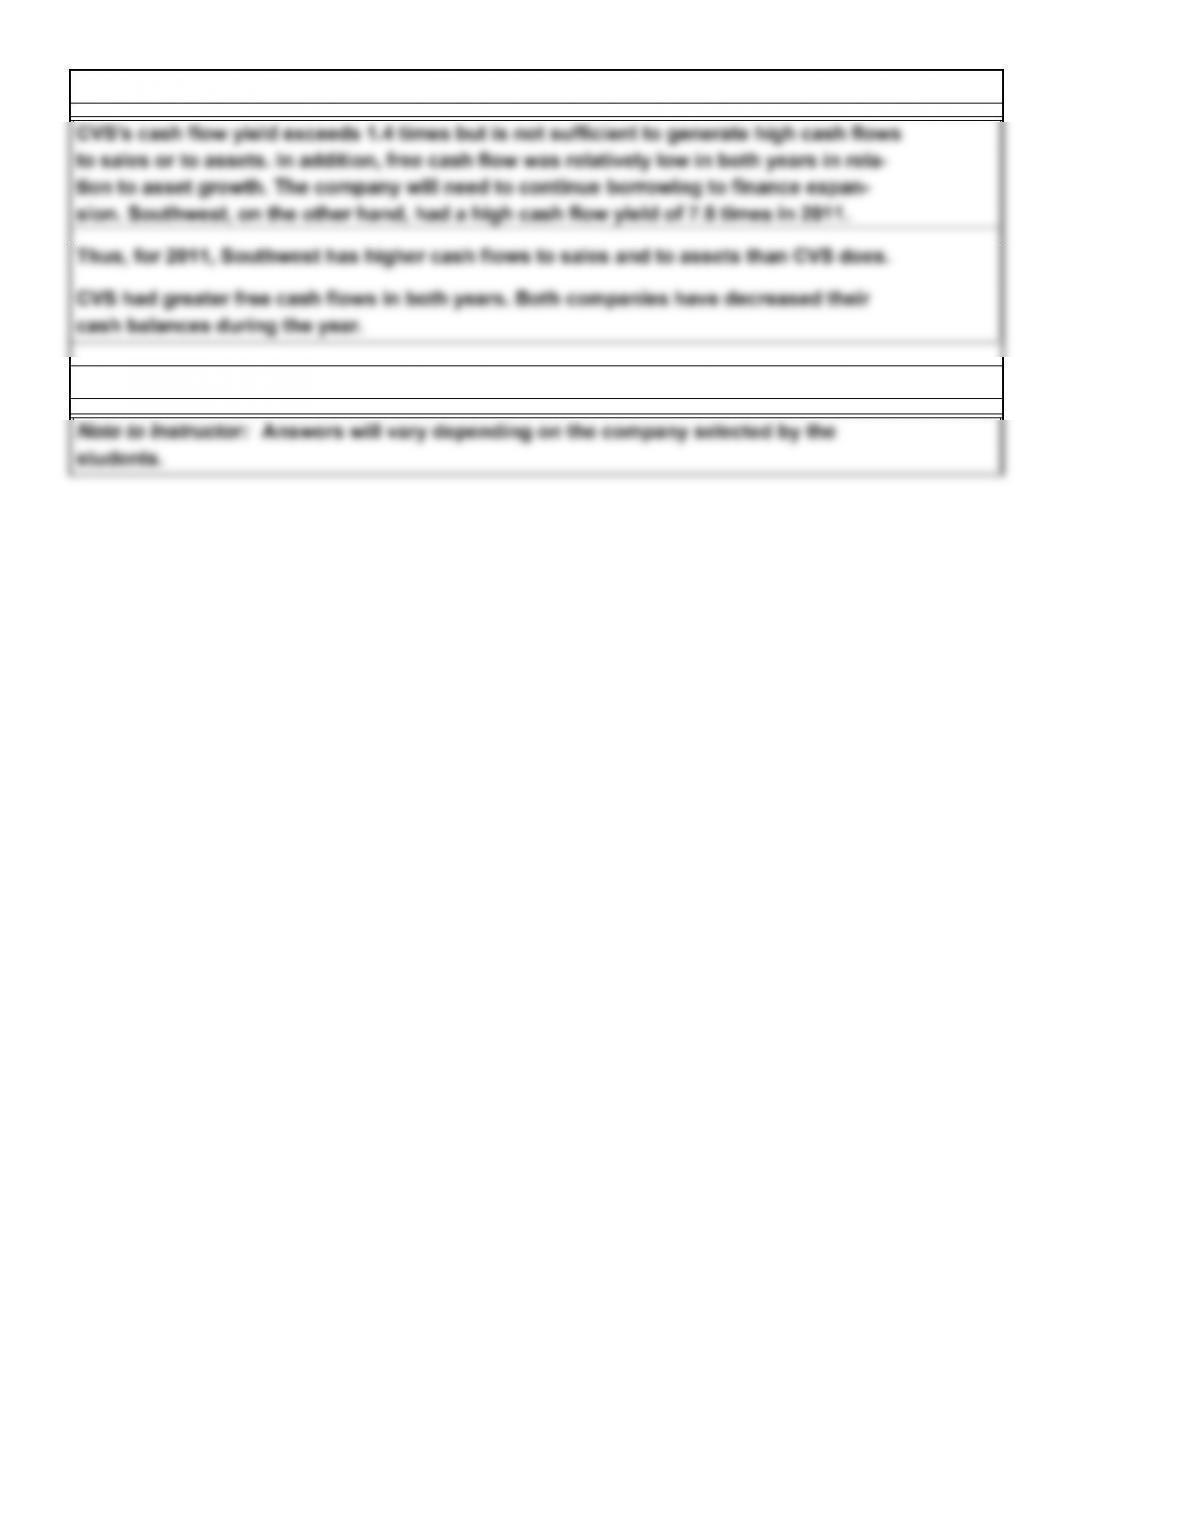
students.
Note to Instructor: Answers will vary depending on the company selected by the
C7. Continuing Case: Annual Report Project
C6. Interpreting Financial Reports: Cash Flows Analysis (Concluded)
15-34
© 2014 Cengage Learning. All Rights Reserved. May not be scanned, copied, duplicated, or posted to a publicly accessible website, in whole or in part.