394
CASE 11-4 BOOKS UNLIMITED (Part 1)
a. Liquidity Ratios
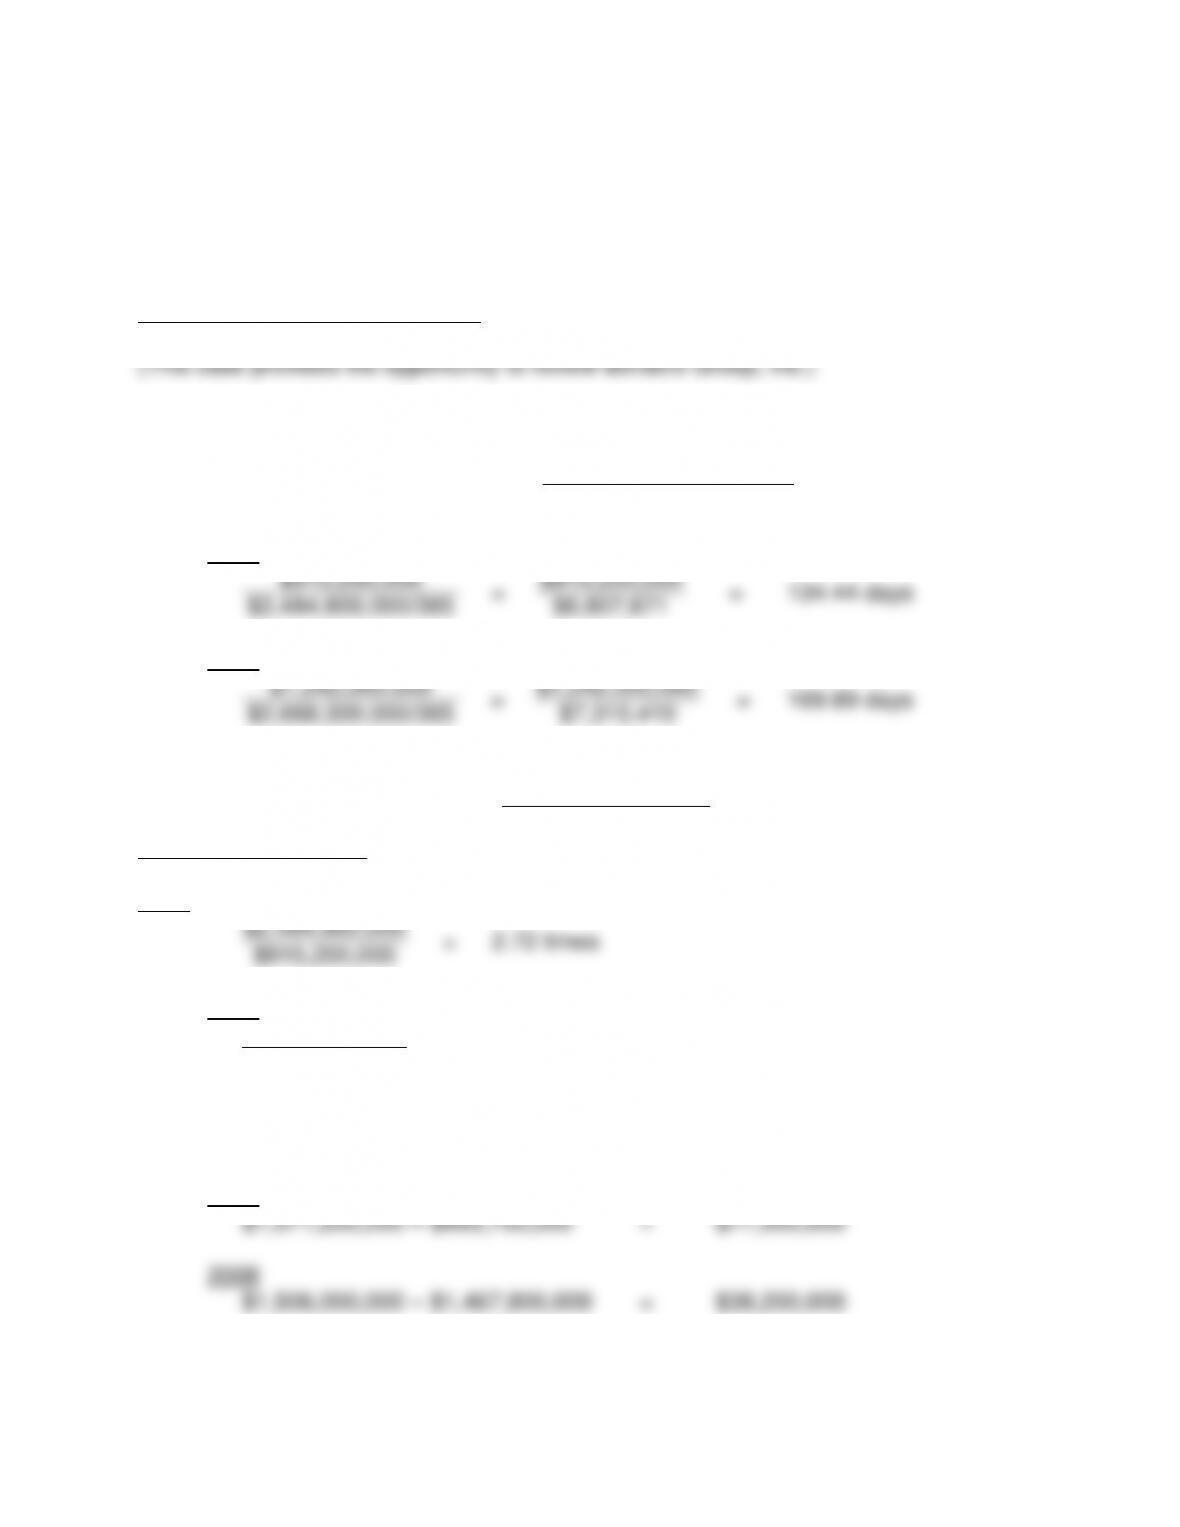
1.
Days’ Sales in Inventory
=
Ending Inventory
Cost of Goods Sold/365
2009
$915,200,000
=
$915,200,000
=
134.44 days
$2,484,800,000/365
$6,807,671
2008
$1,242,000,000
=
$1,242,000,000
=
169.89 days
$2,668,300,000/365
$7,310,410
2.
Inventory Turnover
=
Cost of Goods Sold
Average Inventory
(use ending inventory)
2009
$2,484,800,000
=
2.72 times
$915,200,000
2008
$2,668,300,000
=
2.15 times
$915,200,000
3.
Working Capital
=
Current Assets – Current Liabilities
2009
$1,071,200,000 – $993,700,000
=
$77,500,000
2008
$1,506,000,000 – $1,467,800,000
=
$38,200,000
395
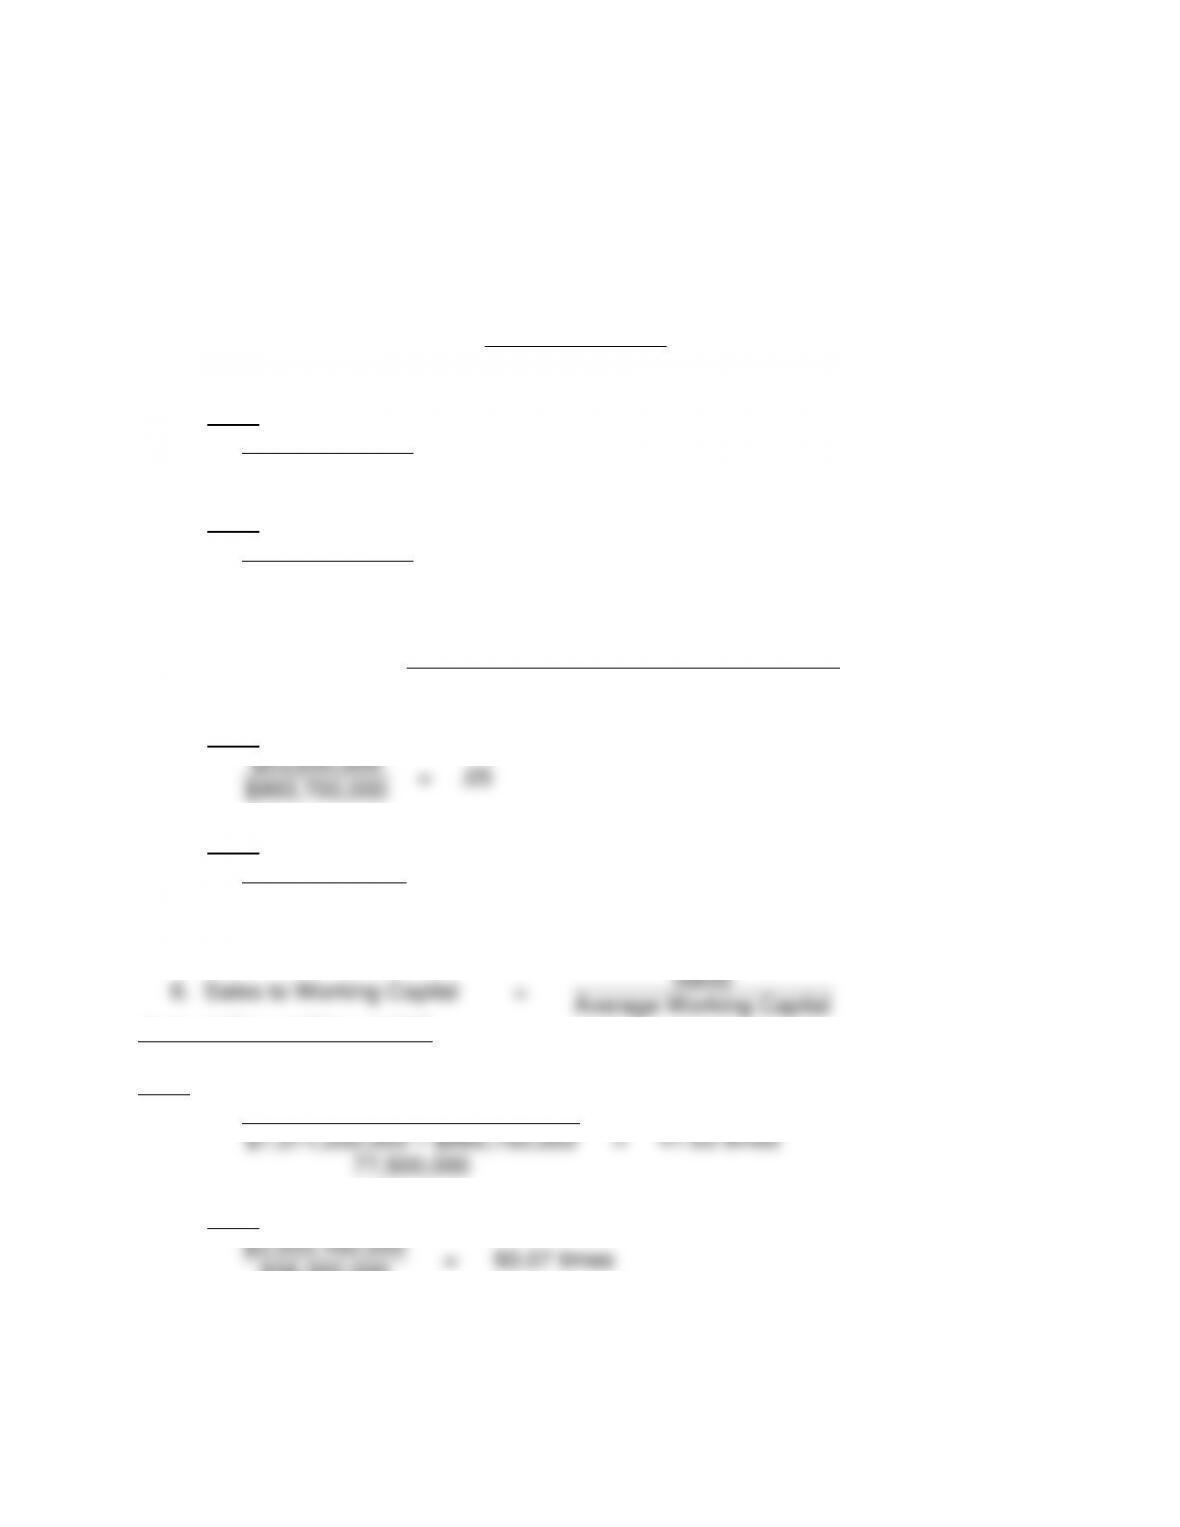
4.
Current Ratio
=
Current Assets
Current Liabilities
2009
$1,071,200,000
=
1.08
$993,700,000
2008
$1,506,000,000
=
1.03
$1,467,800,000
5.
Cash Ratio
=
Cash Equivalents + Marketable Securities
Current Liabilities
2009
$53,600,000
=
.05
$993,700,000
2008
$58,500,000
=
.04
$1,467,800,000
6.
Sales to Working Capital
=
Sales
Average Working Capital
(use ending working capital)
2009
$3,242,100,000
=
41.83 times
$1,071,200,000 – $993,700,000
77,500,000
2008
$3,555,100,000
=
93.07 times
$38,200,000
7. Operating Cash Flow / Current Maturities of Long-Term Debt and Current Notes
Payable
396
2009
$233,600,000
=
70.83%
$329,800,000
$105,000,000
=
19.14%
$548,600,000
b. Long-Term Debt-Paying Ability
1.
Debt Ratio
=
Total Liabilities
Total Assets
2009
1,346,400,000
=
83.68%
$1,609,000,000
$1,825,800,000
=
79.29%
$2,302,700,000
2. Operating Cash Flow / Total Debt
2009
$233,600,000
=
17.35%
$1,346,400,000
2008
$105,000,000
=
5.75%
$1,825,800,000
c. Profitability Ratios
1.
Net Profit Margin
=
Net Income Before Noncontrolling Income (loss),
Equity Income and Nonrecurring Items
Net Sales
2009
($184,700,000)
=
Negative
$3,242,100,000
2008
($19,900,000)
=
Negative
$3,555,100,000
2.
Return on Assets
=
Net Income Before Noncontrolling Income
(loss) and Nonrecurring Items

397
Average Total Assets
2009
($184,700,000)
=
Negative
$1,609,000,000
2008
($19,900,000)
=
Negative
$2,302,700,000
3.
Return on Total Equity
=
Net Income Before Nonrecurring Items
– Dividends on Redeemable Preferred Stock
Average Total Equity
2009
($184,700,000)
=
Negative
$262,600,000
2008
($19,900,000)
=
Negative
$476,900,000
4.
Gross Profit Margin
=
Gross Profit
Net Sales
2009
$790,600,000
=
24.39%
3,242,100,000 2008
$929,100,000
=
26.13%
$3,555,100,000
d. Investor Analysis
1. Earnings Per Common Share
2009
2. Operating Cash Flow / Cash Dividends
2009
$233,600,000
=
35.94 times
$6,500,000
2008
$105,000,000
=
5.41 times
398
$19,400,000
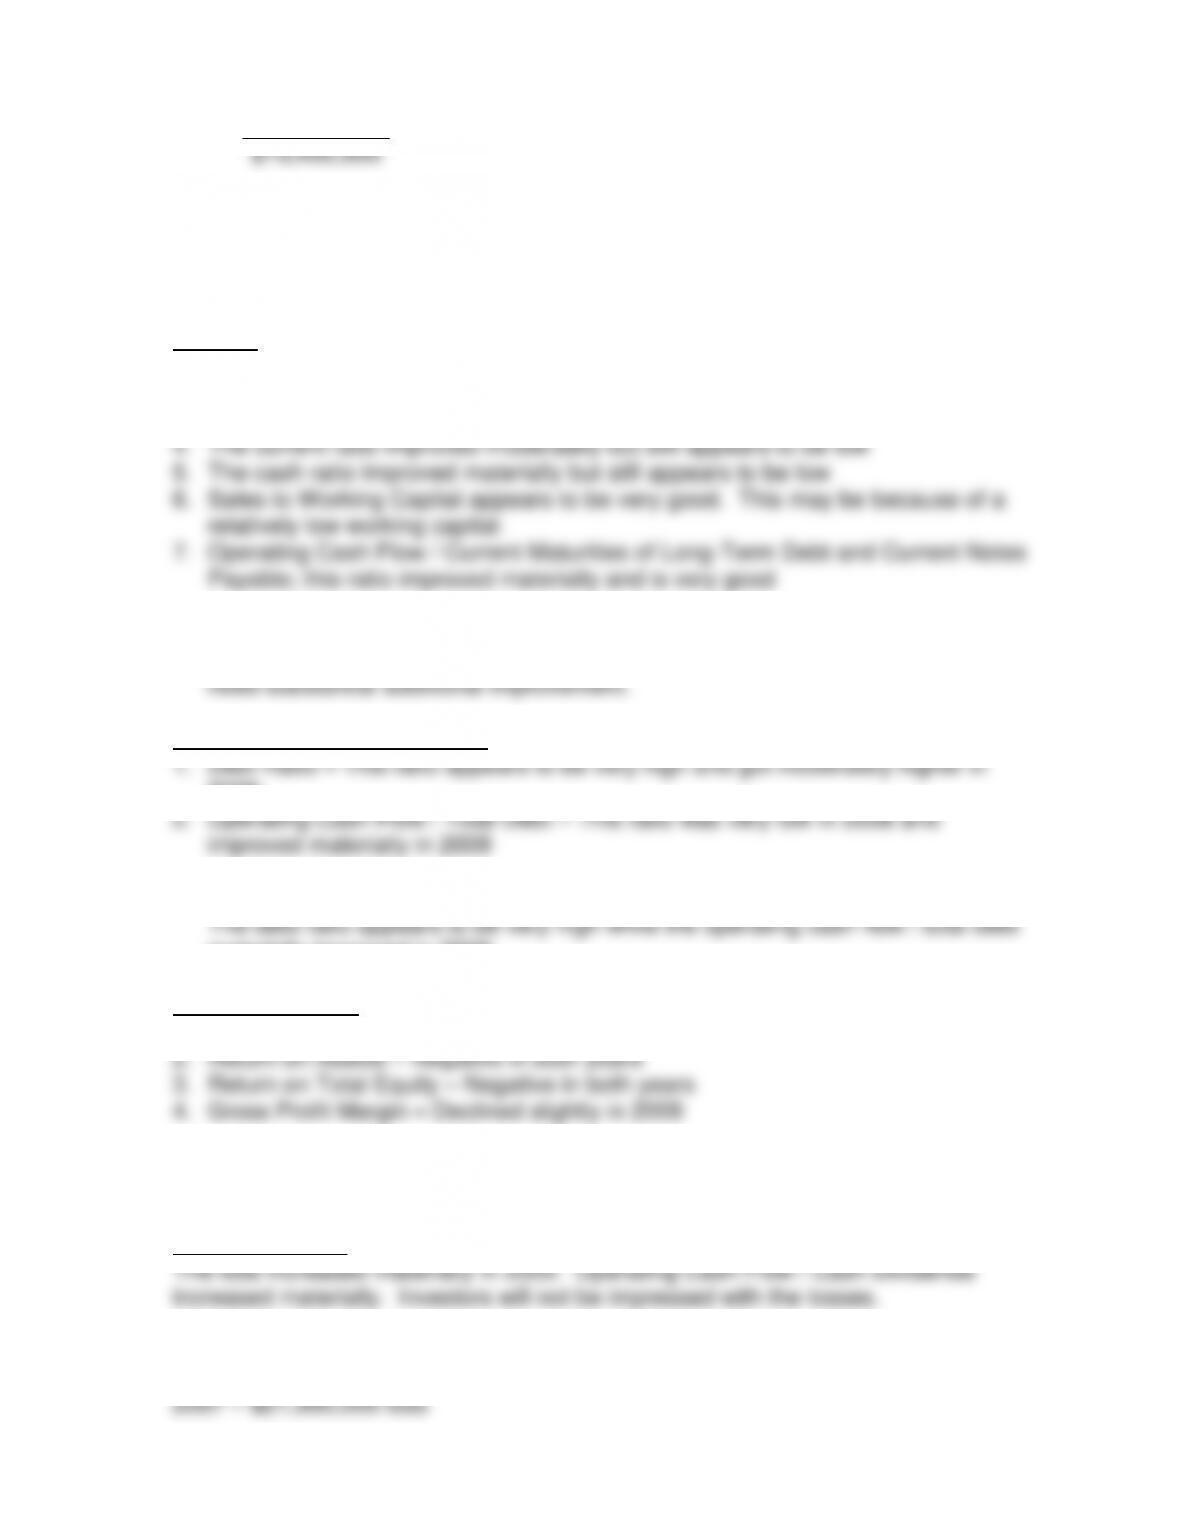
e. Liquidity
1. Days’ Sales in Inventory improved materially but still appears to be very high
2. Inventory Turnover improved materially but still appears to be very low
3. Working Capital improved materially
Summary – Liquidity
There were material improvements in liquidity. Several of the areas appear to
Long-Term Debt-Paying Ability
2009
Summary – Long-Term Debt
materially improved in 2009.
Profitability Ratios
1. Net Profit Margin – Negative in both years
Summary – Profitability
Substantial profitability problems.
Investor Analysis
f. Trend in net income (loss) is very negative
399
Net cash provided by operating activities of continuing operations increased
Capital expenditures declined materially each year.
How long can decreasing inventories provide significant cash flow? Can this firm
continue to pay cash dividends?
h. Beaver Study Indicators
1. Cash Flow / Total Debt
2. Net Income / Total Assets
3. Total Debt / Total Assets
came from decreasing inventories.