222
Chapter 8
Profitability
QUESTIONS
8- 1. Profits can be compared to the sales from which they are the residual. They can
in different directions, depending on the base.
8- 2. Extraordinary items are by nature nonrecurring. They should be segregated in
8- 3. Expenses as a percent of sales must have increased if profits as a percent of
sales declined.
8- 4. Profit margin in jewelry is usually much higher than in groceries. Groceries
8- 5. A drop in profits or a rise in the asset base could cause a decline in the ratio. For
8- 6. DuPont analysis relates return on assets to turnover and margin. It allows for
8- 7. Operating income is sales minus cost of sales and operating expenses. It does
8- 8. Equity earnings are the owner’s proportionate share of the nonconsolidated
dividends from the nonconsolidated subsidiary.
8- 9. Return on assets is a function of net profit margin and total asset turnover.
asset turnover declined sufficiently.
223
8-10. Return on investment measures return to all long-term supplies of funds. It
Return on common equity is return only to common shareholders. Net income is
the denominator.
8-11. Return on investment is a profitability measure comparing income to capital
against that capital. The interest is multiplied by the tax adjustment factor to put
interest on an after-tax basis.
8-12. This cannot be determined based only upon the absolute measures. It is
income picture.
8-13. Interim reports are less reliable because they are not audited, but they can be
8-14. An objective considered here is timeliness rather than completeness. Full
8-15. Comprehensive income includes net changes in (a) foreign currency translation
fluctuate more than other income items.
8-16. Pro forma financial information is hypothetical or a projected amount. For pro
forma formation to be meaningful the company must use a reliable estimate to

224
PROBLEMS
PROBLEM 8-1
Net Profit Margin
=
Net Income Before Minority Share of
Earnings and Nonrecurring Items
Net Sales
2011
2010
$52,500
$40,000
$1,050,000
$1,000,000
= 5.00%
= 4.00%
Return on Assets
=
Net Income Before Minority Share of
Earnings and Nonrecurring Items
Average Total Assets
2011
2010
$52,500
$40,000
$230,000
$200,000
= 22.83%
= 20.00%
Total Asset Turnover
=
Net Sales
Average Total Assets
2011
2010
$1,050,000
$1,000,000
$230,000
$200,000
=4.57 times
per year
=5.00 times
per year
Return on Common Equity
=
Net Income Before Nonrecurring
Items – Preferred Dividends
Average Common Equity
2011
2010
$52,500
$40,000
$170,000
$160,000
= 30.88%
= 25.00%
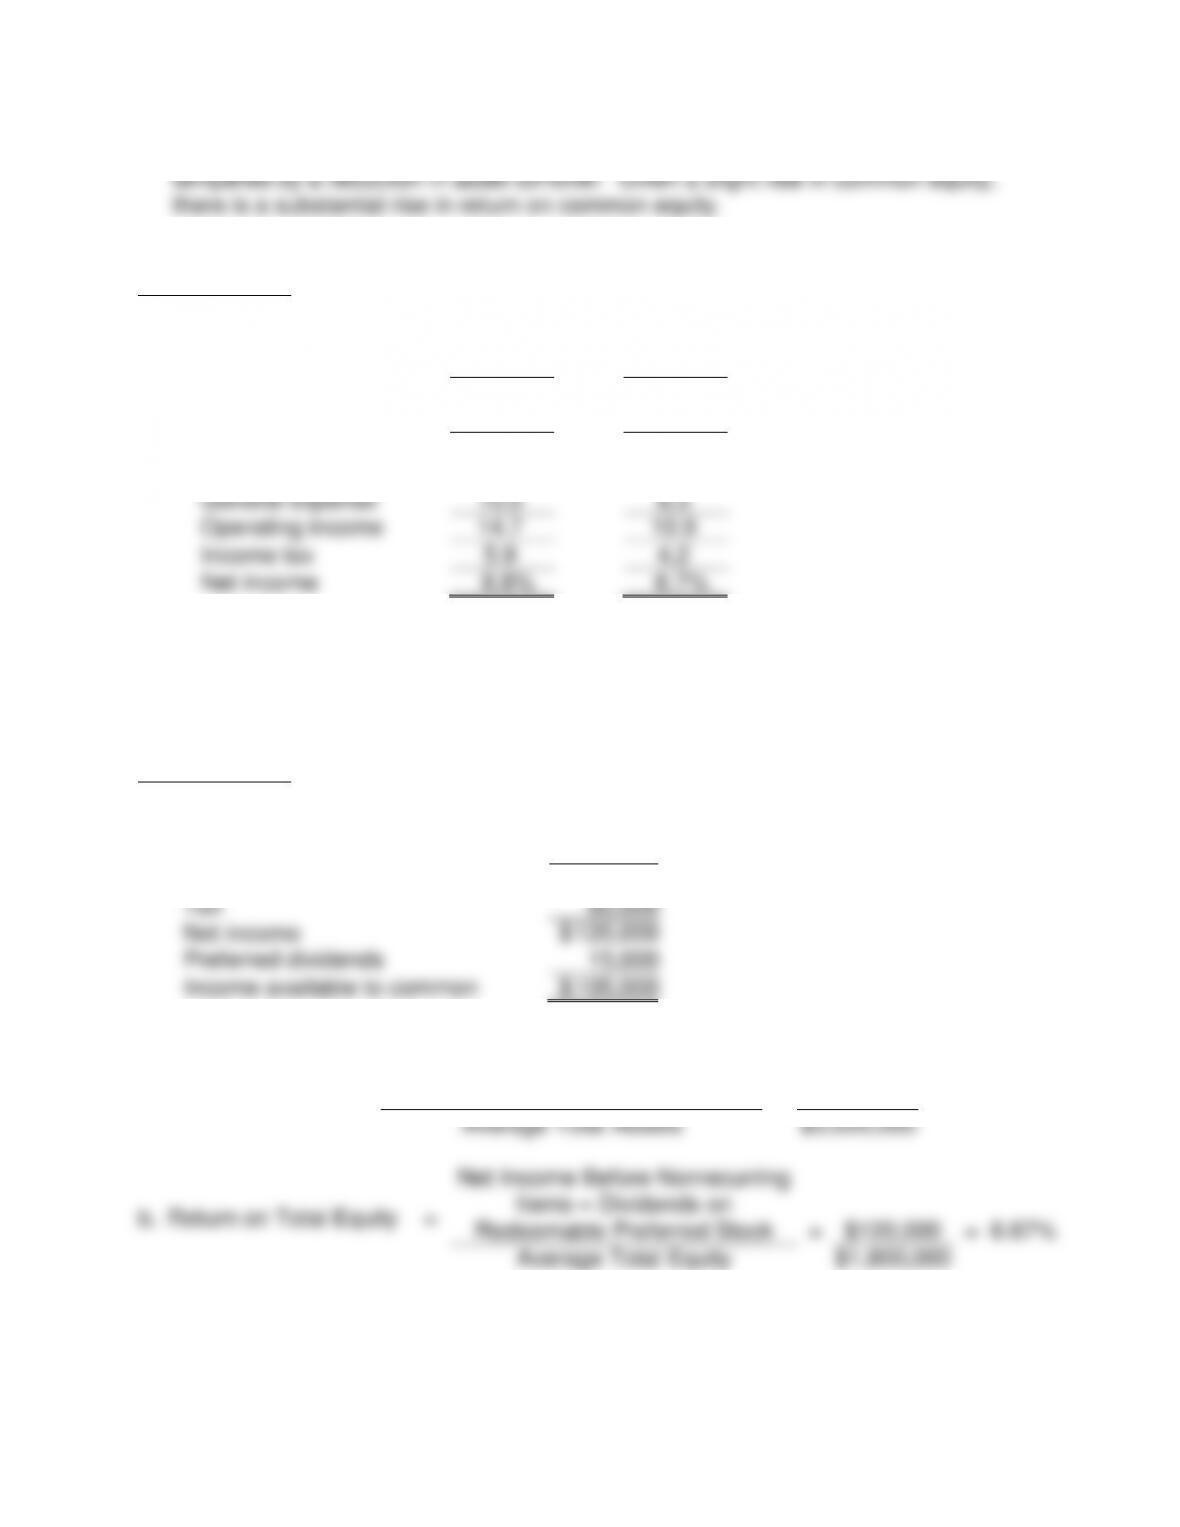
Ahl Enterprise has had a substantial rise in profit to sales. This is somewhat
PROBLEM 8-2
a.
2011
2010
Sales
100.0%
100.0%
Cost of goods sold
60.7
60.8
Gross profit
39.3
39.2
Selling expense
14.6
20.0
General expense
10.0
8.3
Operating income
14.7
10.9
Income tax
5.9
4.2
Net income
8.8%
6.7%
b. Starr Canning has had a sharp decrease in selling expense coupled with only a
modest rise in general expenses giving an overall rise in the net profit margin.
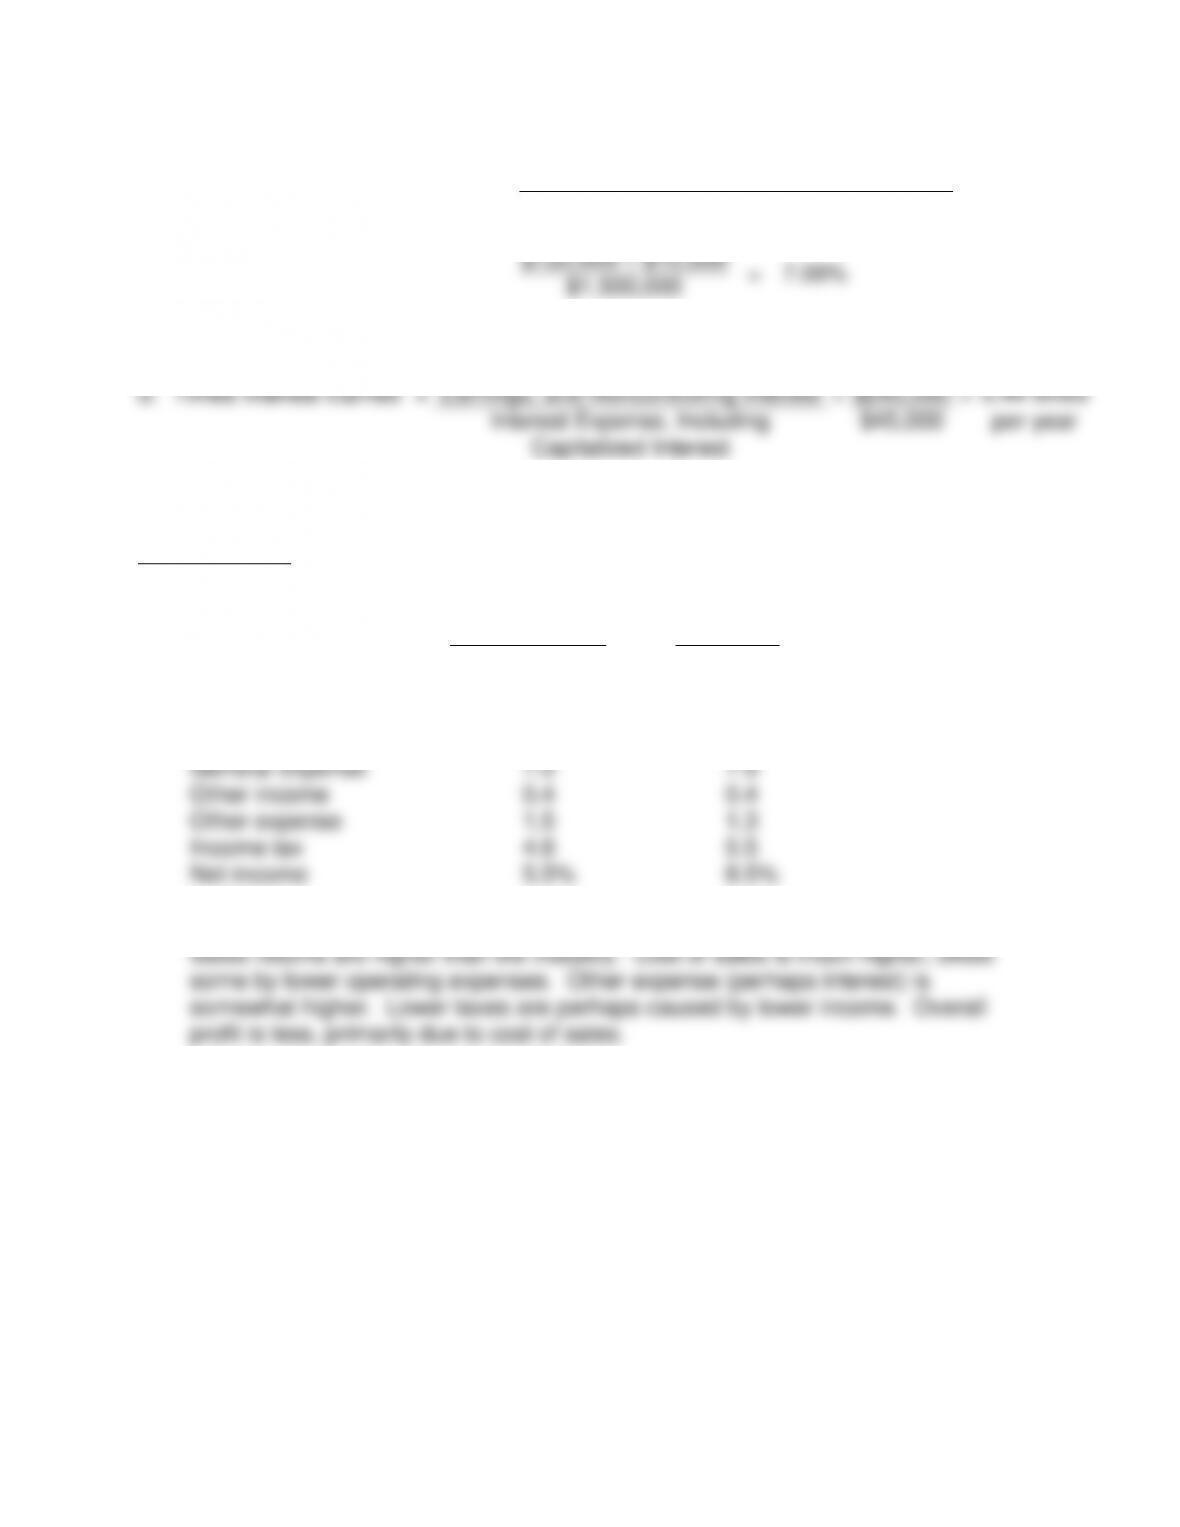
PROBLEM 8-3
Earnings before interest and tax
$
245,000
Interest (750,000 x 6%)
45,000
Earnings before tax
$
200,000
Tax
80,000
Net income
$
120,000
Preferred dividends
15,000
Income available to common
$
105,000
a.
Return on Assets
=
Net Income Before Minority Share of
Earnings Equity Income and
Nonrecurring Items
=
$120,000
=
4.00%
Average Total Assets
$3,000,000
=
$120,000
=
$1,800,000
226
c.
Return on Common Equity
=
Net Income Before Nonrecurring Items –
Preferred Dividends
Average Common Equity
$120,000 – $15,000
=
7.00%
$1,500,000
d.
Times Interest Earned
=
Recurring Earnings, Excluding
Interest Expense, Tax Expense Equity
Earnings, and Noncontrolling Interest
=
$245,000
=
5.44 times
Interest Expense, Including
Capitalized Interest
$45,000
per year
PROBLEM 8-4
Vent Molded
Plastics
Plastics
Industry
Sales
101.0
%
100.3
%
Sales returns
1.0
0.3
Cost of goods sold
72.1
67.1
Selling expense
9.4
10.1
General expense
7.0
7.9
Other income
0.4
0.4
Other expense
1.5
1.3
Income tax
4.8
5.5
Net income
5.5
%
8.5
%

227
PROBLEM 8-5
a.
$1,589,150
=
122.72%
$1,294,966
2011 sales were 122.72% of those in 2010.
b.
$138,204
=
100.80%
$137,110
2011 net earnings were 100.80% of those in 2010.
c.
1.
Net Profit Margin
=
Net Income Before Minority Share of Earnings,
Equity Income and Nonrecurring Items
Net Sales
2011
2010
$149,260
=
9.39%
$149,760
=
11.56%
$1,589,150
$1,294,966
2.
Return on Assets
=
Net Income Before Minority Share of
Earnings and Nonrecurring Items
Average Total Assets
2011
2010
$149,260
=
10.38%
$149,760
=
12.67%
$1,437,636*
$1,182,110*
*Used year end because average could not be computed for 2010.
3.
Total Asset Turnover
=
Net Sales
Average Total Assets
2011
2010
$1,589,150
=
1.11 times
$1,294,966
=
1.10 times
$1,437,636*
$1,182,110*
*Used year end because average could not be computed for 2010.
228
4.
DuPont Analysis:
Return on Assets
=
Net Profit
Margin
x
Total Asset
Turnover
2011
10.42*
=
9.39%
x
1.11
2010
10.72*
=
11.56%
x
1.10
*Rounding causes the difference from the 10.38% and 12.67% computed in (2).
5.
2011
2010
Operating income
Net sales
$
1,589,150
$
1,294,966
Less: Cost of product sold
$
651,390
$
466,250
Research and development expenses
135,314
113,100
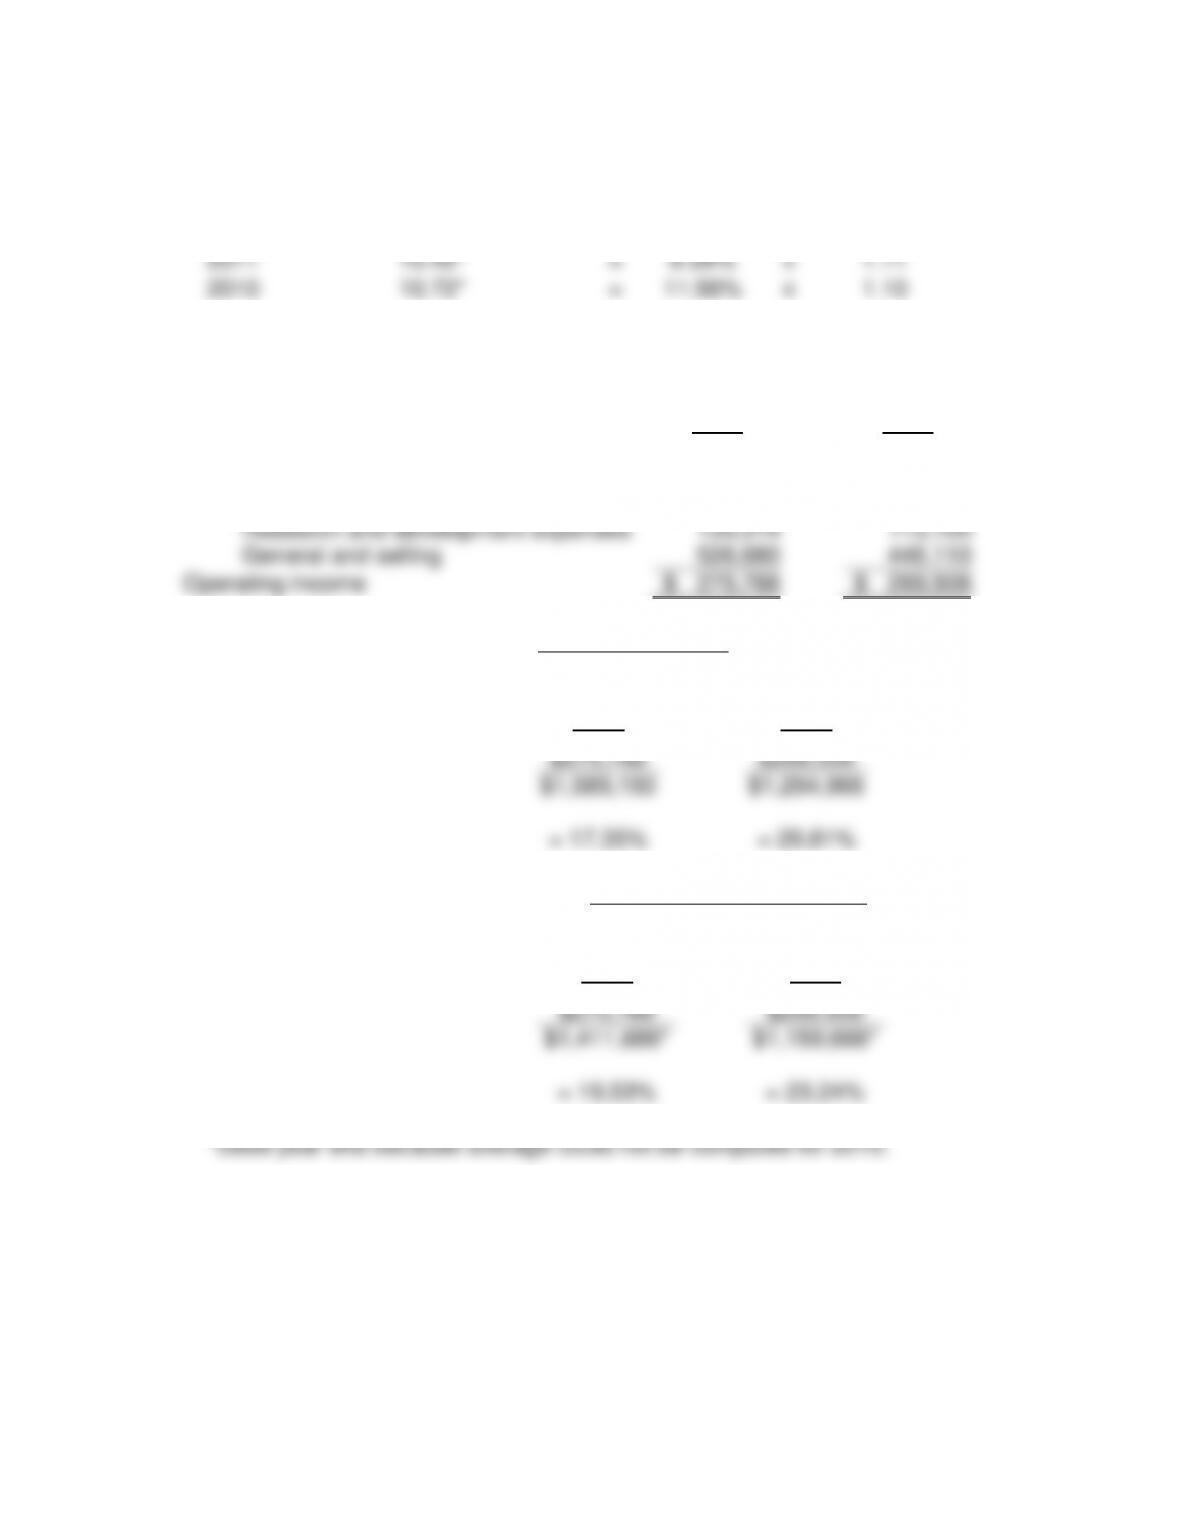
General and selling
526,680
446,110
Operating income
$
275,766
$
269,506
Operating Income Margin
=
Operating Income
Net Sales
2011
2010
$275,766
$269,506
$1,589,150
$1,294,966
= 17.35%
= 20.81%
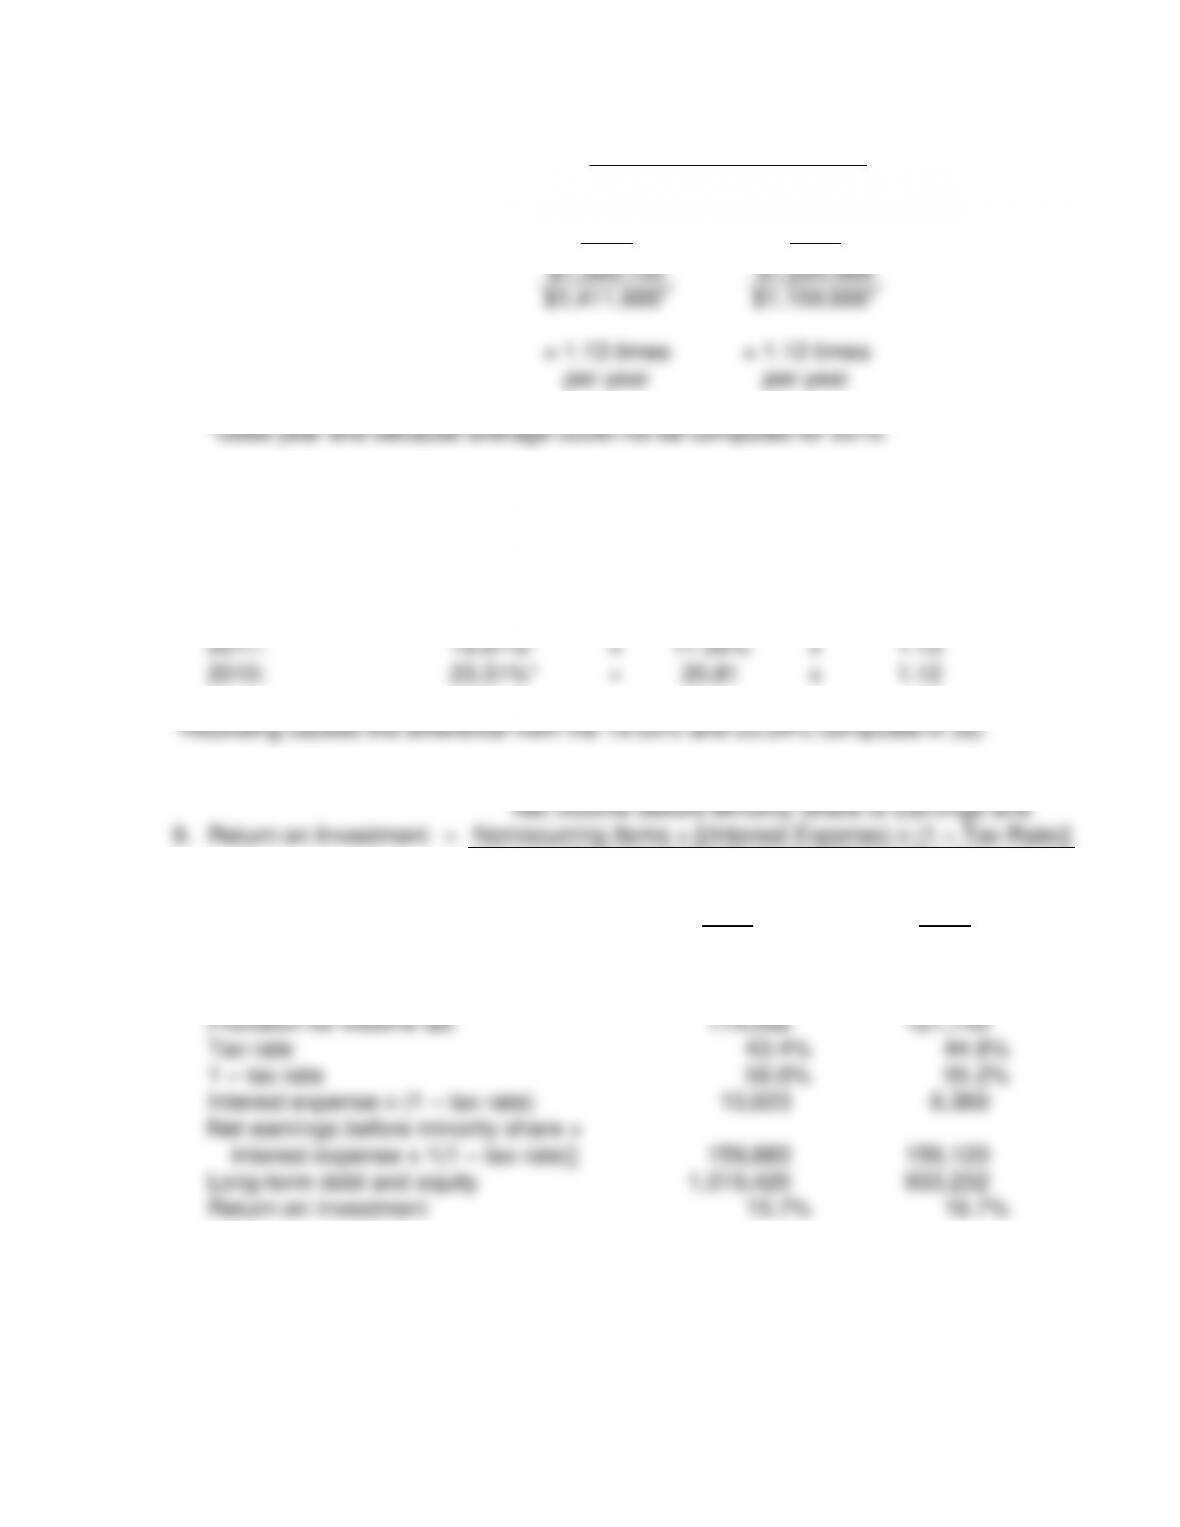
6.
Return on Operating Assets
=
Operating Income
Average Operating Assets
2011
2010
$275,766
$269,506
$1,411,686*
$1,159,666*
= 19.53%
= 23.24%
229
7.
Operating Asset Turnover
=
Net Sales
Average Operating Assets
2011
2010
$1,589,150
$1,294,966
$1,411,686*
$1,159,666*
= 1.13 times
per year
= 1.12 times
per year
8.
DuPont Analysis:
Return on
Operating Assets
=
Operating
Income
Margin
x
Operating
Asset
Turnover
2011:
19.61%*
=
17.35%
x
1.13
2010:
23.31%*
=
20.81
x
1.12
9.
Return on Investment
=
Net Income Before Minority Share of Earnings and
Nonrecurring Items + [(Interest Expense) x (1 – Tax Rate)]
Average (Long-Term Liabilities) + Equity
2011
2010
Net earnings before minority share
$
149,260
$
149,760
Interest expense
18,768
11,522
Earnings before tax
263,762
271,500
Provision for income tax
114,502
121,740
Tax rate
43.4
%
44.8
%
1 – tax rate
56.6
%
55.2
%
Interest expense x (1 – tax rate)
10,623
6,360
Net earnings before minority share +
interest expense x 1(1 – tax rate)]
159,883
156,120
Long-term debt and equity
1,019,420
933,232
Return on investment
15.7
%
16.7
%
230
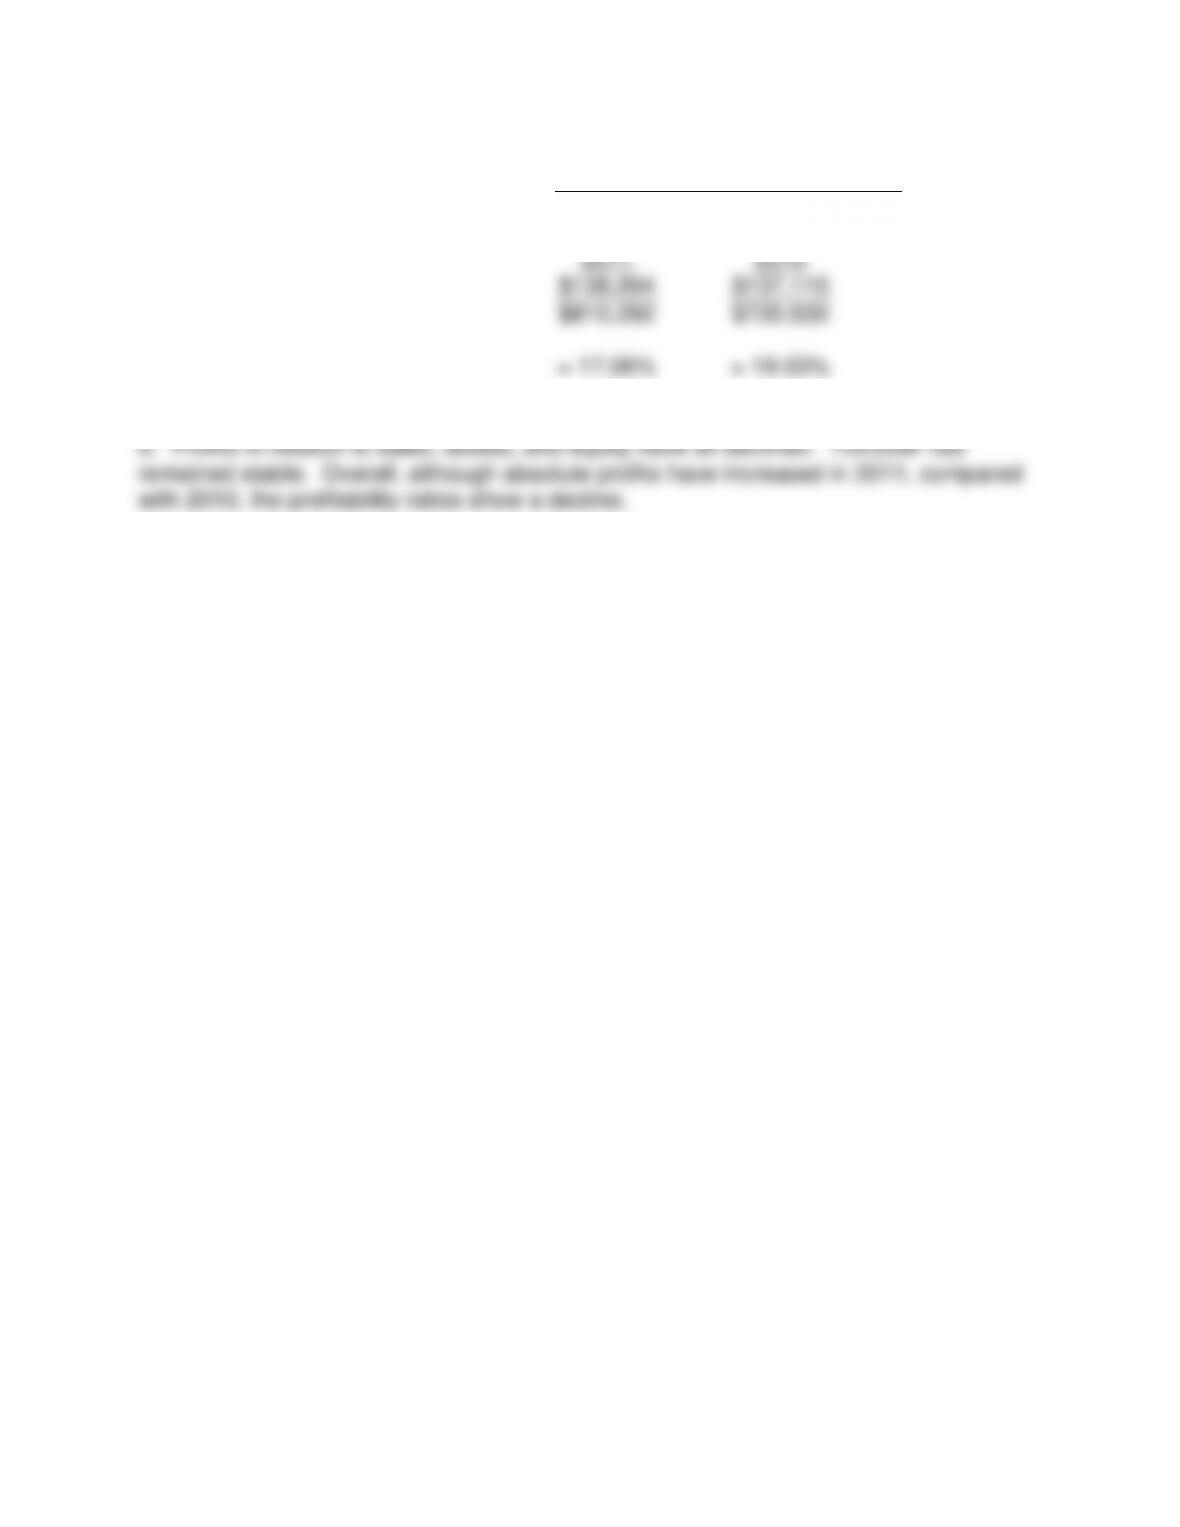
10.
Return on Common Equity
=
Net Income Before Nonrecurring
Items – Preferred Dividends
Ending Common Equity
2011
2010
$138,204
$137,110
$810,292
$720,530
= 17.06%
= 19.03%
231
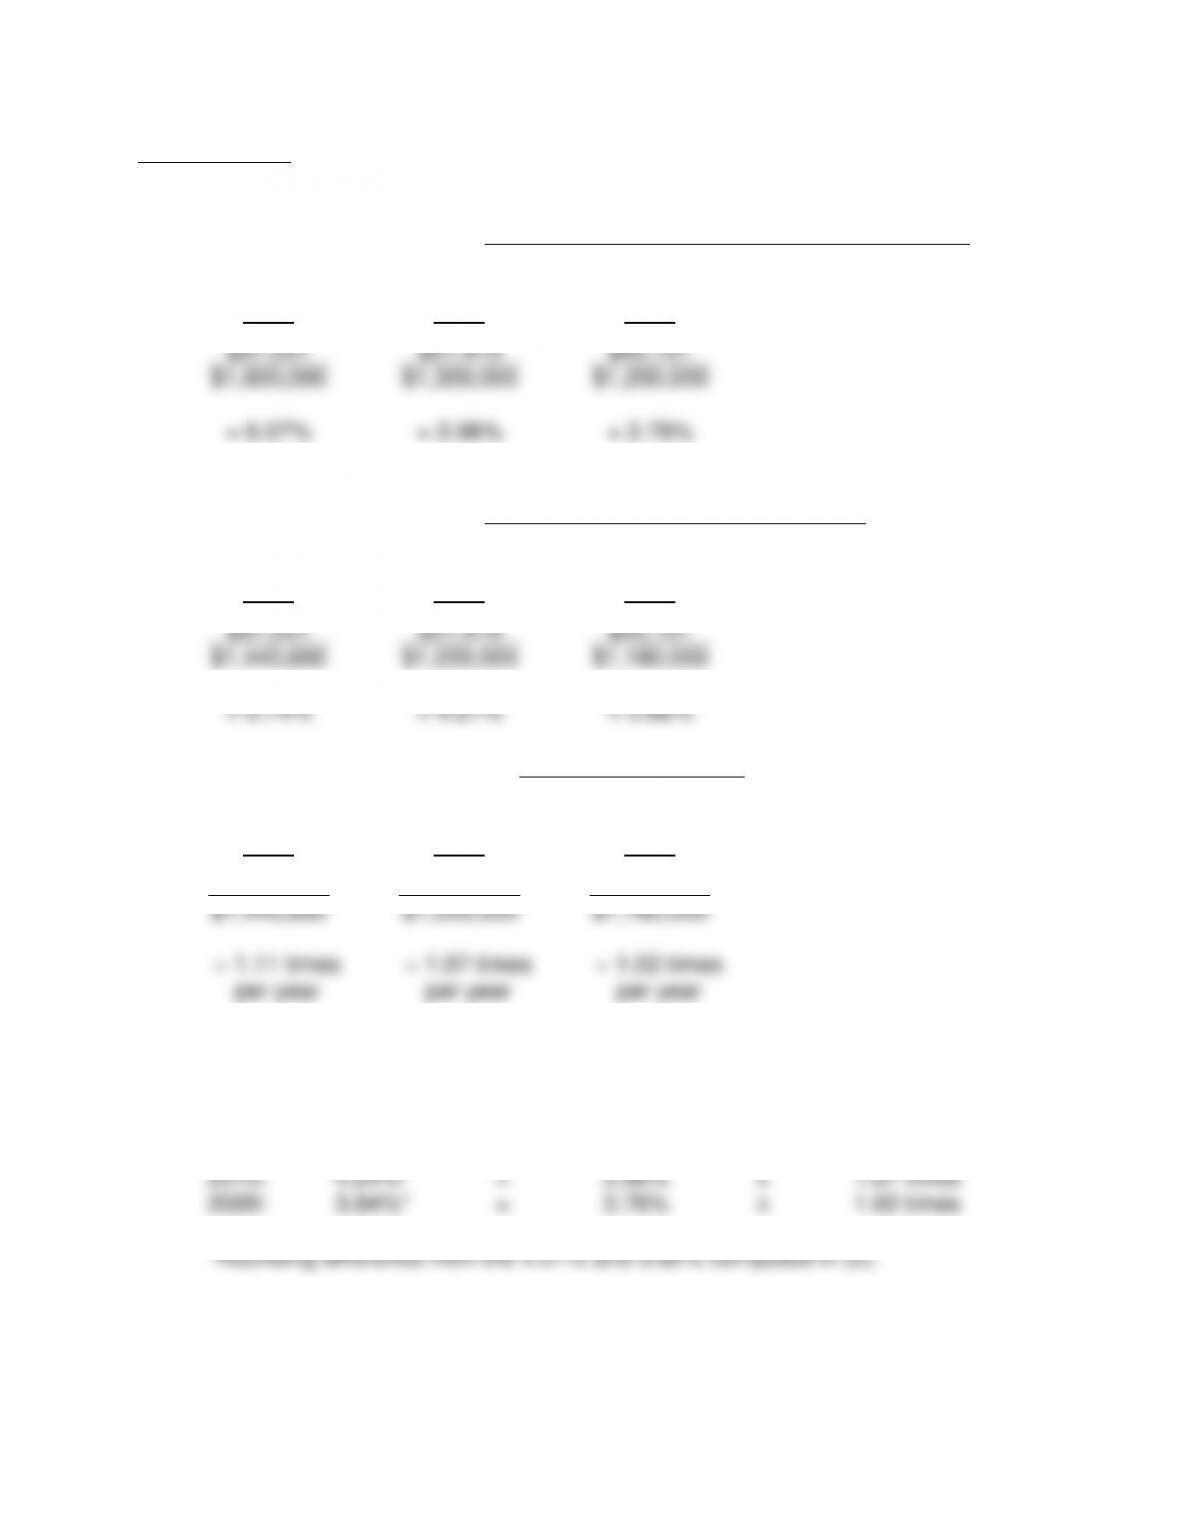
PROBLEM 8-6
a.
1.
Net Profit Margin
=
Net Income Before Noncontrolling Interest,
Equity Income and Nonrecurring Items
Net Sales
2011
2010
2009
$97,051
$51,419
$45,101
$1,600,000
$1,300,000
$1,200,000
= 6.07%
= 3.96%
= 3.76%
2.
Return on Assets
=
Net Income Before Noncontrolling
Interest and Nonrecurring Items
Average Total Assets
2011
2010
2009
$97,051
$51,419
$45,101
$1,440,600
$1,220,000
$1,180,000
= 6.74%
= 4.21%
= 3.82%
3.
Total Asset Turnover
=
Net Sales
Average Total Assets
2011
2010
2009
$1,600,000
$1,300,000
$1,200,000
$1,440,600
$1,220,000
$1,180,000
= 1.11 times
per year
= 1.07 times
per year
= 1.02 times
per year
4. DuPont Analysis
Return on Assets
=
Net Profit Margin
x
Total Asset Turnover
2011:
6.74%
=
6.07%
x
1.11 times
2010:
4.24%*
=
3.96%
x
1.07 times
2009:
3.84%*
=
3.76%
x
1.02 times