176
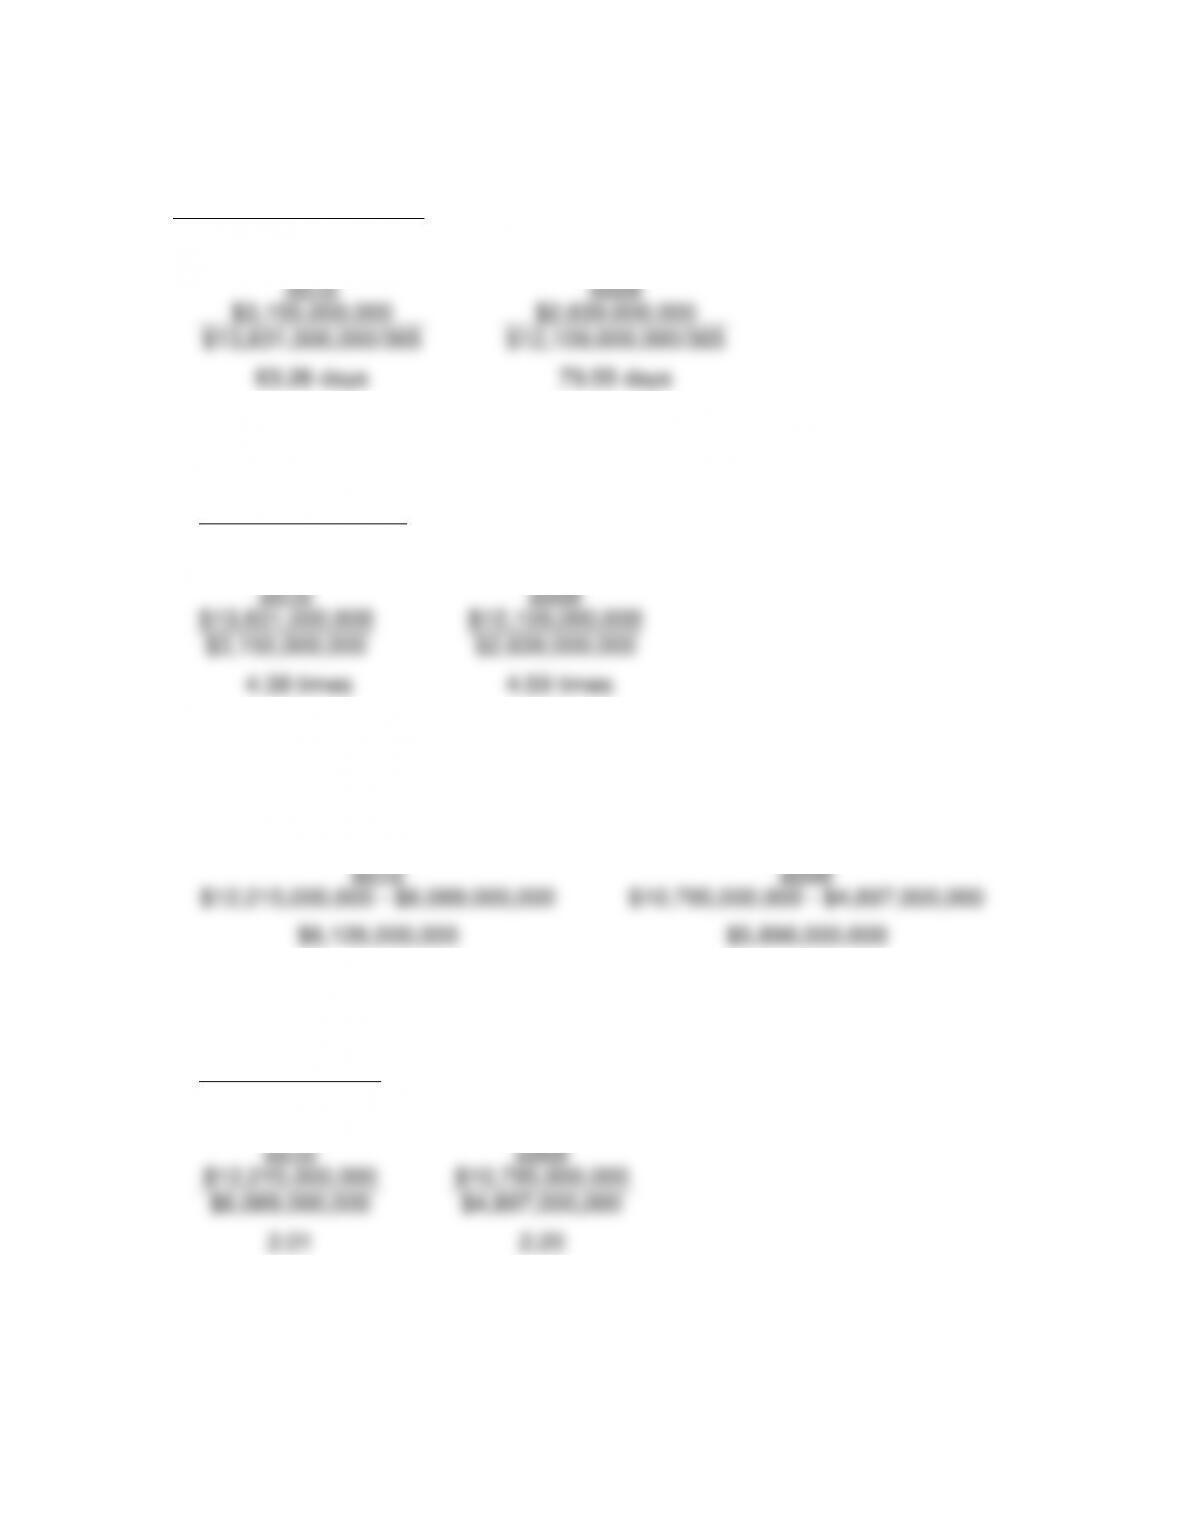
3. Days’ Sales in Inventory
Ending Inventory
Cost of Goods Sold/365
2010
2009
$3,155,000,000
$2,639,000,000
$13,831,000,000/365
$12,109,000,000/365
83.26 days
79.55 days
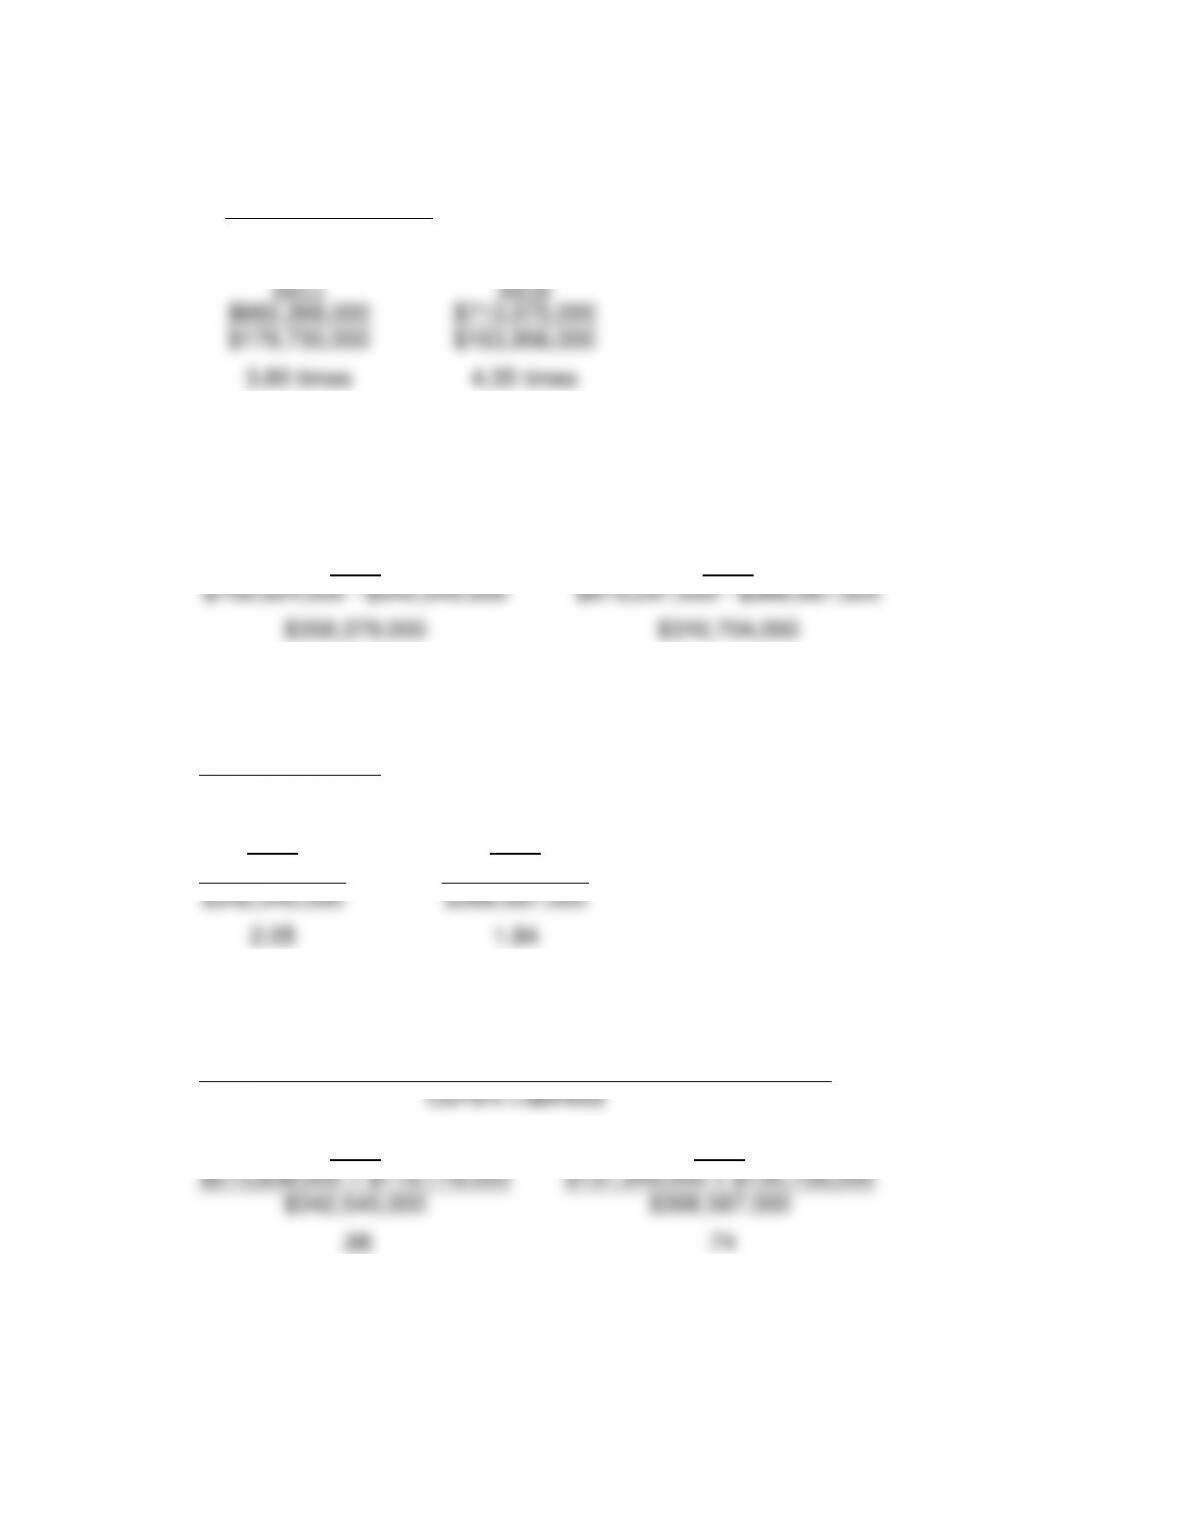
4. Inventory Turnover
Cost of Goods Sold
Year-End Inventory
2010
2009
$13,831,000,000
$12,109,000,000
$3,155,000,000
$2,639,000,000
4.38 times
4.59 times
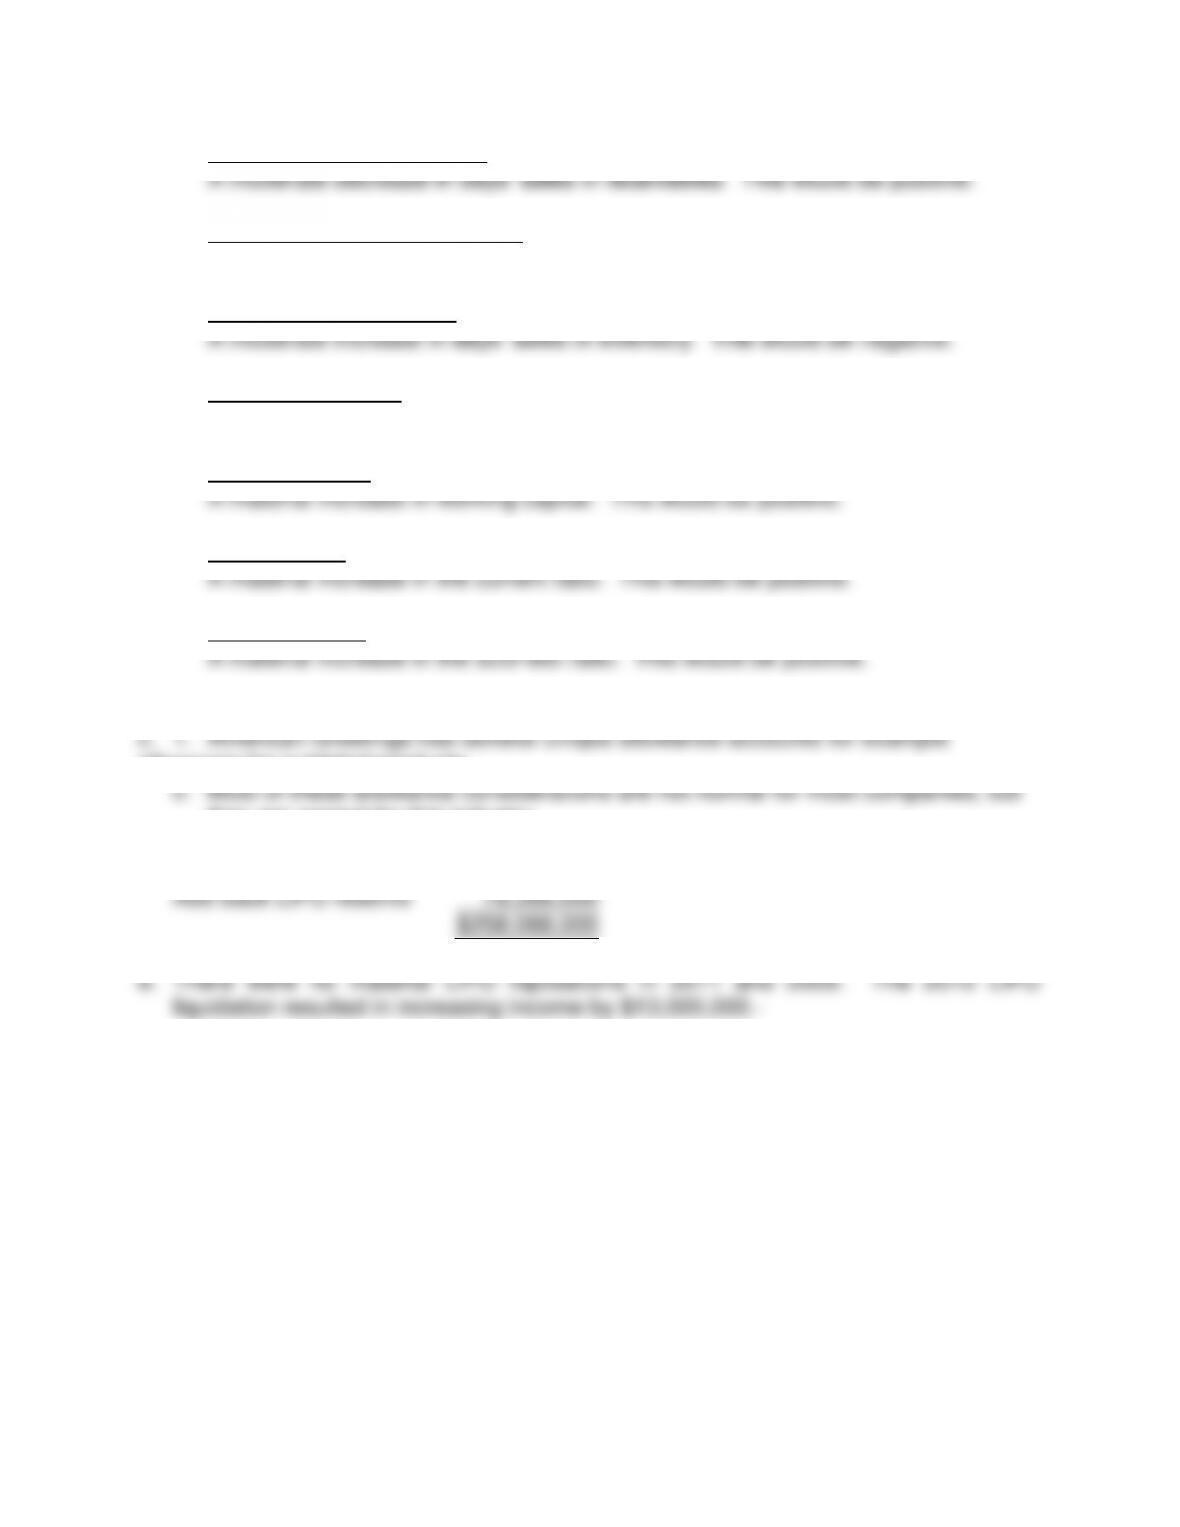
5. Working Capital
Current Assets – Current Liabilities
2010
2009
$12,215,000,000 – $6,089,000,000
$10,795,000,000 – $4,897,000,000
$6,126,000,000
$5,898,000,000
6. Current Ratio
Current Assets
Current Liabilities
2010
2009
$12,215,000,000
$10,795,000,000
$6,089,000,000
$4,897,000,000
2.01
2.20
177
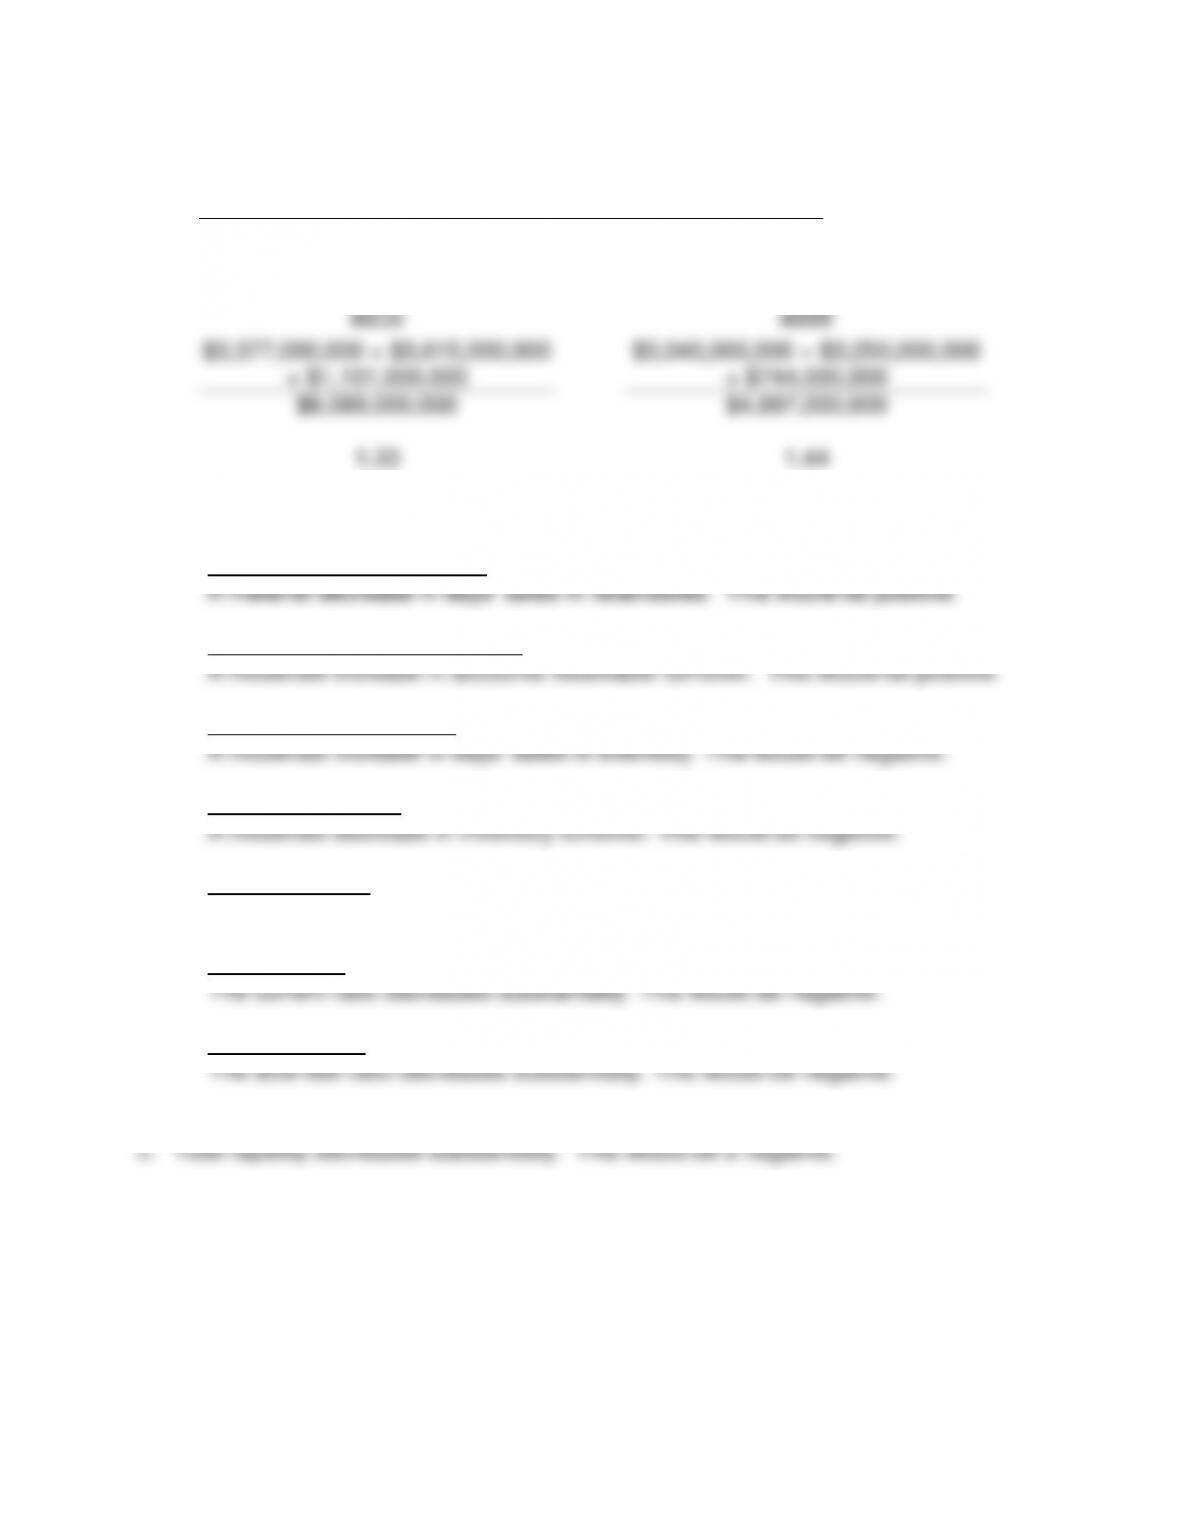
7. Acid Test Ratio
Cash Equivalents + Marketable Securities + Net Receivables
Current Liabilities
2010
2009
$3,377,000,000 + $3,615,000,000
+ $1,101,000,000
$3,040,000,000 + $3,250,000,000
+ $744,000,000
$6,089,000,000
$4,897,000,000
1.33
1.44
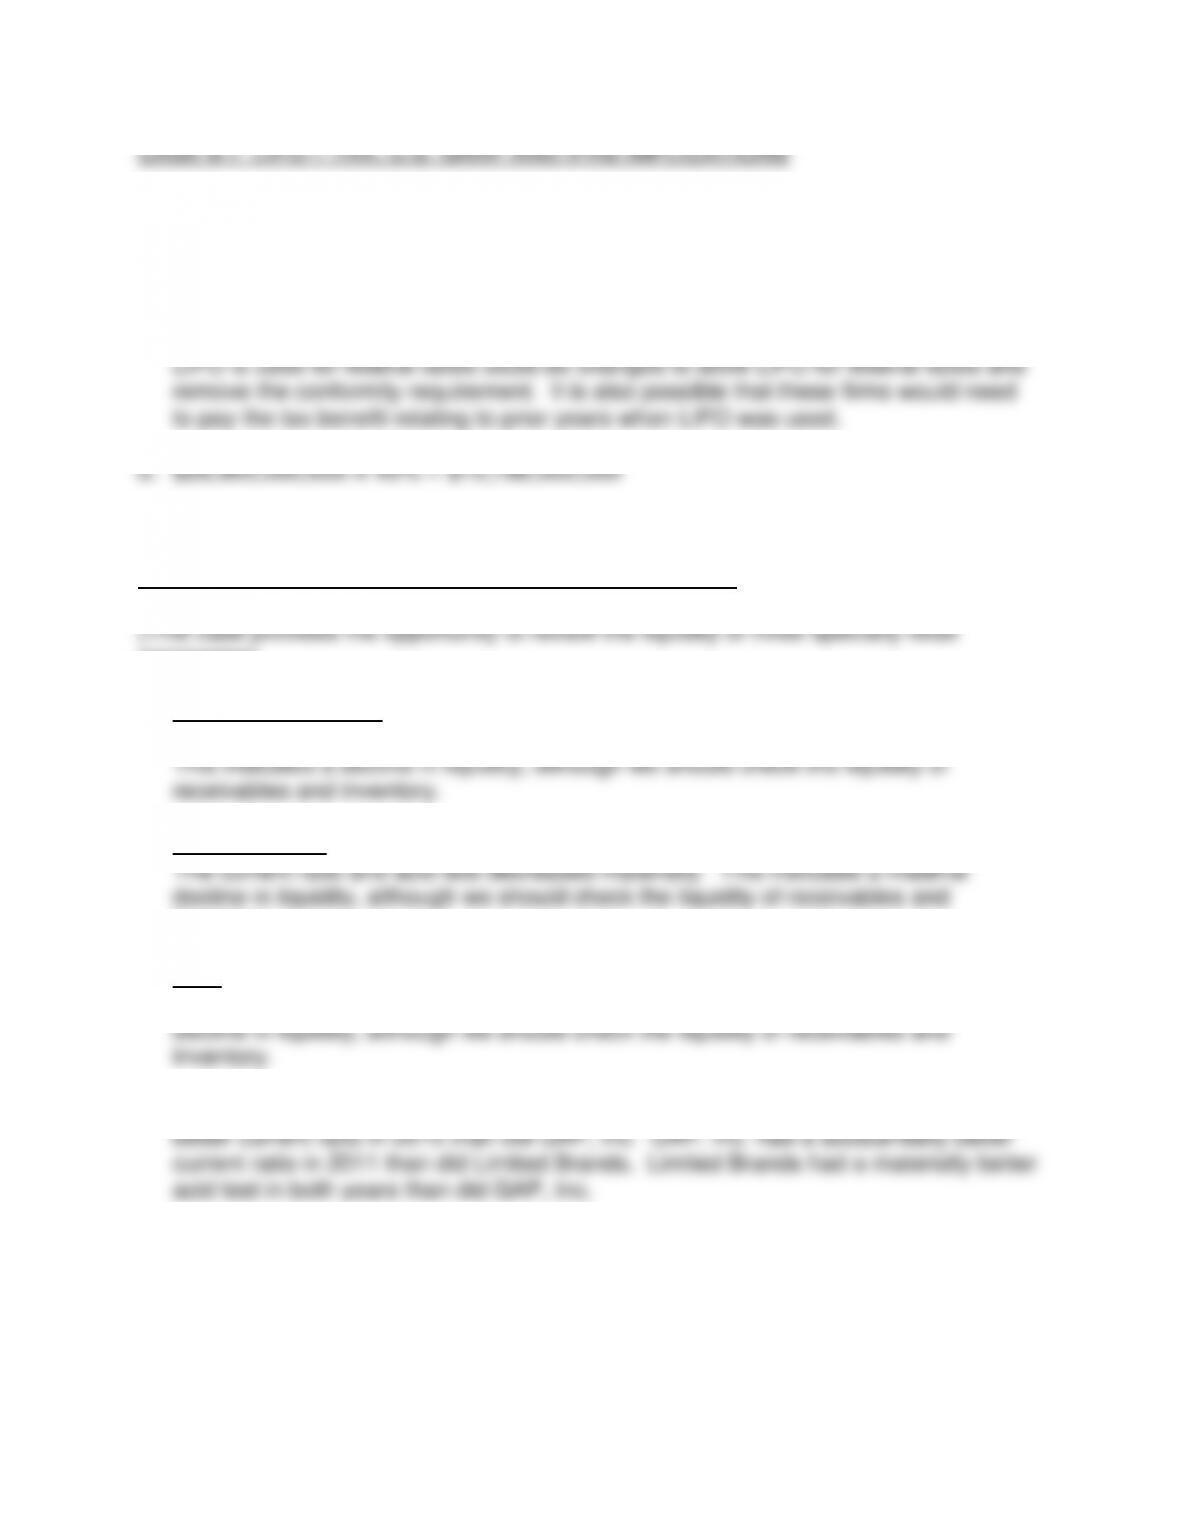
b. 1. Days’ Sales in Receivables
2. Accounts Receivable Turnover
3. Days’ Sales in Inventory
4. Inventory Turnover
5. Working Capital
Working capital increased moderately. This would positive.
6. Current Ratio
7. Acid-Test Ratio
The negative indicators for inventory more than compensated for the moderate
improvement in receivables.
178
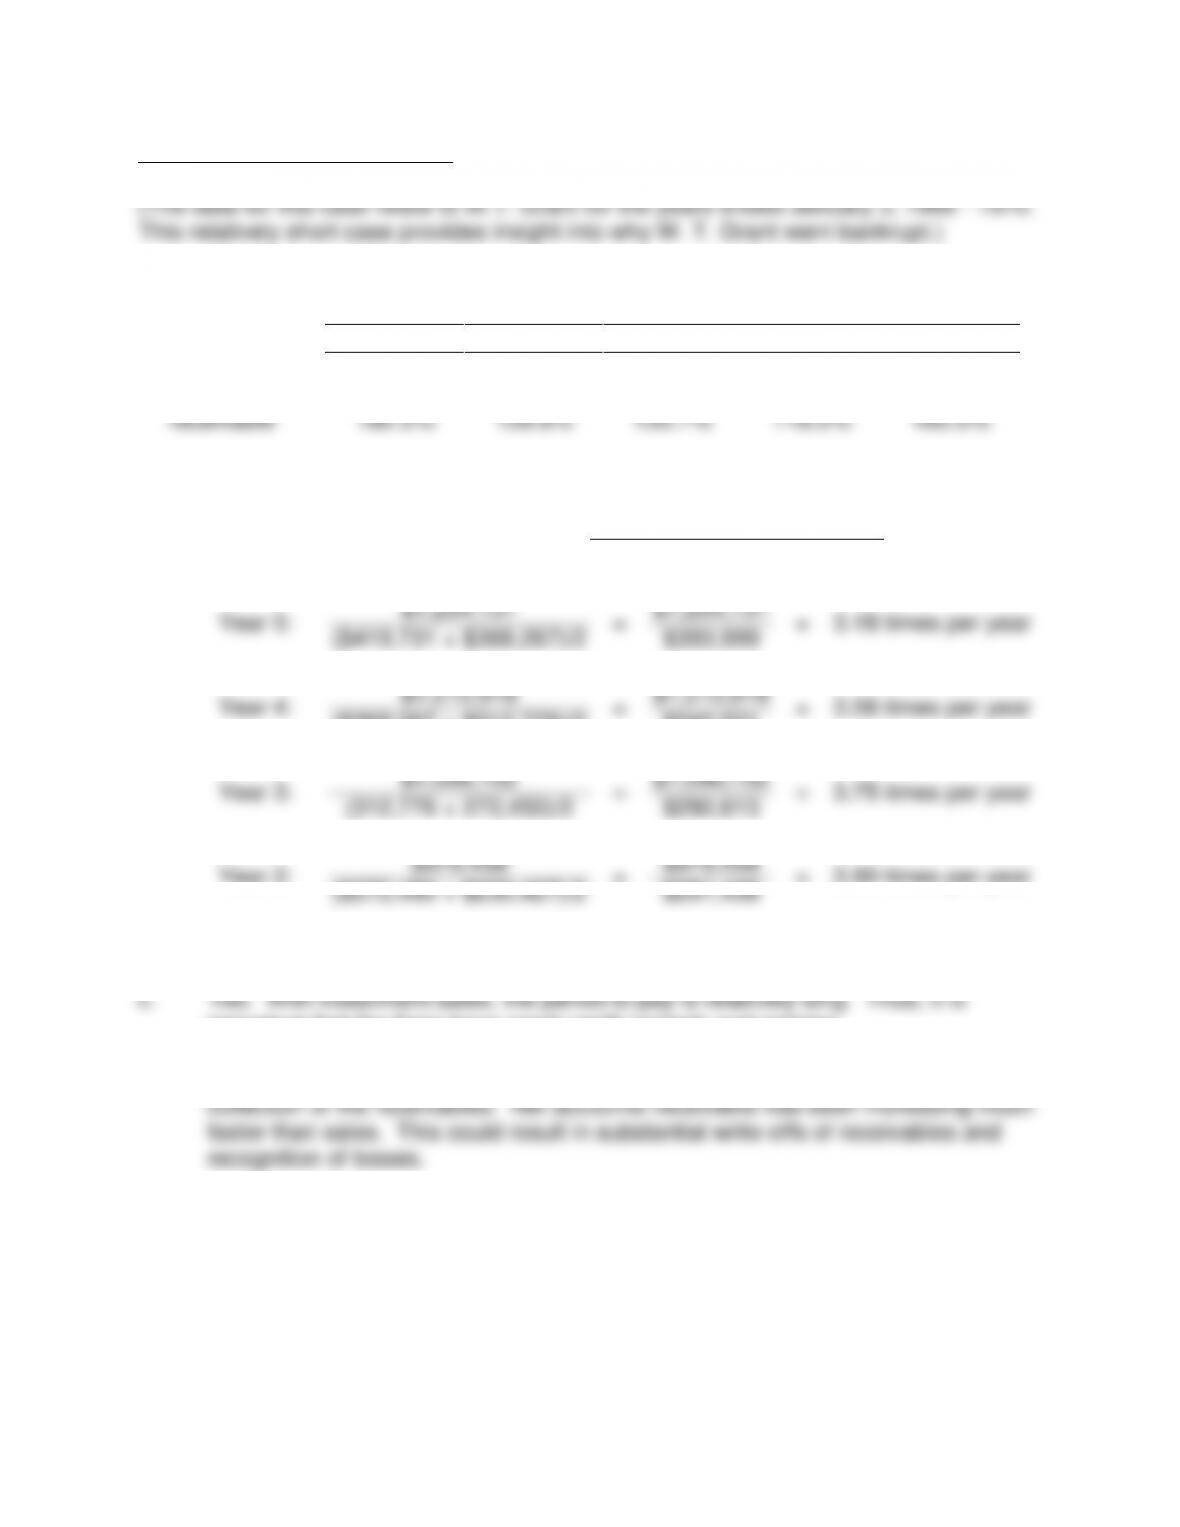
CASE 6-5 BOOMING RETAIL
a.
Year
5
4
3
2
1
Sales
136.2%
131.5%
119.0%
106.4%
100.0%
Net accounts
receivable
182.2%
159.8%
135.7%
118.2%
100.0%
b.
Accounts Receivable Turnover
=
Net Sales
Average Gross Receivables
Year 5:
$1,254,131
=
$1,254,131
=
3.18 times per year
($419,731 + $368,267)/2
$393,999
Year 4:
$1,210,918
=
$1,210,918
=
3.56 times per year
($368,267 + $312,776)/2
$340,521
Year 3:
$1,096,152
=
$1,096,152
=
3.75 times per year
(312,776 + 272,450)/2
$292,613
Year 2:
$979,458
=
$979,458
=
3.90 times per year
($272,450 + $230,427)/2
$251,438
important that the firms have good credit controls and policies.
d. It appears that The Grand has a problem with credit controls and subsequent
179
CASE 6-6 GREETING
(This case presents the opportunity to review liquidity and LIFO).
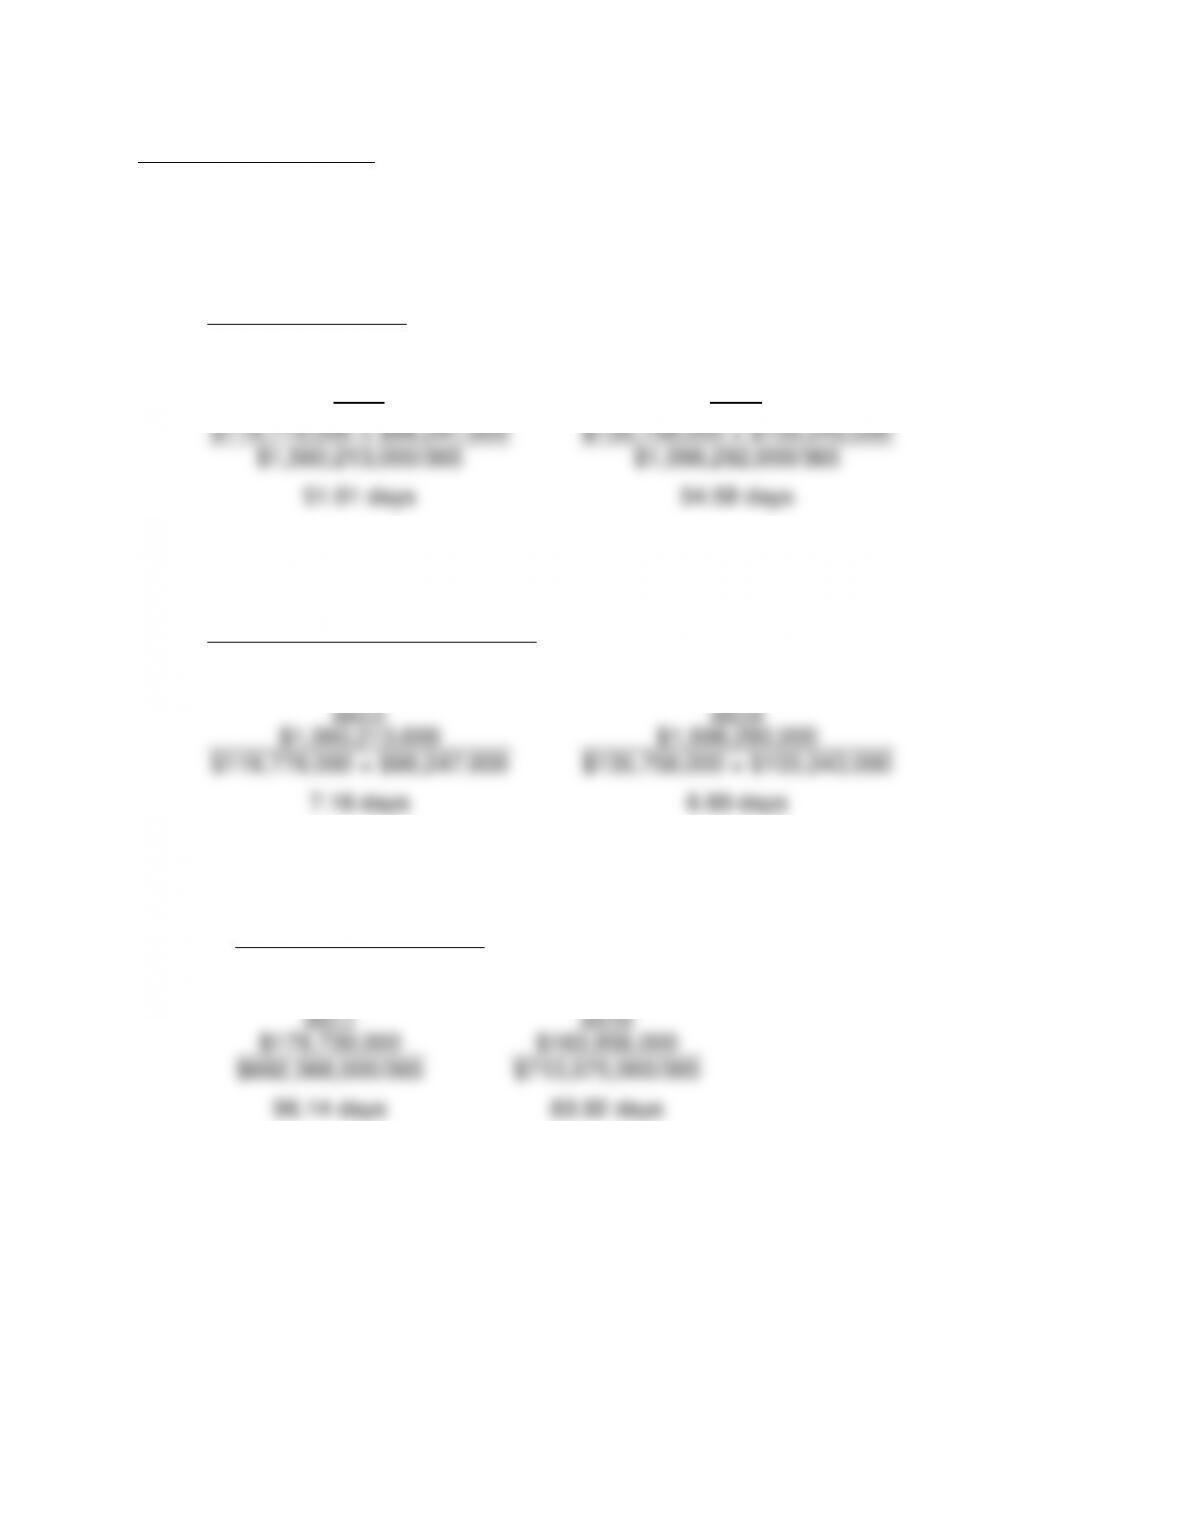
a. 1. Days’ sales in receivables
Gross Receivables
Net Sale/365
2011
2010
$119,779,000 + $98,247,000
$135,758,000 + $103,243,000
$1,560,213,000/365
$1,598,292,000/365
51.01 days
54.58 days
2. Accounts Receivable Turnover
Net Sales
Gross Receivables at Year-End
2011
2010
$1,560,213,000
$1,598,292,000
$119,779,000 + $98,247,000
$135,758,000 + $103,243,000
7.16 days
6.69 days
3. Days’ Sales in Inventory
Ending Inventory
Cost of Goods Sold/365
2011
2010
$179,730,000
$163,956,000
$682,368,000/365
$713,075,000/365
96.14 days
83.92 days
180
4. Inventory Turnover
Cost of Goods Sold
Year-End Inventory
2011
2010
$682,368,000
$713,075,000
$179,730,000
$163,956,000
3.80 times
4.35 times
5. Working Capital
Current Assets – Current Liabilities
2011
2010
$700,924,000 – $342,545,000
$679,291,000 – $368,587,000
$358,379,000
$310,704,000
6. Current Ratio
Current Assets
Current Liabilities
2011
2010
$700,924,000
$679,291,000
$342,545,000
$368,587,000
2.05
1.84
7. Acid Test Ratio
Cash Equivalents + Marketable Securities + Net Receivables
Current Liabilities
2011
2010
$215,838,000 + $119,779,000
$137,949,000 + $135,758,000
$342,545,000
$368,587,000
.98
.74
181
b. 1. Days’ Sales in Receivables
2. Accounts Receivable Turnover
A material increase in accounts receivable turnover. This would be positive.
3. Days’ Sales in Inventory
4. Inventory Turnover
A material decrease in inventory turnover. This would be negative.
5. Working Capital
6. Current Ratio
7. Acid-Test Ratio
allowance for outdated products.
they are normal for this industry.
d.
Net inventory
$179,730,000
Add back LIFO reserve
78,358,000
$258,088,000
f. The total liquidity situation appeared to be good, but days’ sales in inventory
increased and inventory turnover decreases. The inventory trends were negative.
182
(This case provides the tax, U.S. GAAP and IFRS implications of LIFO).
Required
a. They would need to switch off of LIFO for financial reporting. The implications for
taxes are not clear. The law requiring a firm to use LIFO for financial reporting if
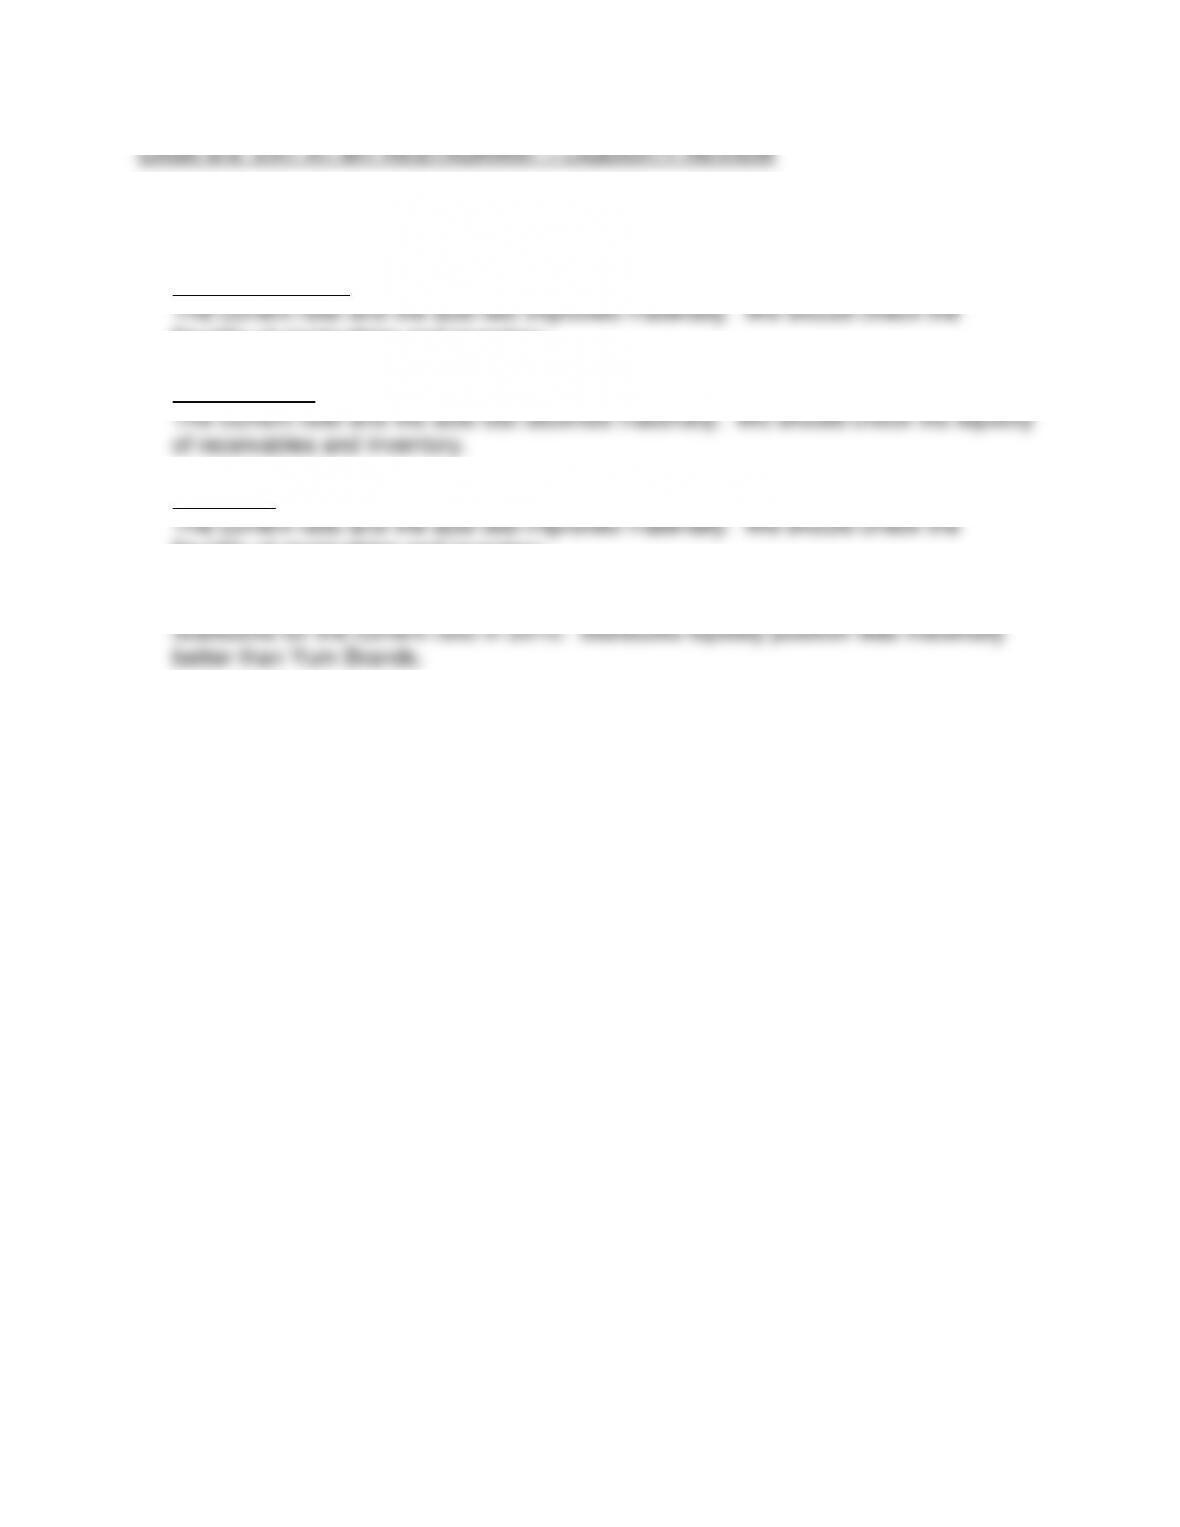
CASE 6-8 SPECIALTY RETAILER – LIQUIDITY REVIEW
companies).
a. Abercrombie & Fitch
The current ratio decreased moderately while the acid test decreased materially.
Limited Brands
inventory.
GAP
The current ratio and acid-test decreased materially. This indicates a material
b. Abercrombie & Fitch had the best liquidity position. Limited Brands had a materially
183
(This case provides the opportunity to review the liquidity of three restaurant
companies).
a. Yum Brands, Inc.
liquidity of receivables and inventory.
Panera Bread
Starbucks
liquidity of receivables and inventory.
b. Panera Bread had the best liquidity position, although it was only slightly better than