
7.17 You are hired to upgrade the existing water treatment plant for Nittany Lion City.
Using the historical records provided in Table 7.24, forecast the water demand through
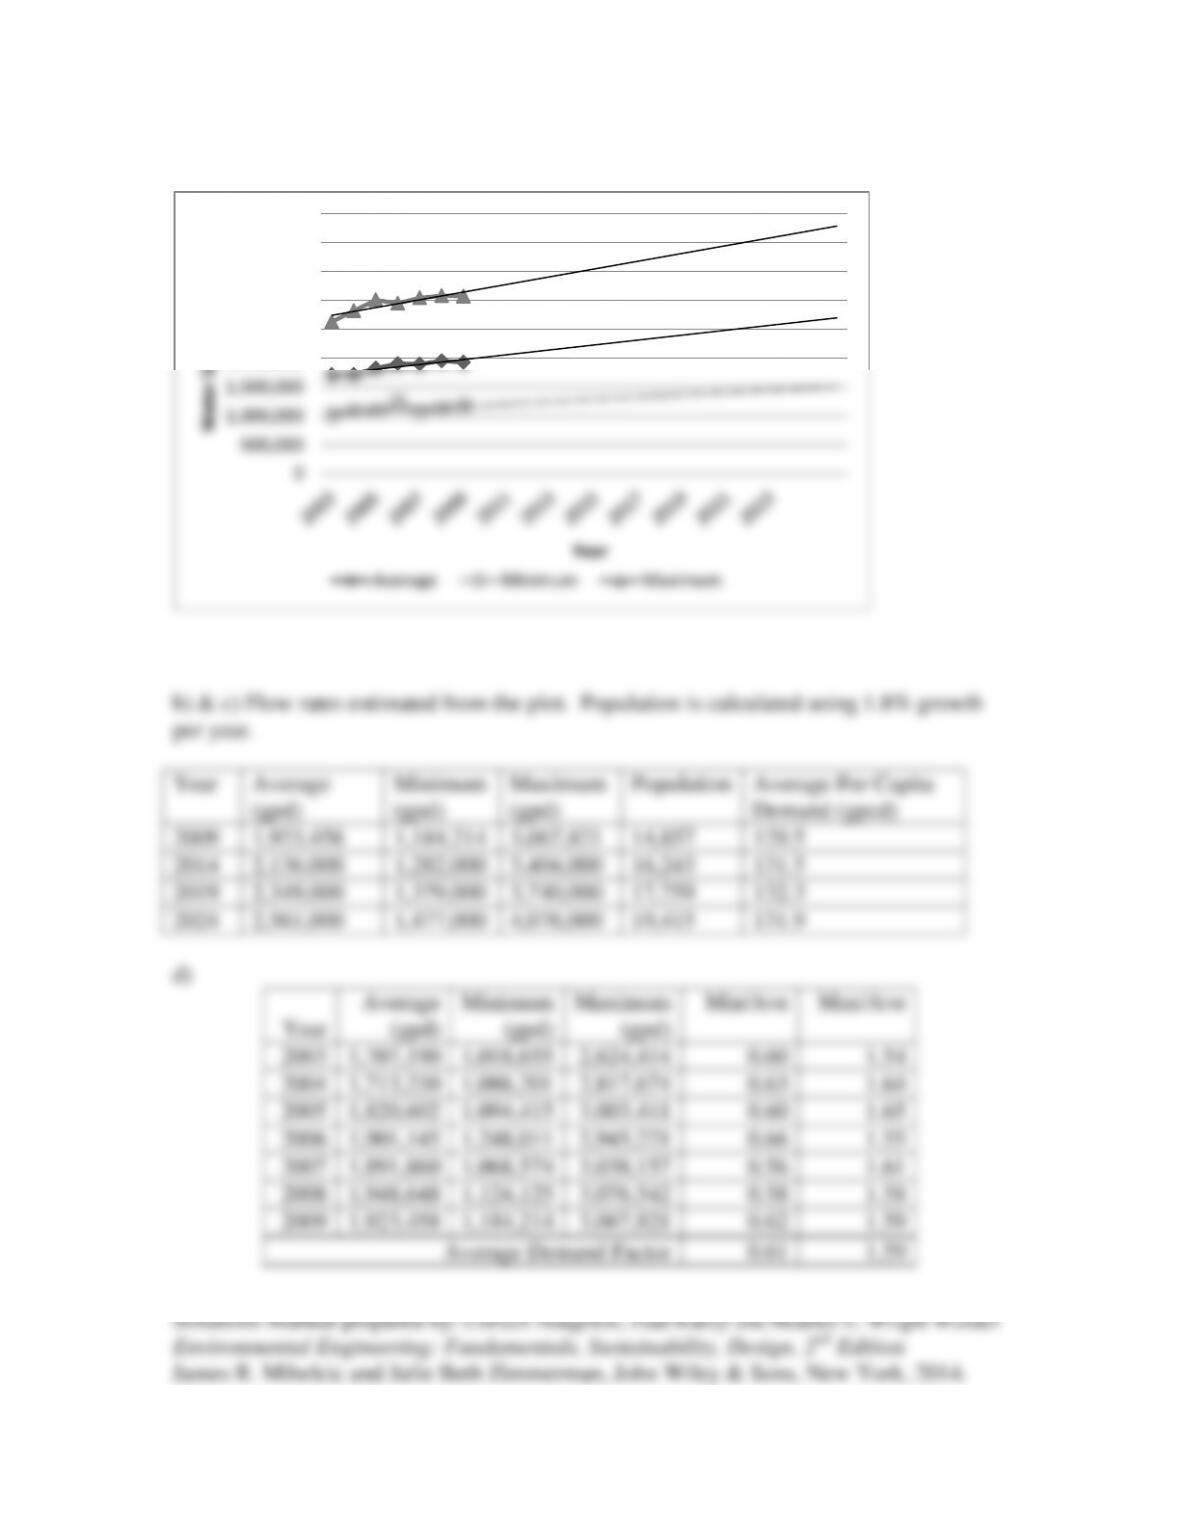
2024. The population is expected to increase about 1.8 percent per year. (a) Create a
graph that has the historical average, minimum-day, and maximum-day water demand in
gpd for each year. Extrapolate trend lines for the projected future water demand through
2015. (b) Use your graph to predict the average, minimum-day, and maximum-day water
demand for years 2014, 2019, and 2024. (c) Estimate the 2009, 2014, 2019, and 2024 per
capita water use by calculating the average water use divided by the population served.
(d) Determine a demand factor for the minimum-day and maximum-day demand, using
the historical records.
Table / 7.24
Historical Records Used to Solve Problem 7.17
Year
Water Demand (gpd)
Population
Served
Average
Minimum
Maximum
2003
1,707,190
1,018,655
2,624,414
14,251
2004
1,713,230
1,086,201
2,817,674
14,352
2005
1,820,602
1,094,415
3,003,411
14,354
2006
1,901,145
1,248,011
2,945,221
14,598
2007
1,891,860
1,068,574
3,038,157
14,587
2008
1,948,648
1,124,125
3,076,542
14,684
2009
1,923,458
1,184,214
3,067,821
14,857
Solution:
a)
b) & c) Flow rates estimated from the plot. Population is calculated using 1.8% growth
per year.
Year
Average
(gpd)
Minimum
(gpd)
Maximum
(gpd)
Population
Average Per Capita
Demand (gpcd)
2009
1,923,458
1,184,214
3,067,821
14,857
129.5
2014
2,136,000
1,282,000
3,404,000
16,243
131.5
2019
2,349,000
1,379,000
3,740,000
17,759
132.3
2024
2,561,000
1,477,000
4,076,000
19,415
131.9
d)
Year
Average
(gpd)
Minimum
(gpd)
Maximum
(gpd)
Min/Ave
Max/Ave
2003
1,707,190
1,018,655
2,624,414
0.60
1.54
2004
1,713,230
1,086,201
2,817,674
0.63
1.64
2005
1,820,602
1,094,415
3,003,411
0.60
1.65
2006
1,901,145
1,248,011
2,945,221
0.66
1.55
2007
1,891,860
1,068,574
3,038,157
0.56
1.61
2008
1,948,648
1,124,125
3,076,542
0.58
1.58
2009
1,923,458
1,184,214
3,067,821
0.62
1.59
Average Demand Factor
0.61
1.59
1,000,000
1,500,000
2,000,000
2,500,000
3,000,000
3,500,000
4,000,000
4,500,000

7.18 You are hired to upgrade the existing water treatment plant for USF City. Using the
historical records in Table 7.25, forecast the water demand through 2024. A new industry
is expected to require 65,000 gpd starting in 2016.
Table / 7.25
Historical Records Used to Solve Problem 7.18
Year
Metered Flow from Treatment
Plant (gpd)
Metered Flow Based on Billing
Records (gpd)
Domestic
Commercial
Industrial
2003
1,687,517
824,247
423,229
92,676
2004
1,789,453
837,055
465,232
102,707
2005
1,745,658
828,103
476,429
76,916
2006
1,728,750
858,076
454,928
79,029
2007
1,779,854
861,003
461,669
87,422
2008
1,826,650
875,548
475,254
91,214
2009
1,872,456
899,545
479,451
90,248
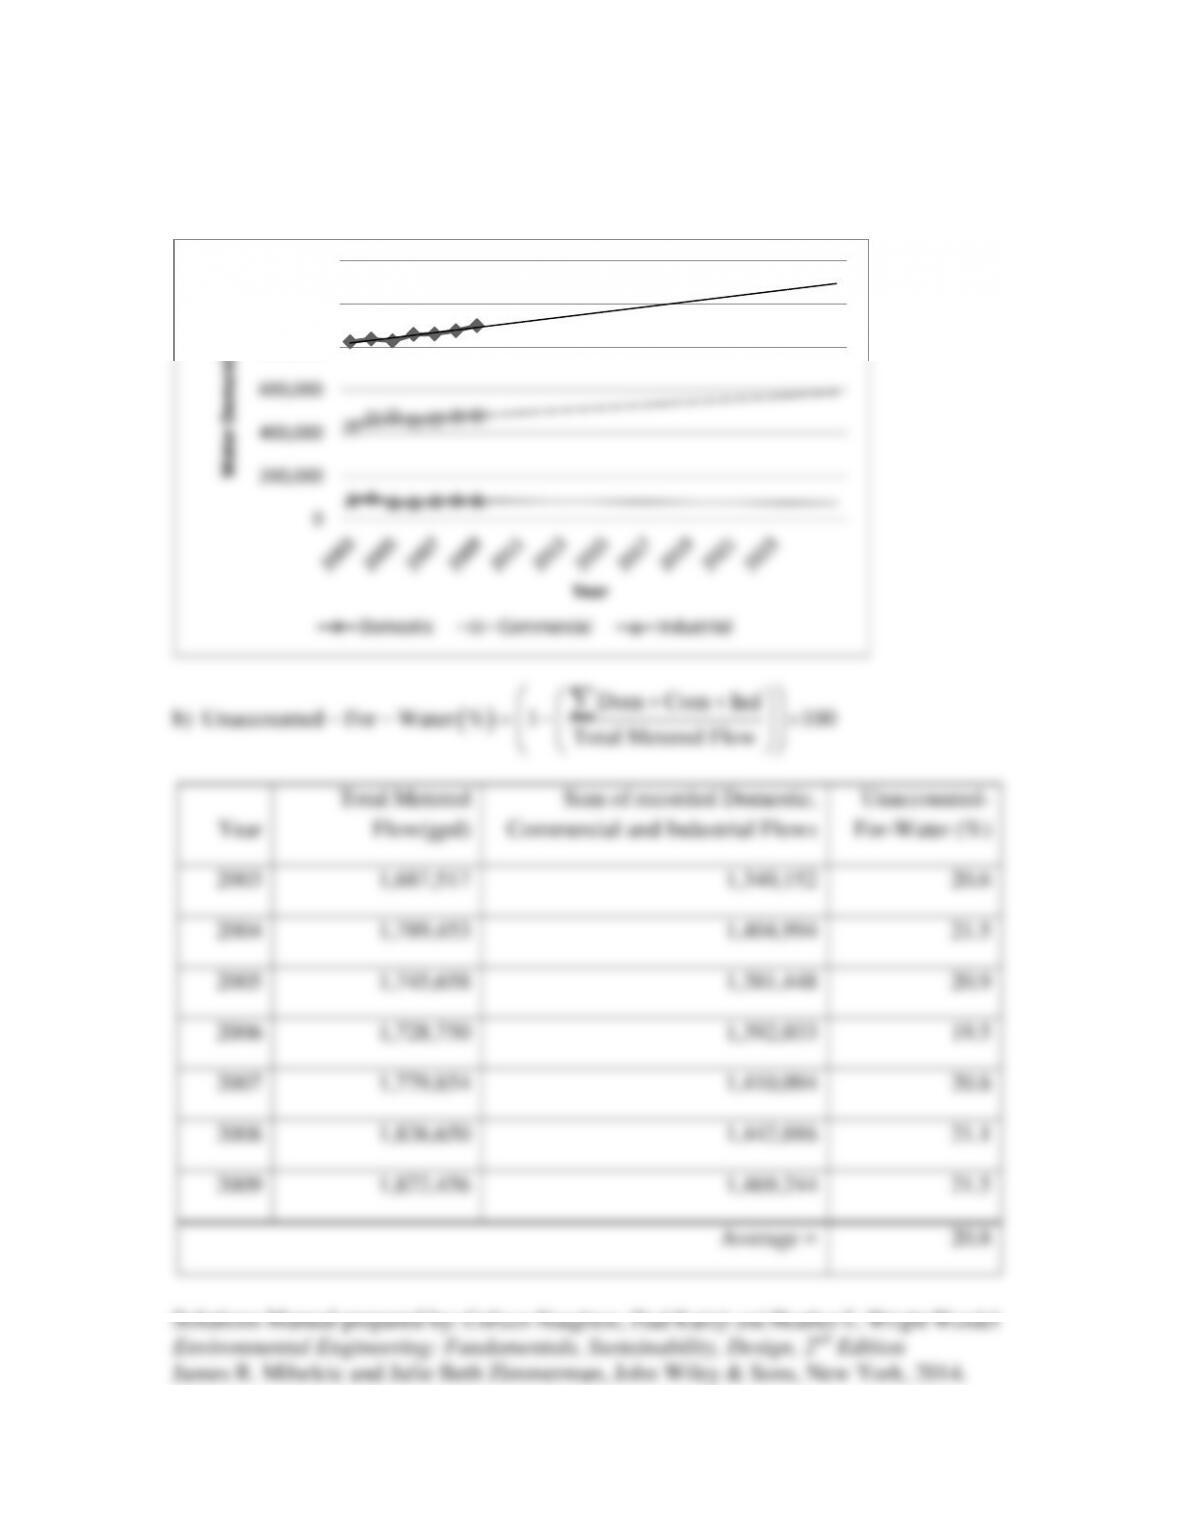
(a) Create a graph that has the historical domestic, commercial, and industrial demand for
each year. Extrapolate trend lines for the projected future water demand through 2024 for
each category. Take into account the additional industry water demand in 2016. (b)
Estimate the percent of produced water that is unaccounted-for water based on the
historical records. (c) Use the graph and estimated percent unaccounted–for water to
predict the total water demand for years 2014, 2019, and 2024.
Solution:
a)
b)
( )
Dom Com Ind
Unaccounted For Water % 1 100
Total Metered Flow
++
−− =− ×
∑
Year
Total Metered
Flow(gpd)
Sum of recorded Domestic,
Commercial and Industrial Flows
Unaccounted–
For–Water (%)
2003
1,687,517
1,340,152
20.6
2004
1,789,453
1,404,994
21.5
2005
1,745,658
1,381,448
20.9
2006
1,728,750
1,392,033
19.5
2007
1,779,854
1,410,094
20.8
2008
1,826,650
1,442,016
21.1
2009
1,872,456
1,469,244
21.5
Average =
20.8
400,000
600,000
800,000
1,000,000
1,200,000

c)
( )
Dom Com Ind
Total Water Demand 1 20.8 /100
++
=−
∑
Year
Domestic
(gpd)
Commercial
(gpd)
Industrial
(gpd)
Total (gpd)
2014
960,000
511,000
87,000
1,967,000
2019
1,020,000
542,000
148,000
2,159,000
2024
1,079,000
573,000
145,000
2,269,000
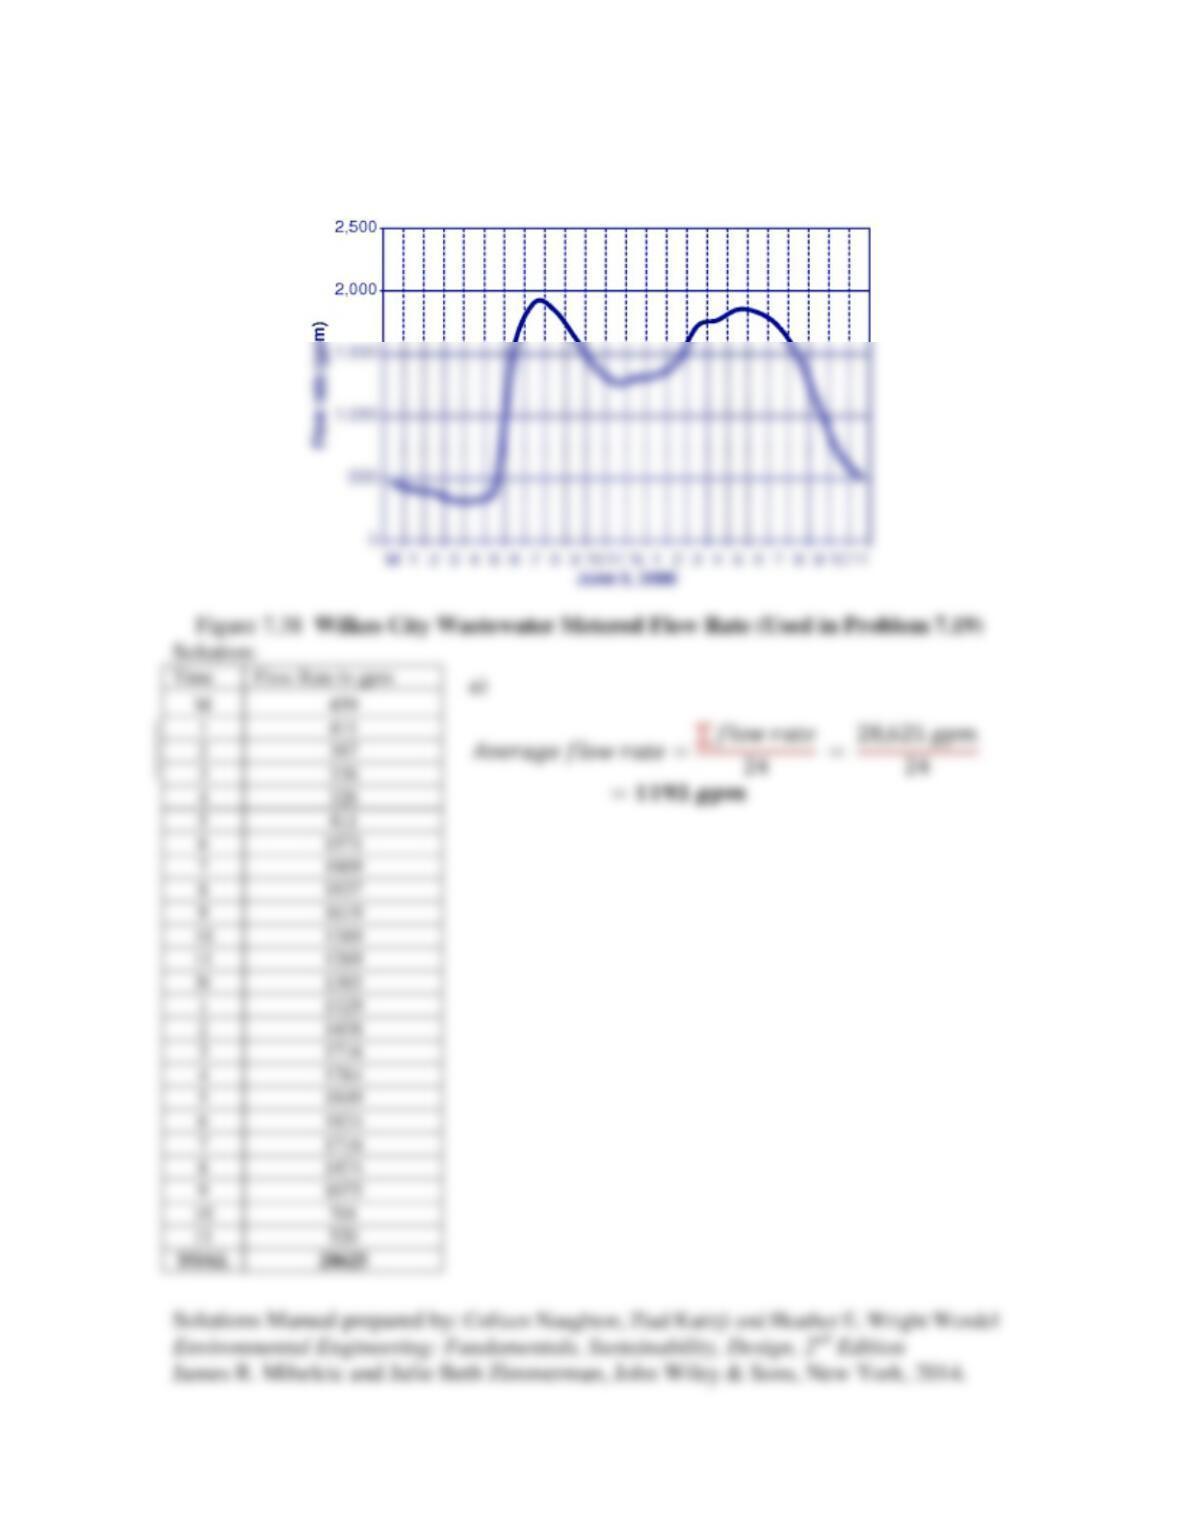
7.19 The recorded metered flow for June 3 at the Wilkes City wastewater treatment plant
is shown in Figure 7.38. (a) Estimate the average flow rate for June 3.
459
1
411
2
387
3
326
4
326
5
411
6
1571
7
1909
8
1837
9
1619
10
1389
11
1269
1305
1
1329
2
1438
3
1716
4
1764
5
1849
6
1824
7
1716
8
1474
9
1075
10
701
11
520
TOAL
28625
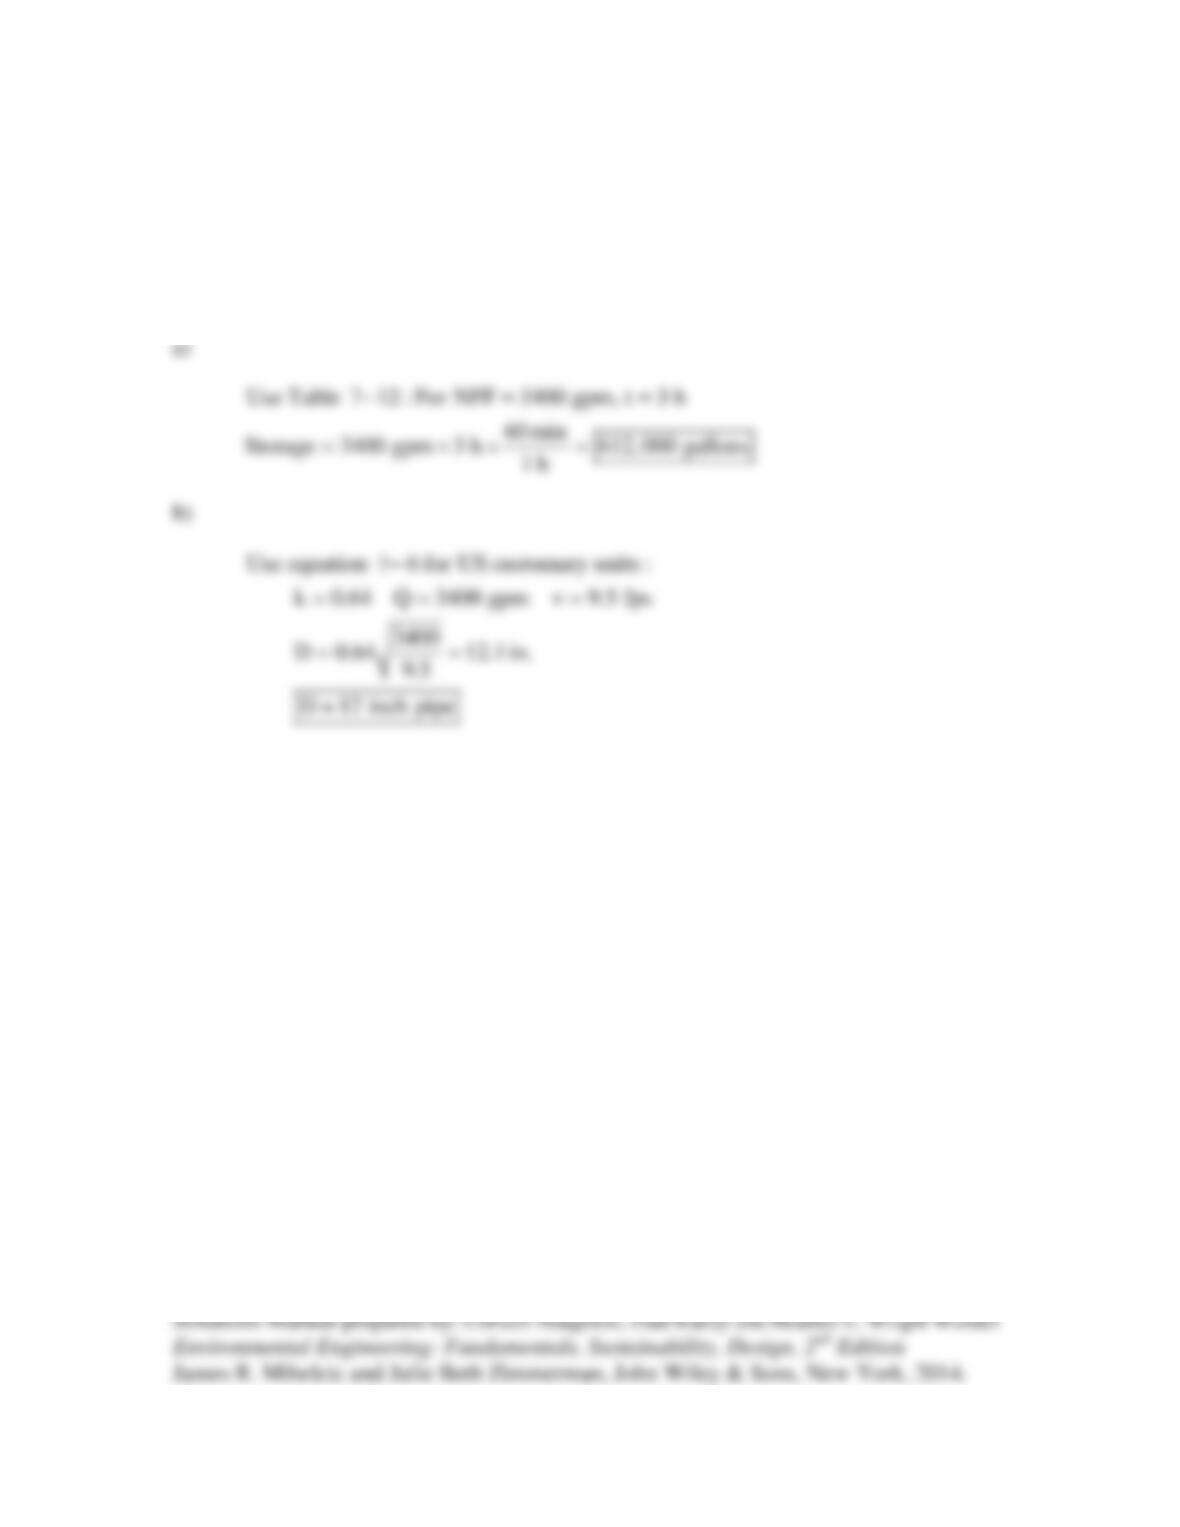
7.20 A storage tank is designed to supply water for fire protection at a small industry. The
NFF for this industry is 3,400 gpm. (a) Estimate the volume of water that would be
needed for fire protection. (b) Estimate the nominal pipe size of a single pipe supplying
the fire protection water from the tank if the design velocity for the pipe is 9.5 ft./sec.
Solution:
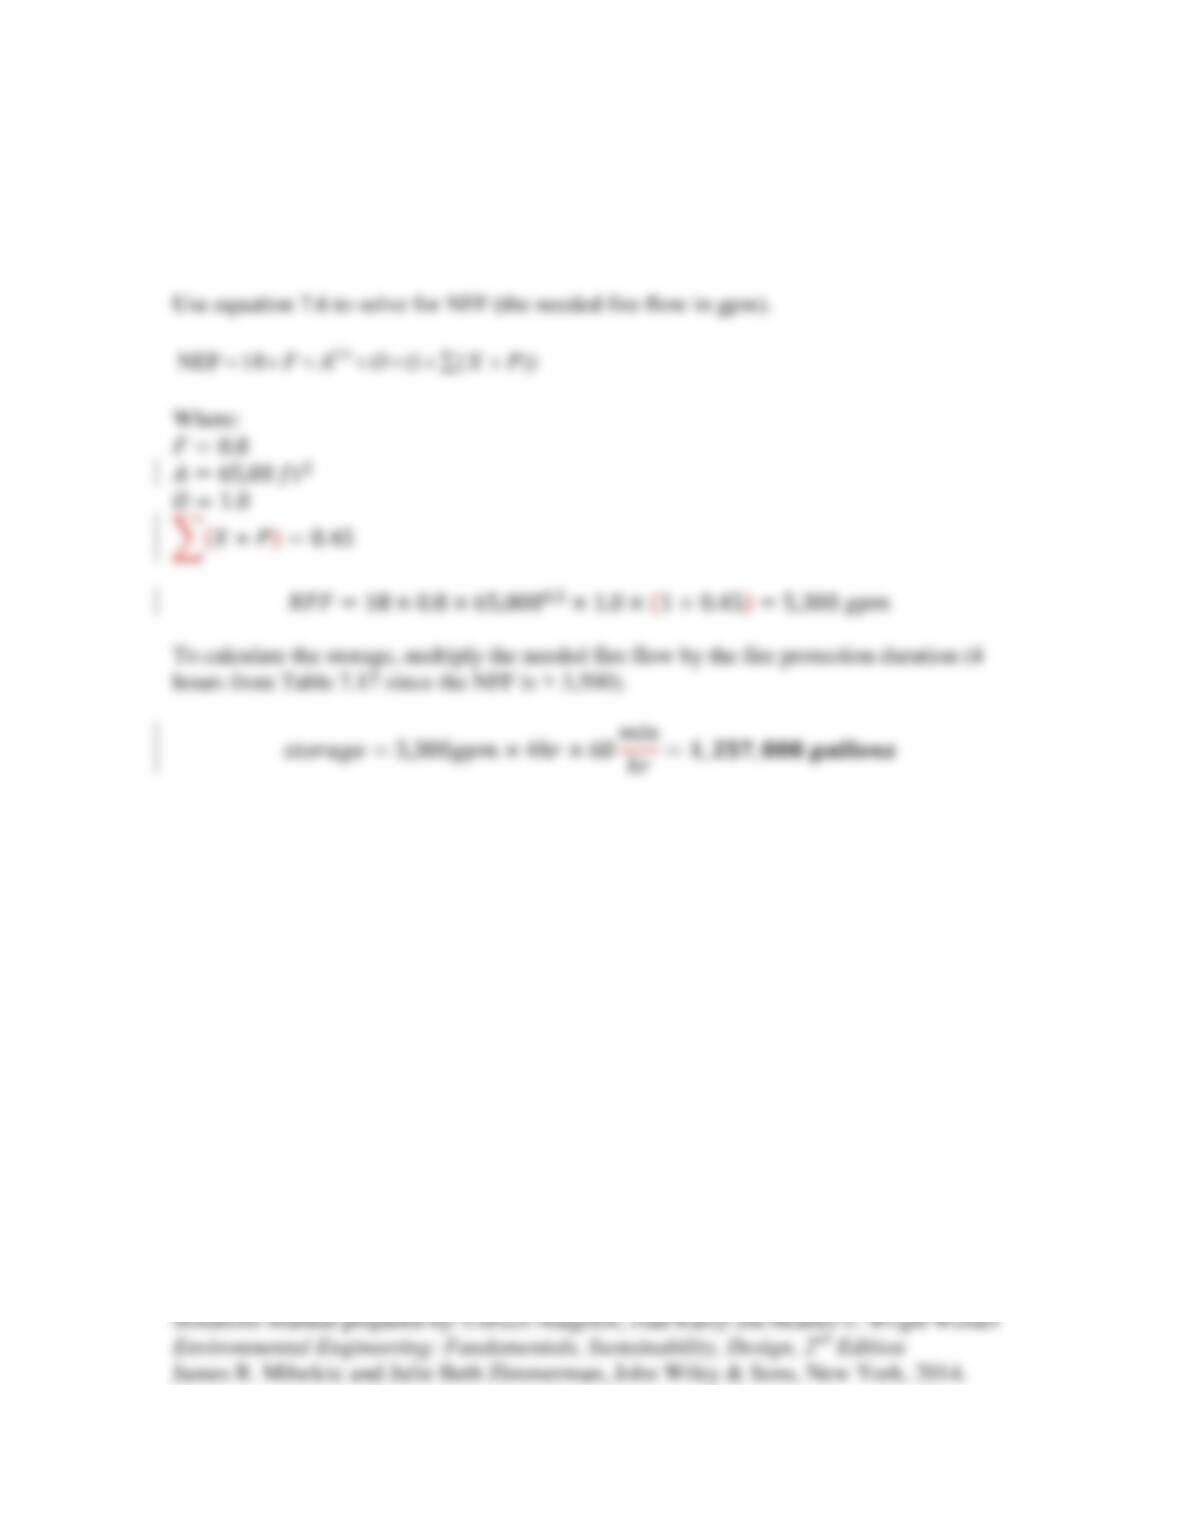
7.21 Estimate the size of a storage tank to supply water for fire protection to a 65,000 ft2
department store (O = 1.0). The building is constructed from fire resistant materials (F =
0.8), with a total exposure and communication factors equal to 0.45.
Solution:
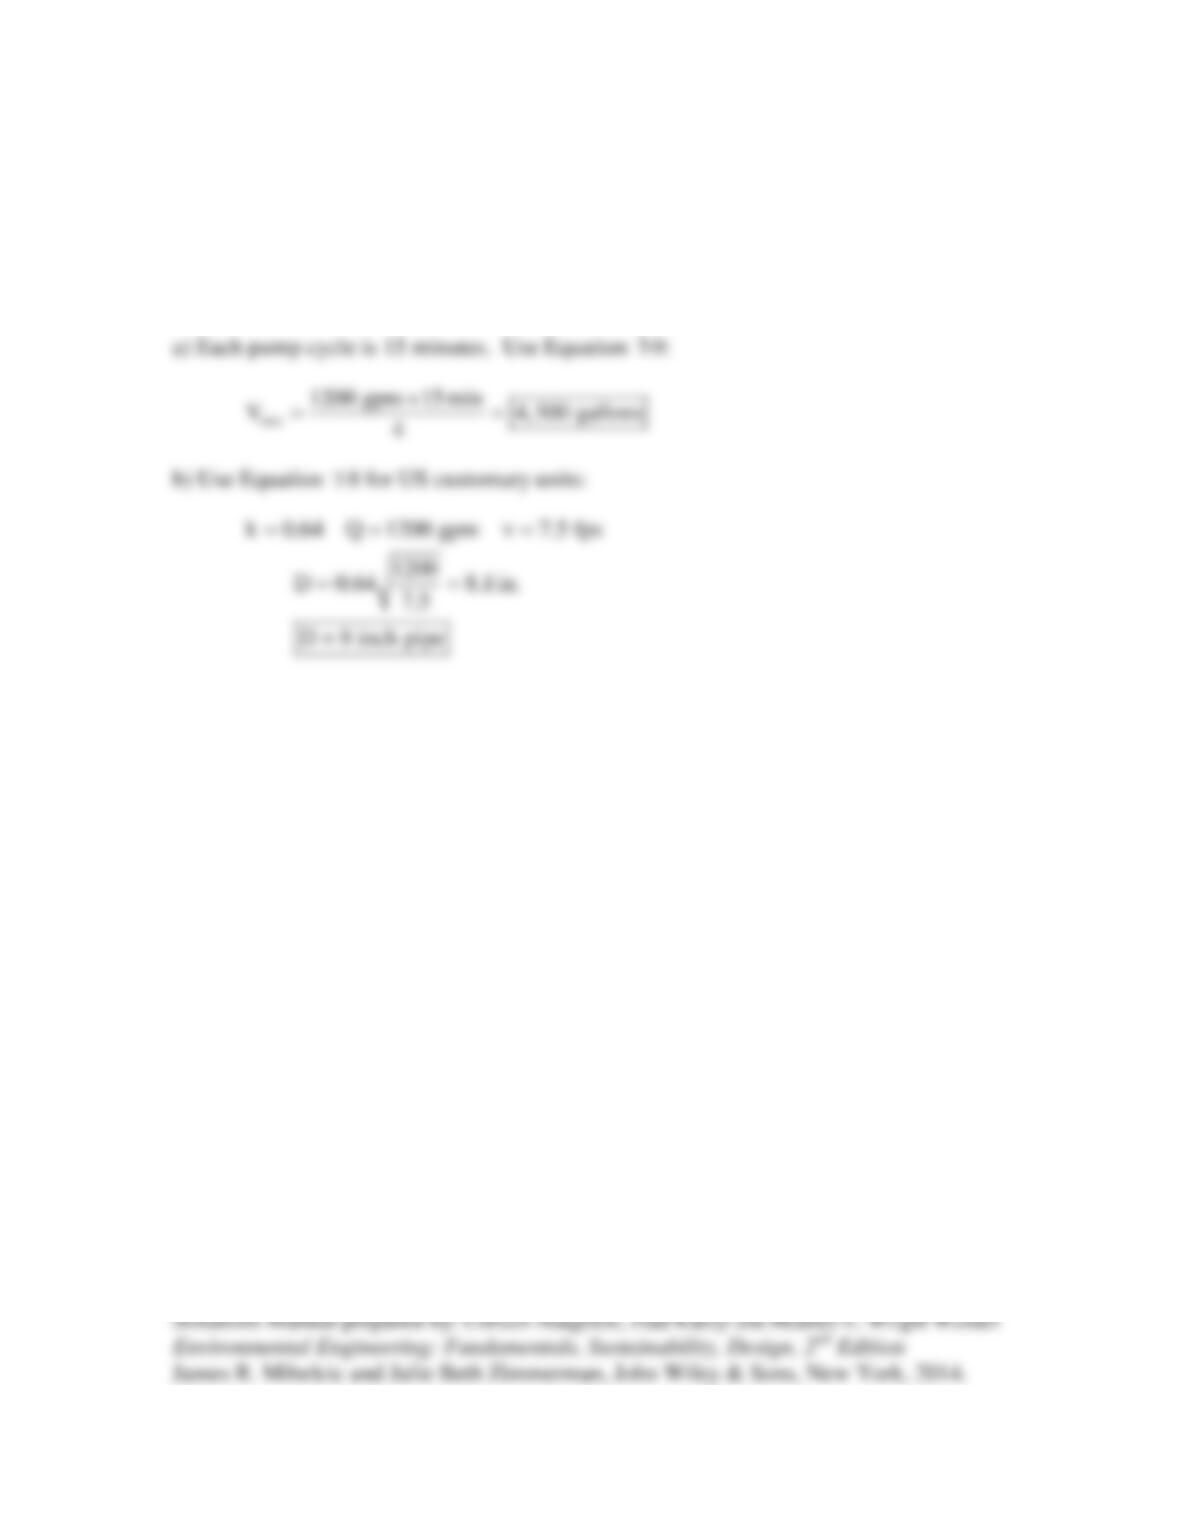
7.22 A pumping station with wet well is to be sized in a wastewater collection system for
a design pumping rate of 1,200 gpm. (a) Estimate the minimum active wet–well volume
with a pump cycle of 4 times per hour. (b) Size the force main (pumping station
discharge pipe) with a design velocity of 7.5 ft./sec.
Solution:

7.23 Identify one regional and one global water scarcity issue. Develop a long-term
sustainable solution that protects future generations of humans and the environment.
Solution:
Students’ responses will vary.
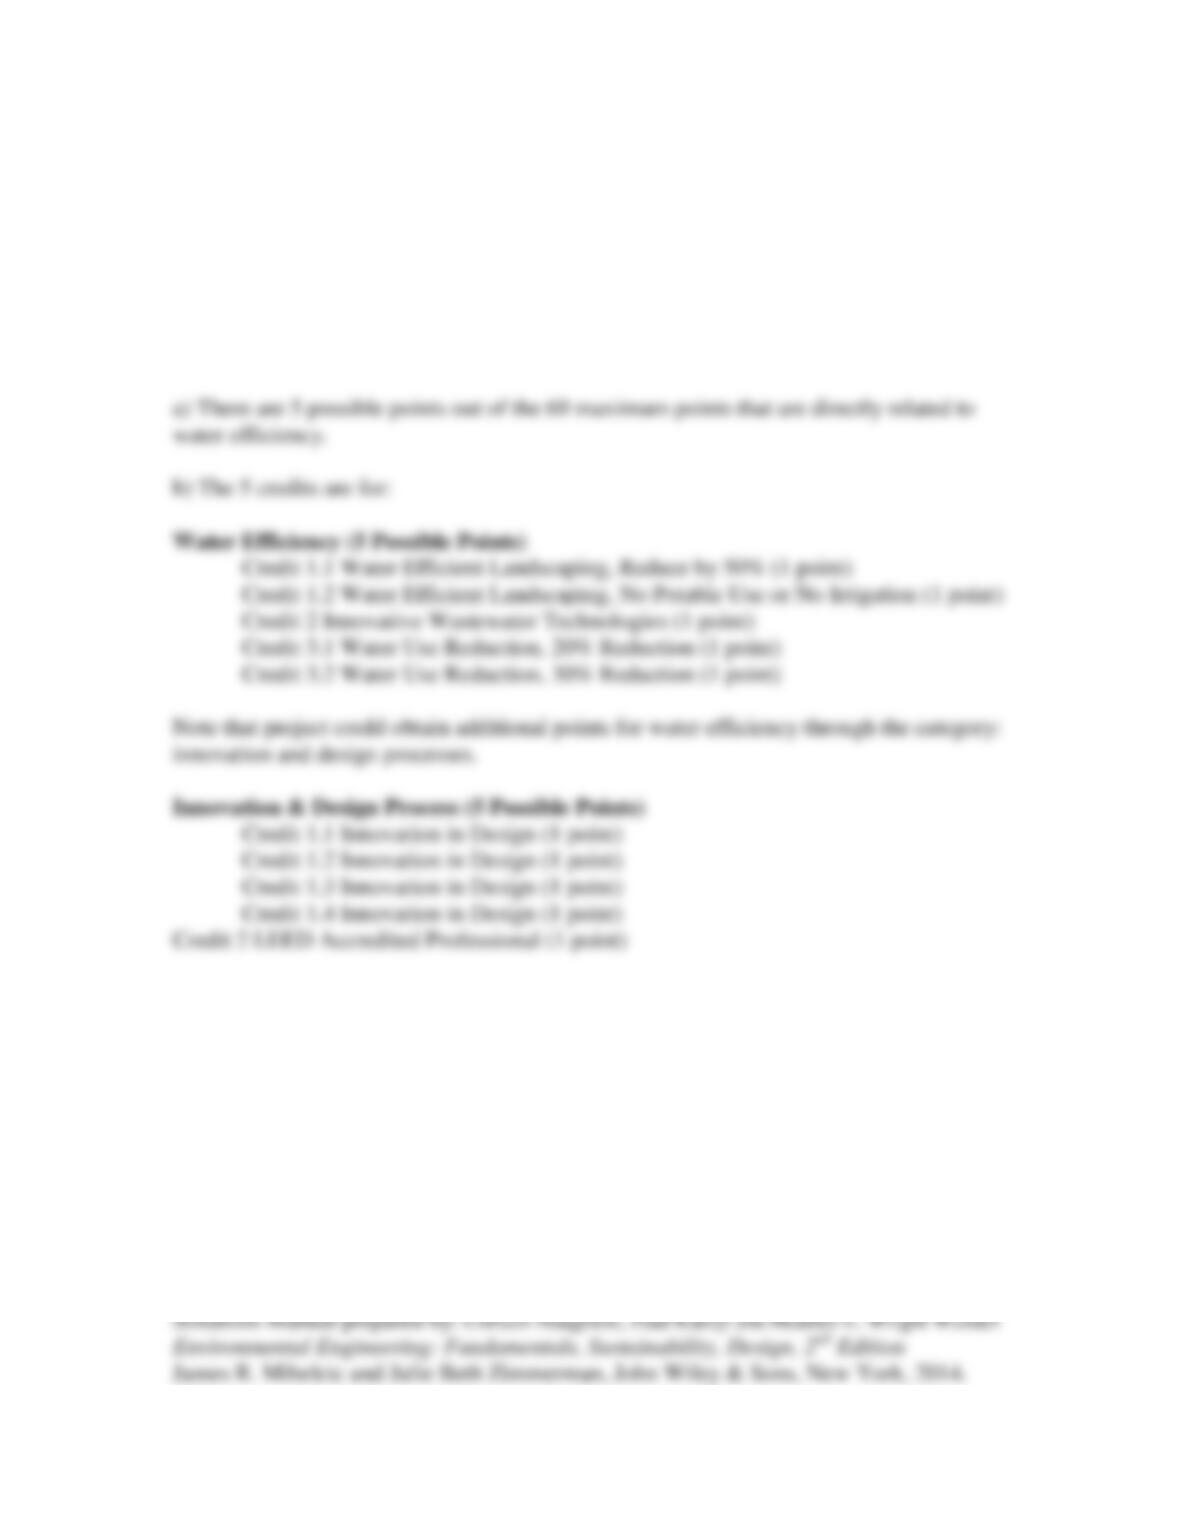
7.24 Go to the U.S. Green Building Council Website (http://www.usgbc.org) and
research the LEED credits associated with new commercial construction and major
renovation (Version 2.2, from U.S. Green Building Council). A project can obtain a
maximum of 69 points. (a) How many possible points directly relate to the category
water efficiency? (b) What are the specific credits provided for the category water
efficiency?
Solution:
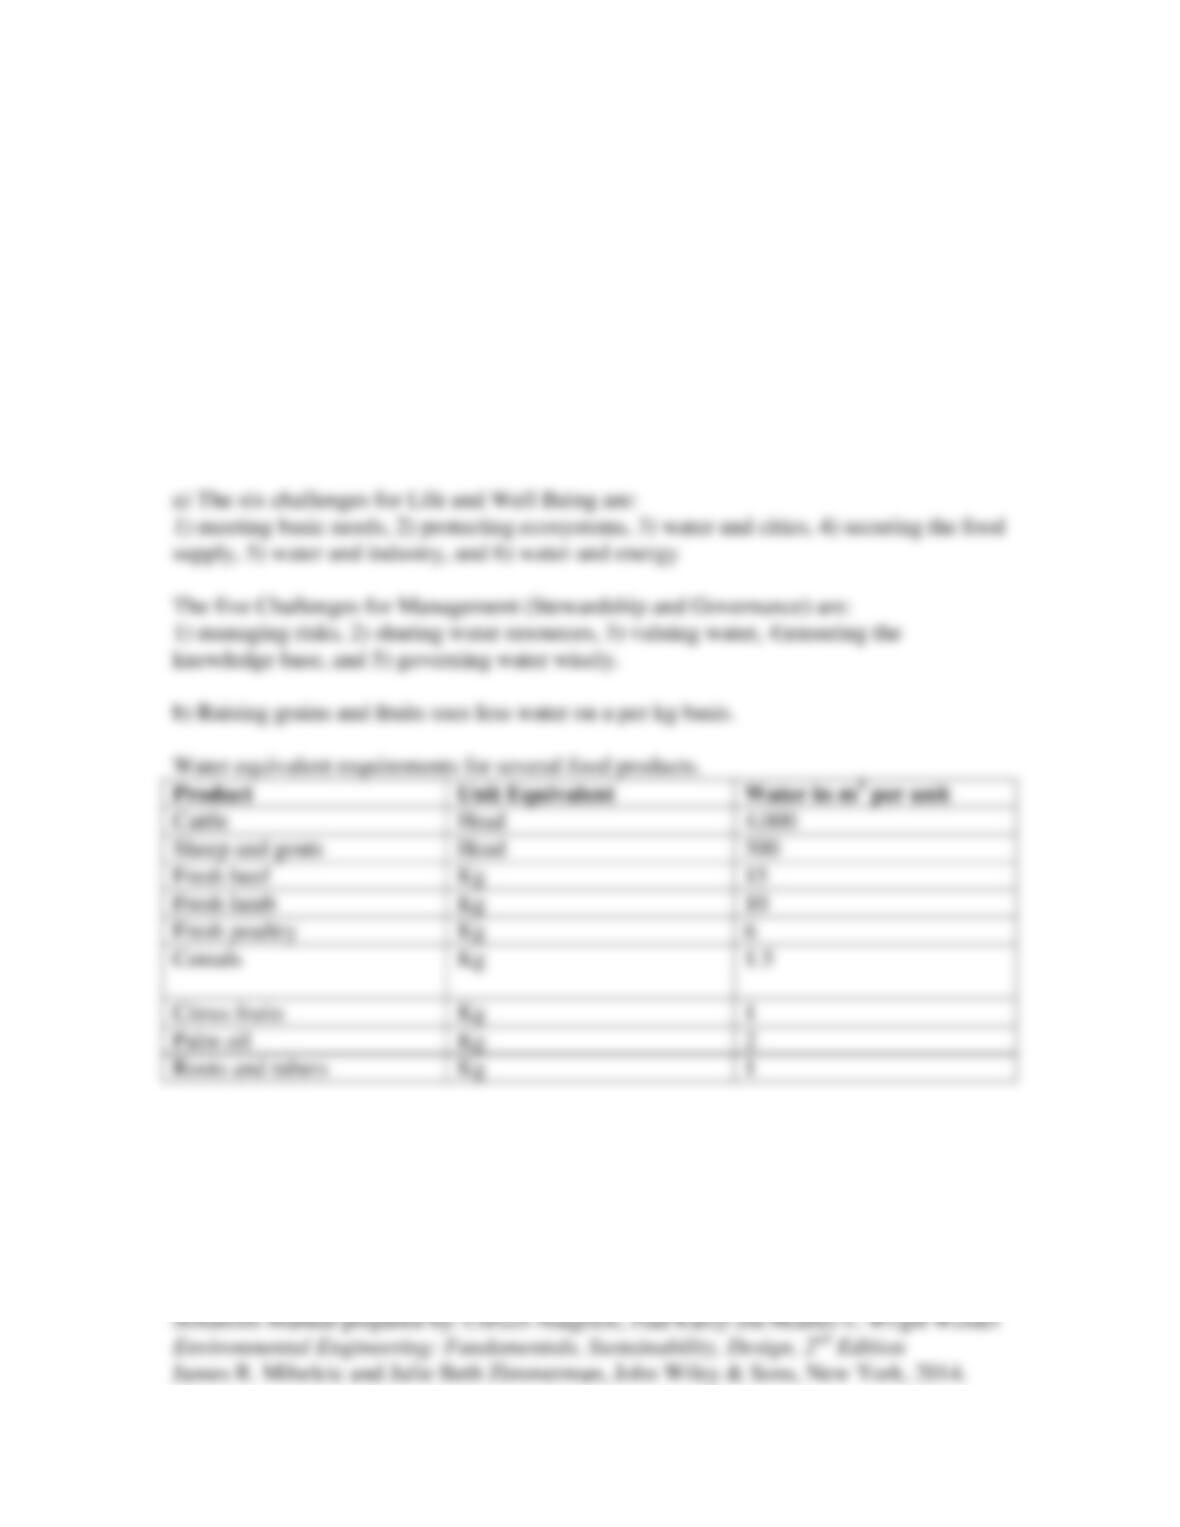
7.25 Go the following web site (http://www.unesco.org/new/en/natural-
sciences/environment/water/wwap/) and look up the report, The 1st UN World Water
Development Report: Water for People, Water for Life. (a) Of the 11 challenge areas, list
the ones related to “life and well being” and the ones related to “management”. (b)
Access the link on “facts and figures on securing the food supply”. Develop a table with
columns of product, unit equivalent, and water in m3 per unit for the following products:
cattle, sheep and goats, fresh beef, fresh lamb, fresh poultry, cereals, citrus fruits, palm
oil, and roots and tubers. Use this table to answer the question, on a per kg basis, does
providing meat or grains/fruits use more water?
Solution:

7.26 Go to the following web site to learn how you can save water at home
(http://www.epa.gov/WaterSense/pubs/simple_steps.html). For the following three areas
(in the bathroom, in kitchen/laundry, outdoors) list a minimum of 3 items you can do at
home to conserve water.
Solution:
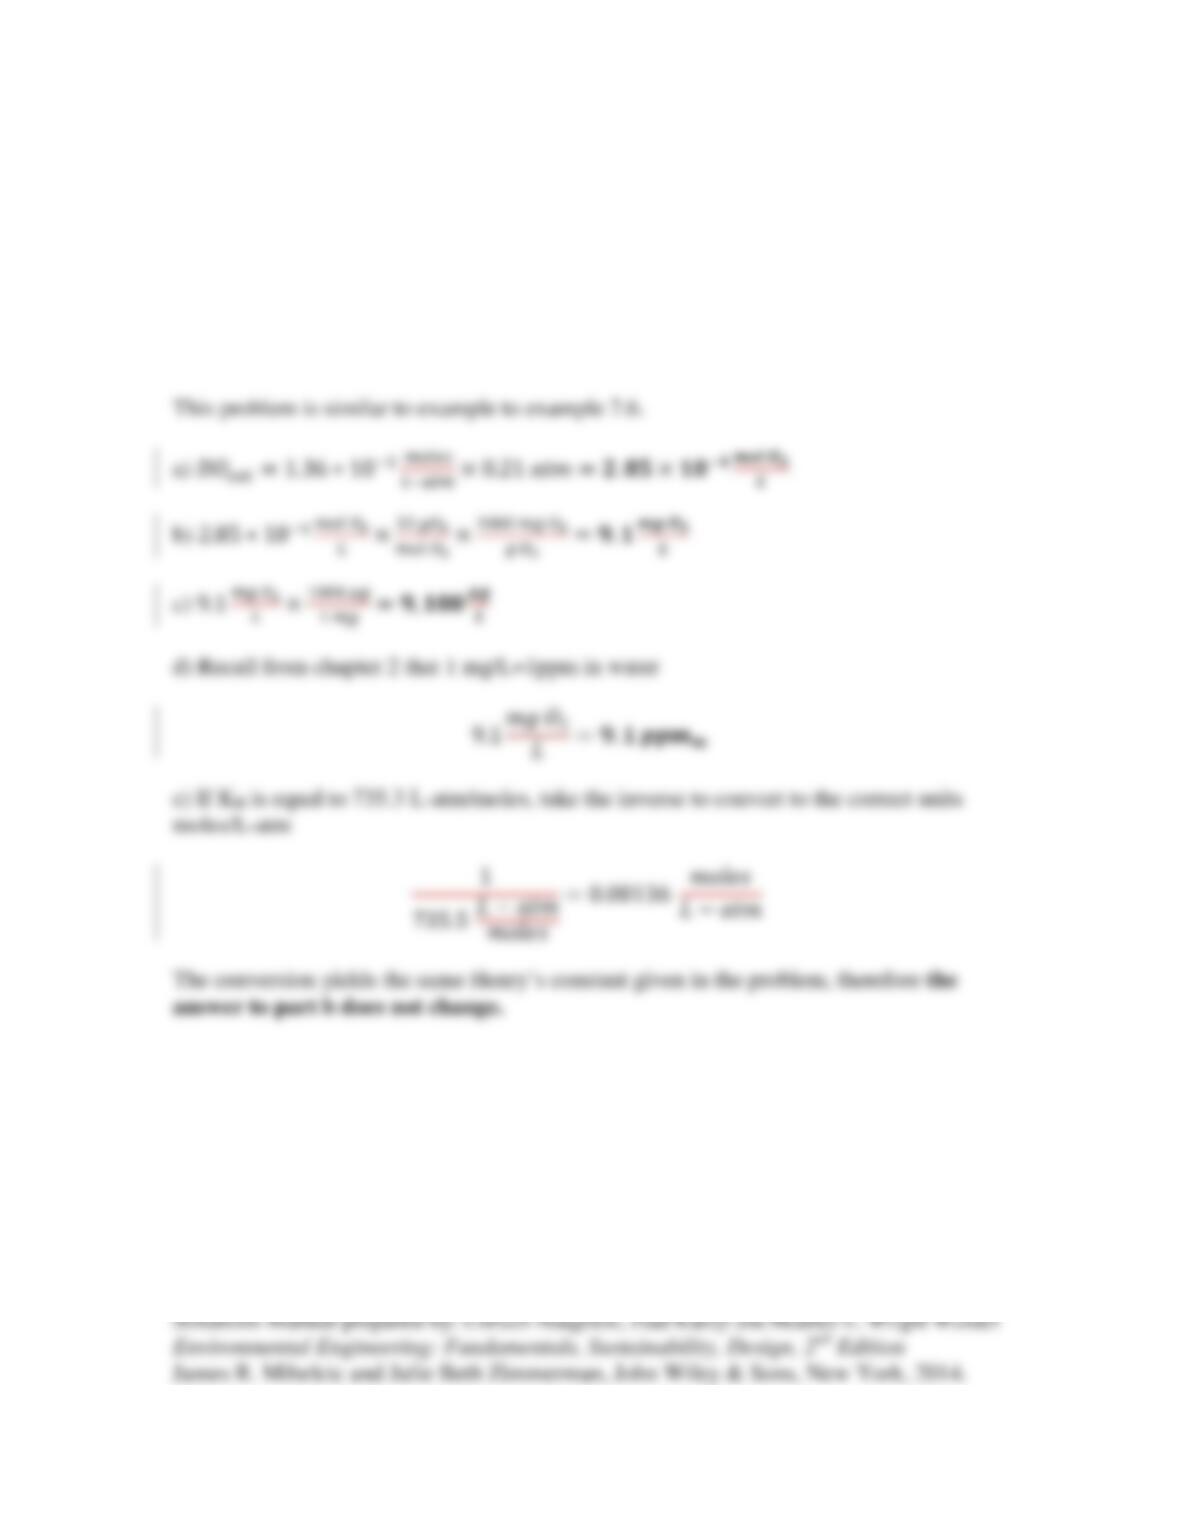
7.27 If the Henry’s constant (KH) for dissolved oxygen is 0.00136 moles/L-atm at 20oC
and the concentration of carbon dioxide in the atmosphere is 390 ppmv, what is the
concentration of oxygen dissolved in water equilibrated with the atmosphere in: (a)
moles/L, (b) mg/L, (c) µg/L, and (d) ppmm? (e) How does your answer to part (b)
change if the Henry’s constant is reported in different units (KH equal to 735.3 L-
atm/moles).
Solution:
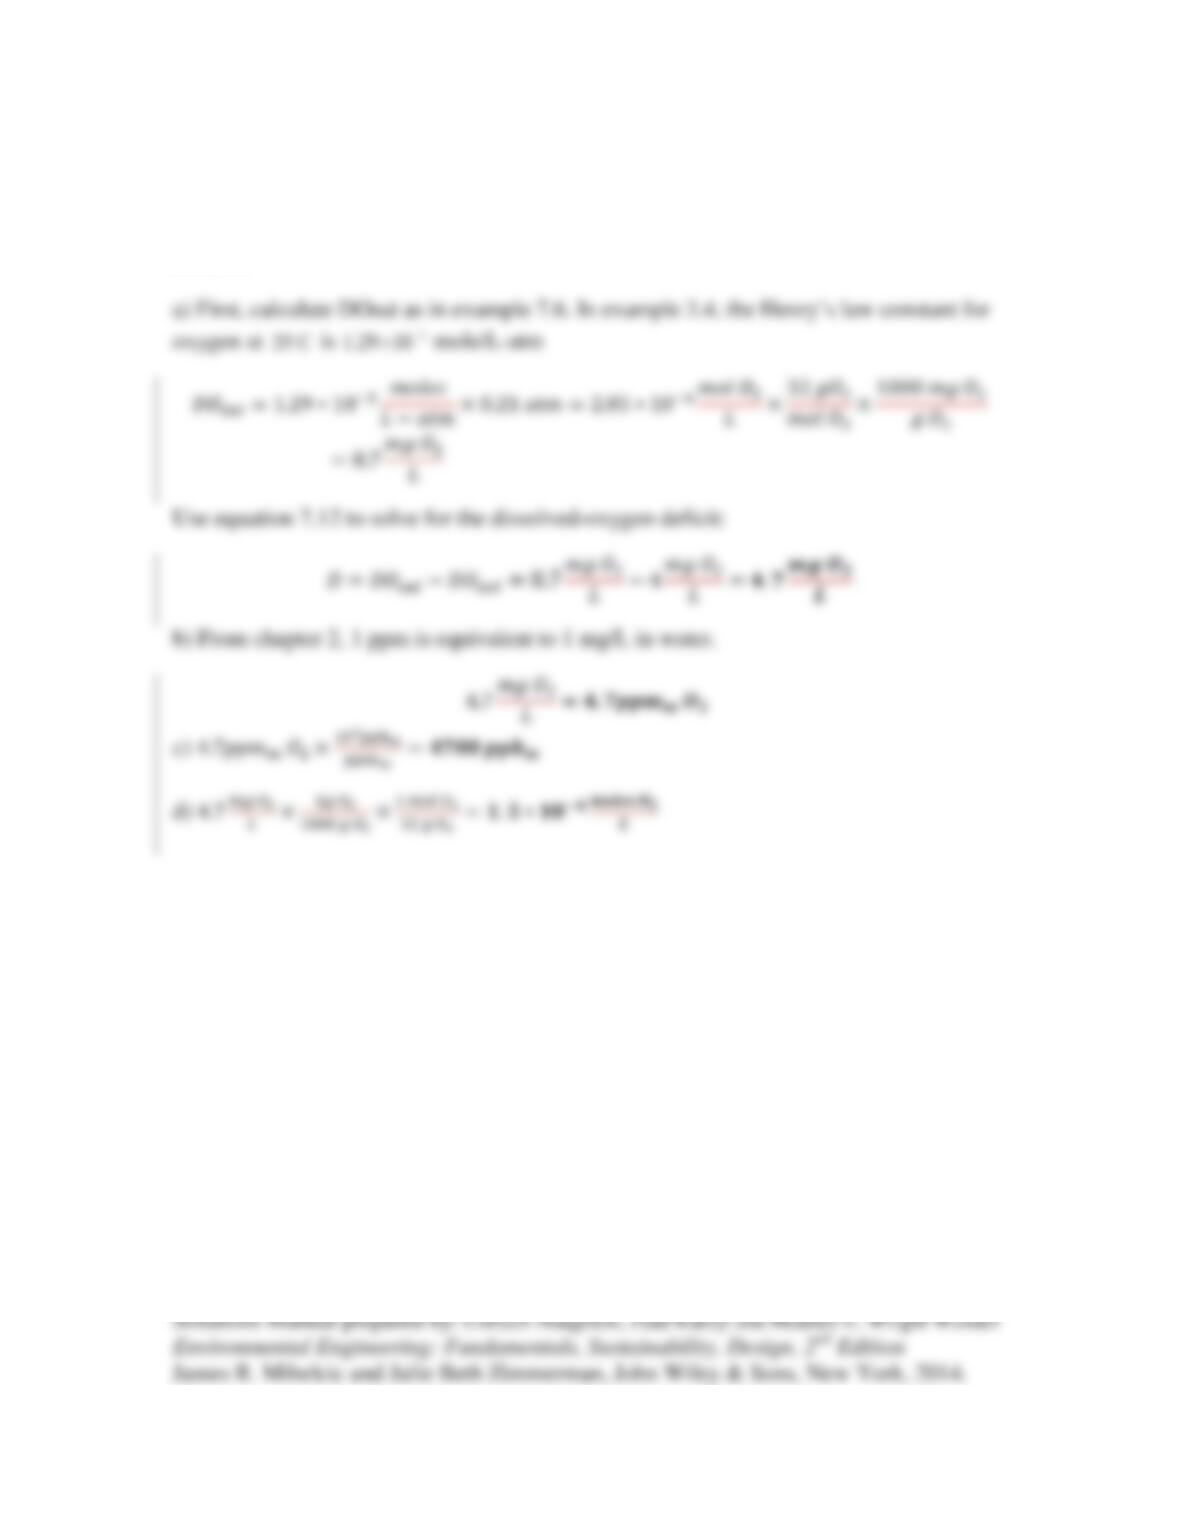
7.28 A stream at 25°C has a dissolved-oxygen concentration of 4 mg/L. What is the
dissolved-oxygen deficit in (a) mg/L, (b) ppm, (c) ppb, and (d) moles/L?
Solution:

7.29 The oxygen concentration of a stream is 4 mg/L, and DO saturation is 10 mg/L.
What is the oxygen deficit?
Solution:
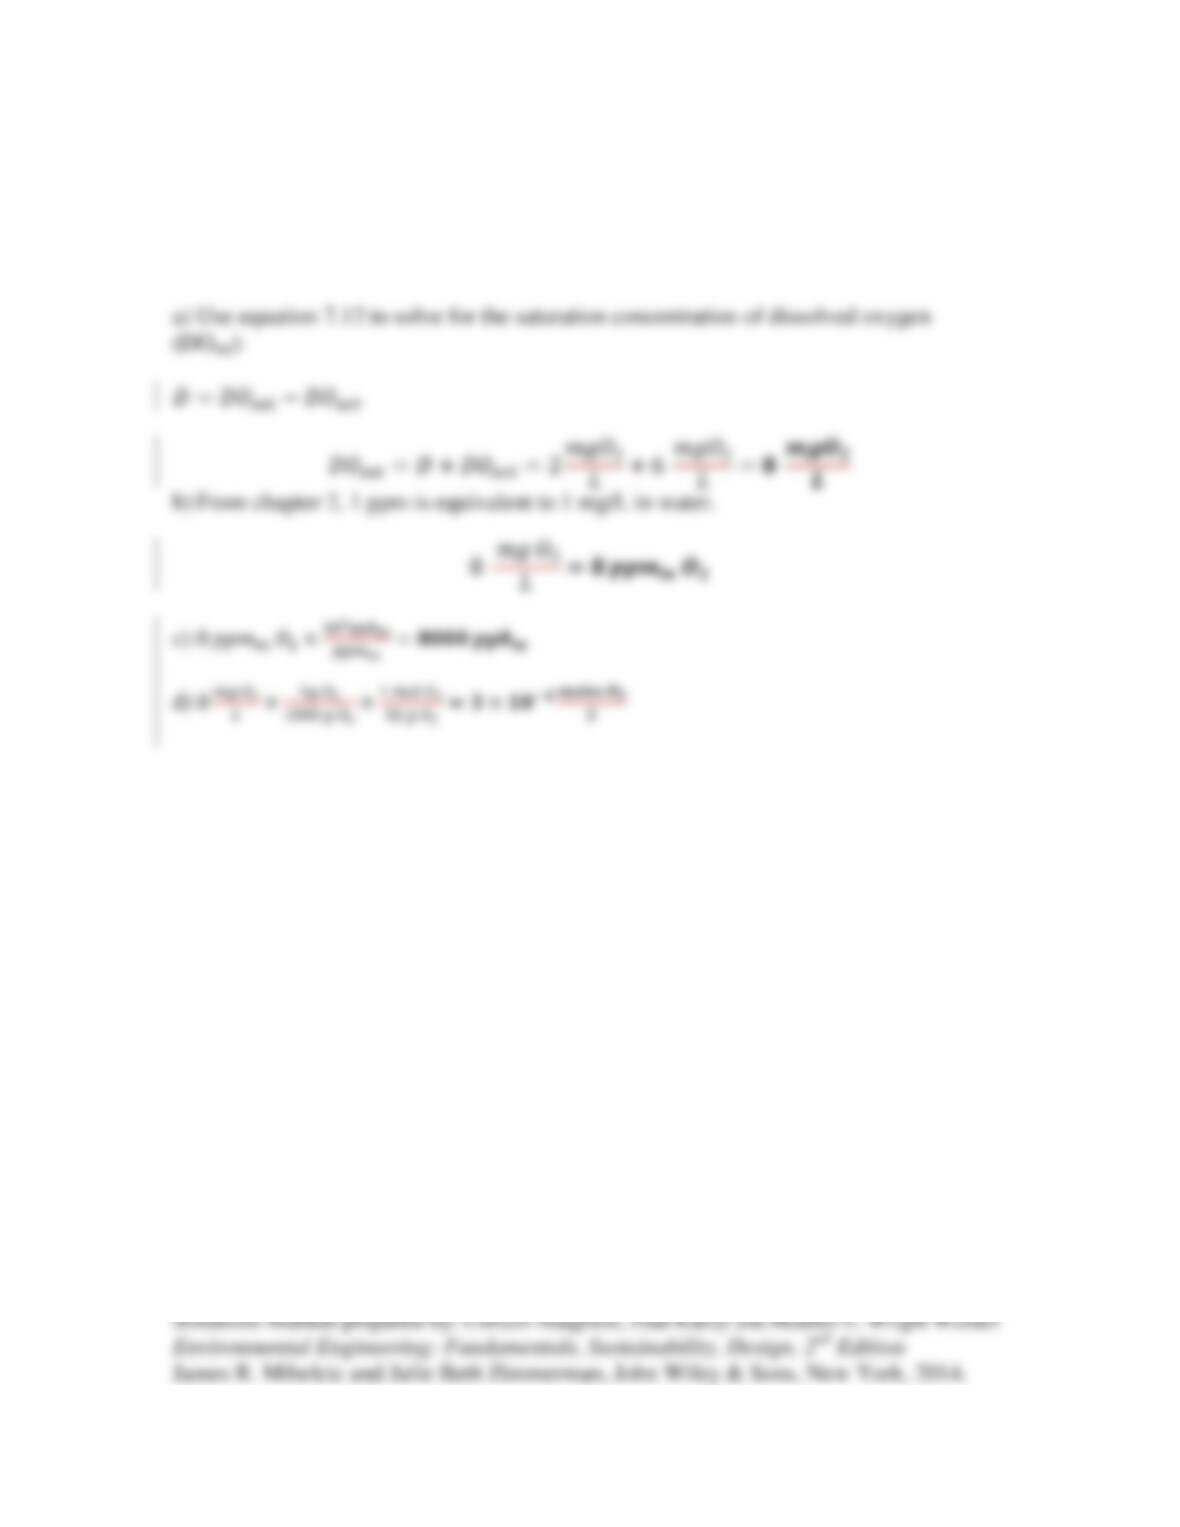
7.30 The measured dissolved oxygen concentration using a DO meter of a river is 6
mg/L. The oxygen deficit is 2 mg/L at the same location. What is the saturation
concentration of dissolved oxygen in (a) mg/L, (b) ppm, (c) ppb, and (d) moles/L?
Solution:
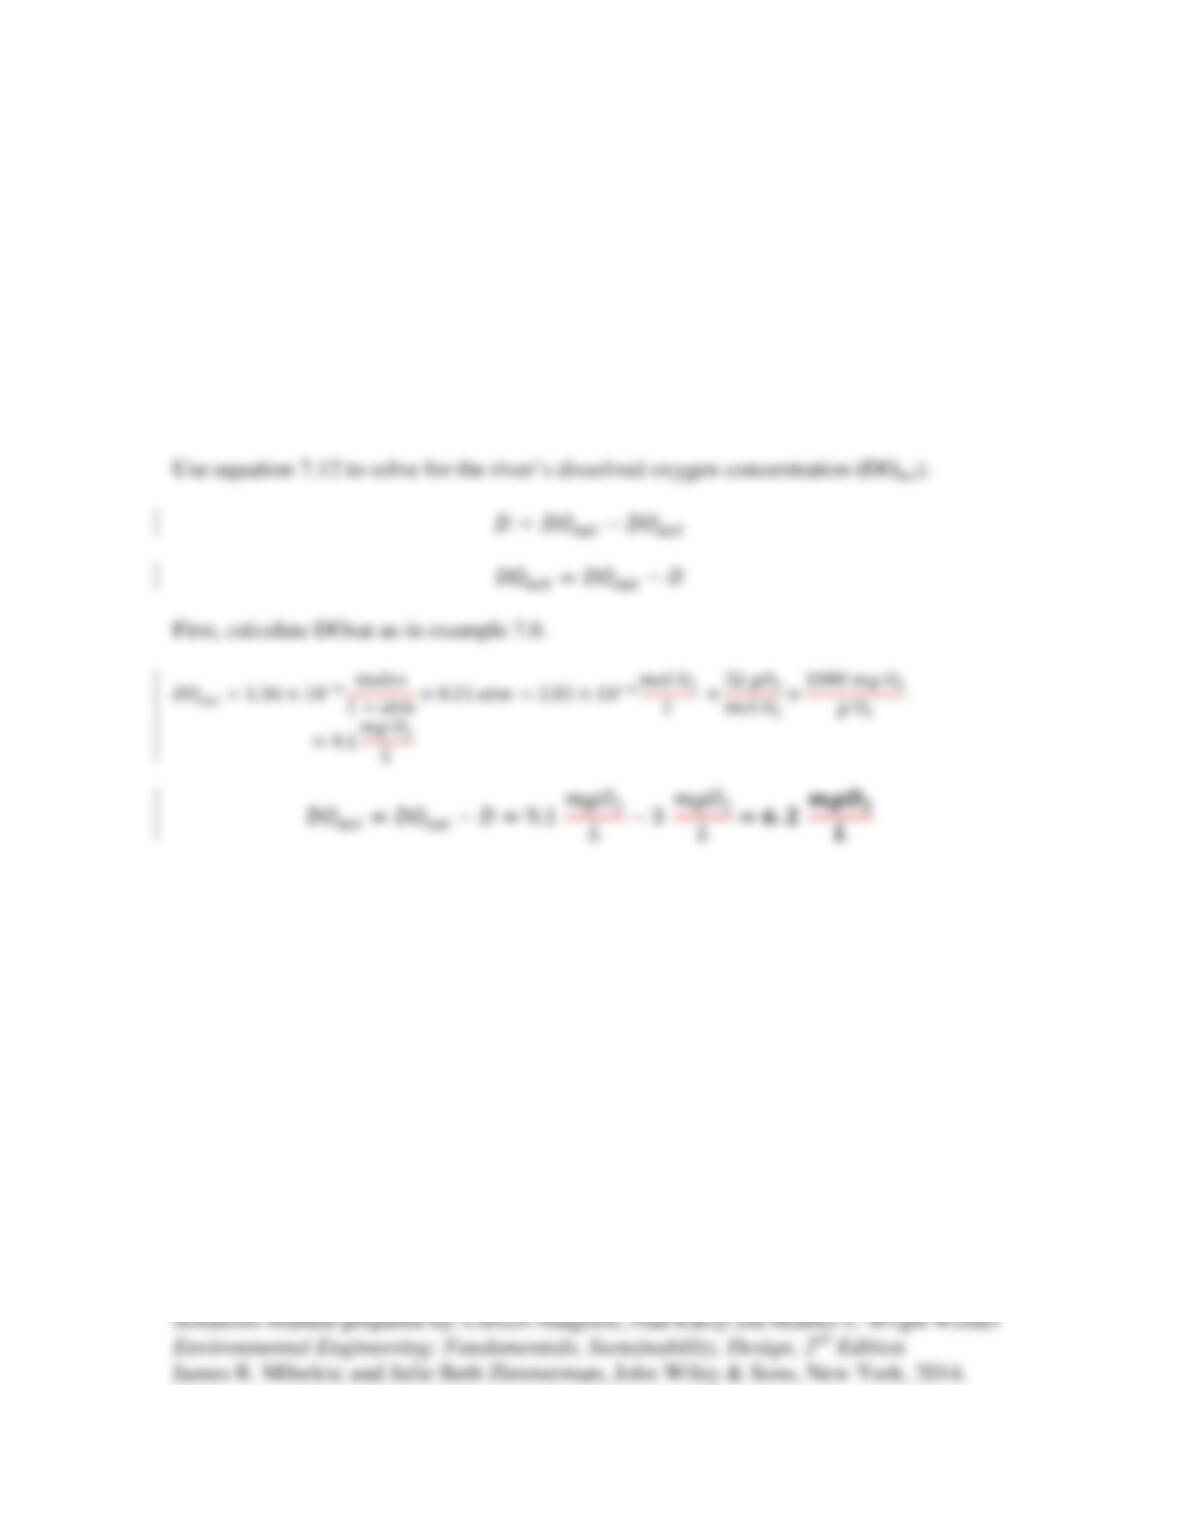
7.31 Dr. Mihelcic is canoeing on the Hillsborough River in Florida, just upstream of
Trout Creek Wilderness Area. He is collecting dissolved oxygen readings with his DO
meter. He spots several roseate spoonbills, woodstorks, and green herons feeding near
the water’s edge, gets excited, and drops his oxygen meter into the water. Assuming he
is afraid to gather the meter from the bottom of the river because of the presence of
alligators, what is the river’s dissolved oxygen at this point if he learns later that the
water temperature is 20oC and the oxygen deficit at this point is 3 mg/L at the time he
was paddling.
Solution:
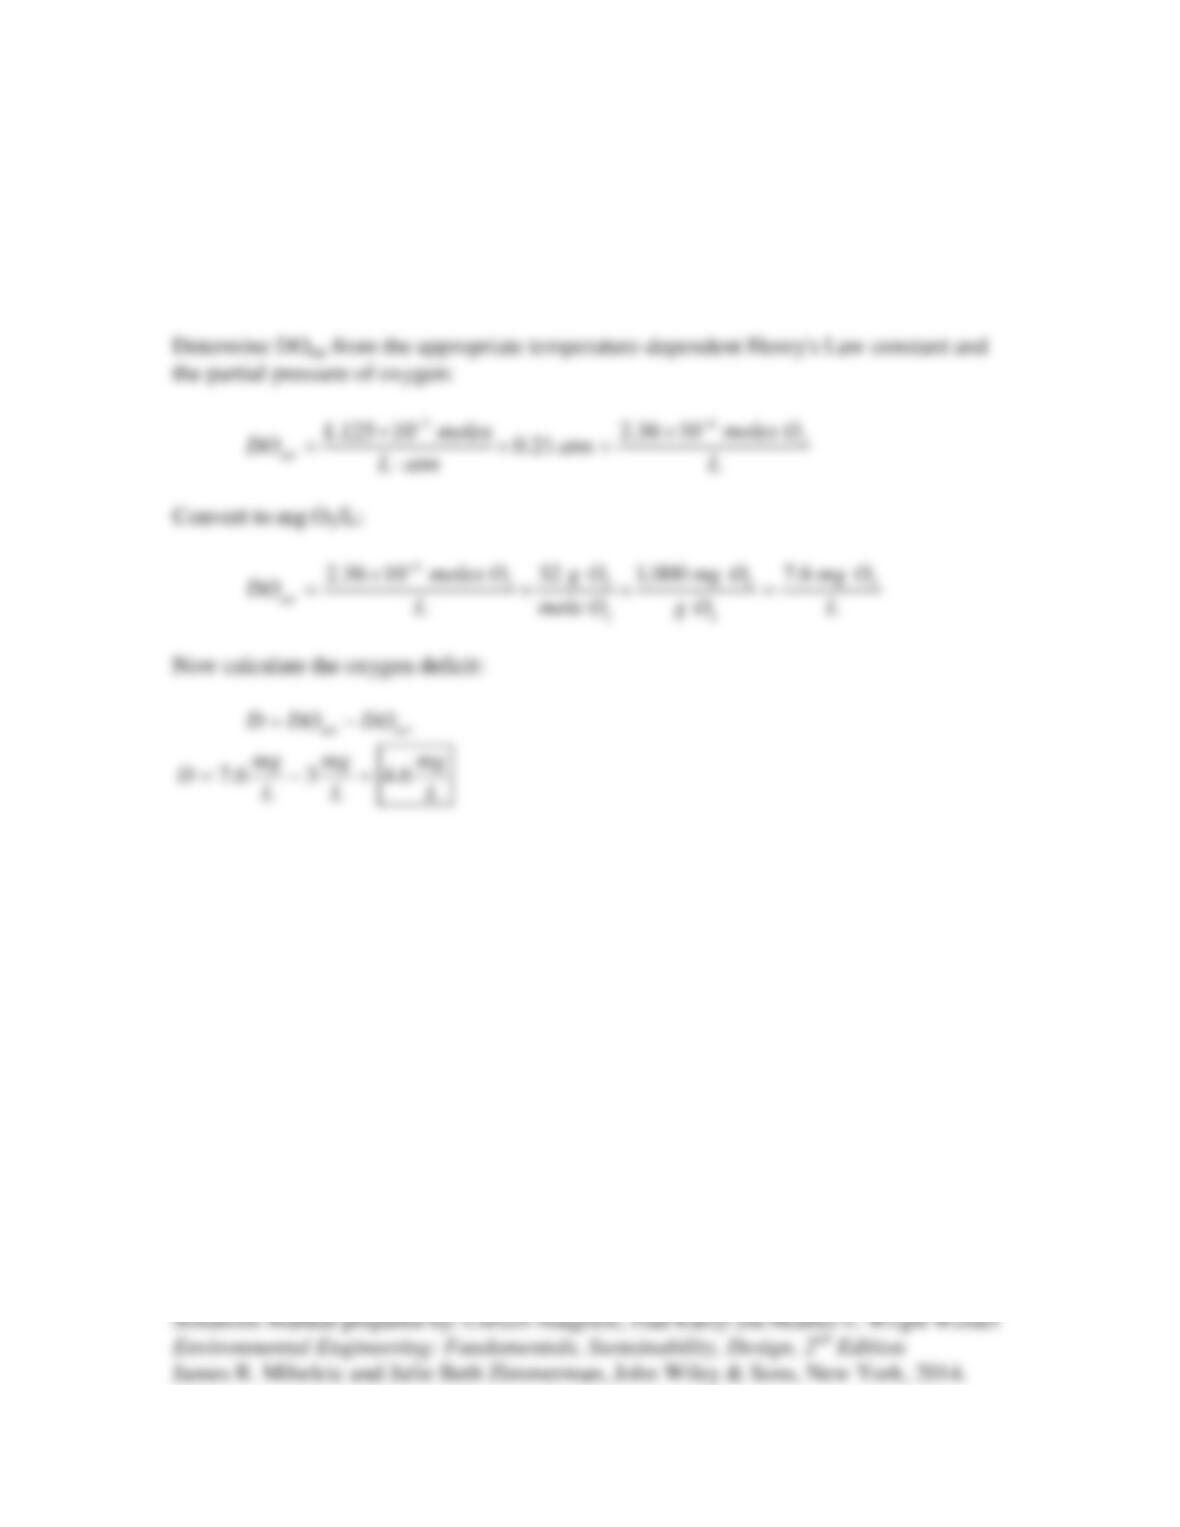
7.32 Calculate the dissolved-oxygen deficit for a river at 30°C and a measured dissolved-
oxygen concentration of 3 mg/L. The Henry’s law constant at that temperature is
3
1.125 10−
×
mole/L-atm, and the partial pressure of oxygen is 0.21 atm.
Solution:
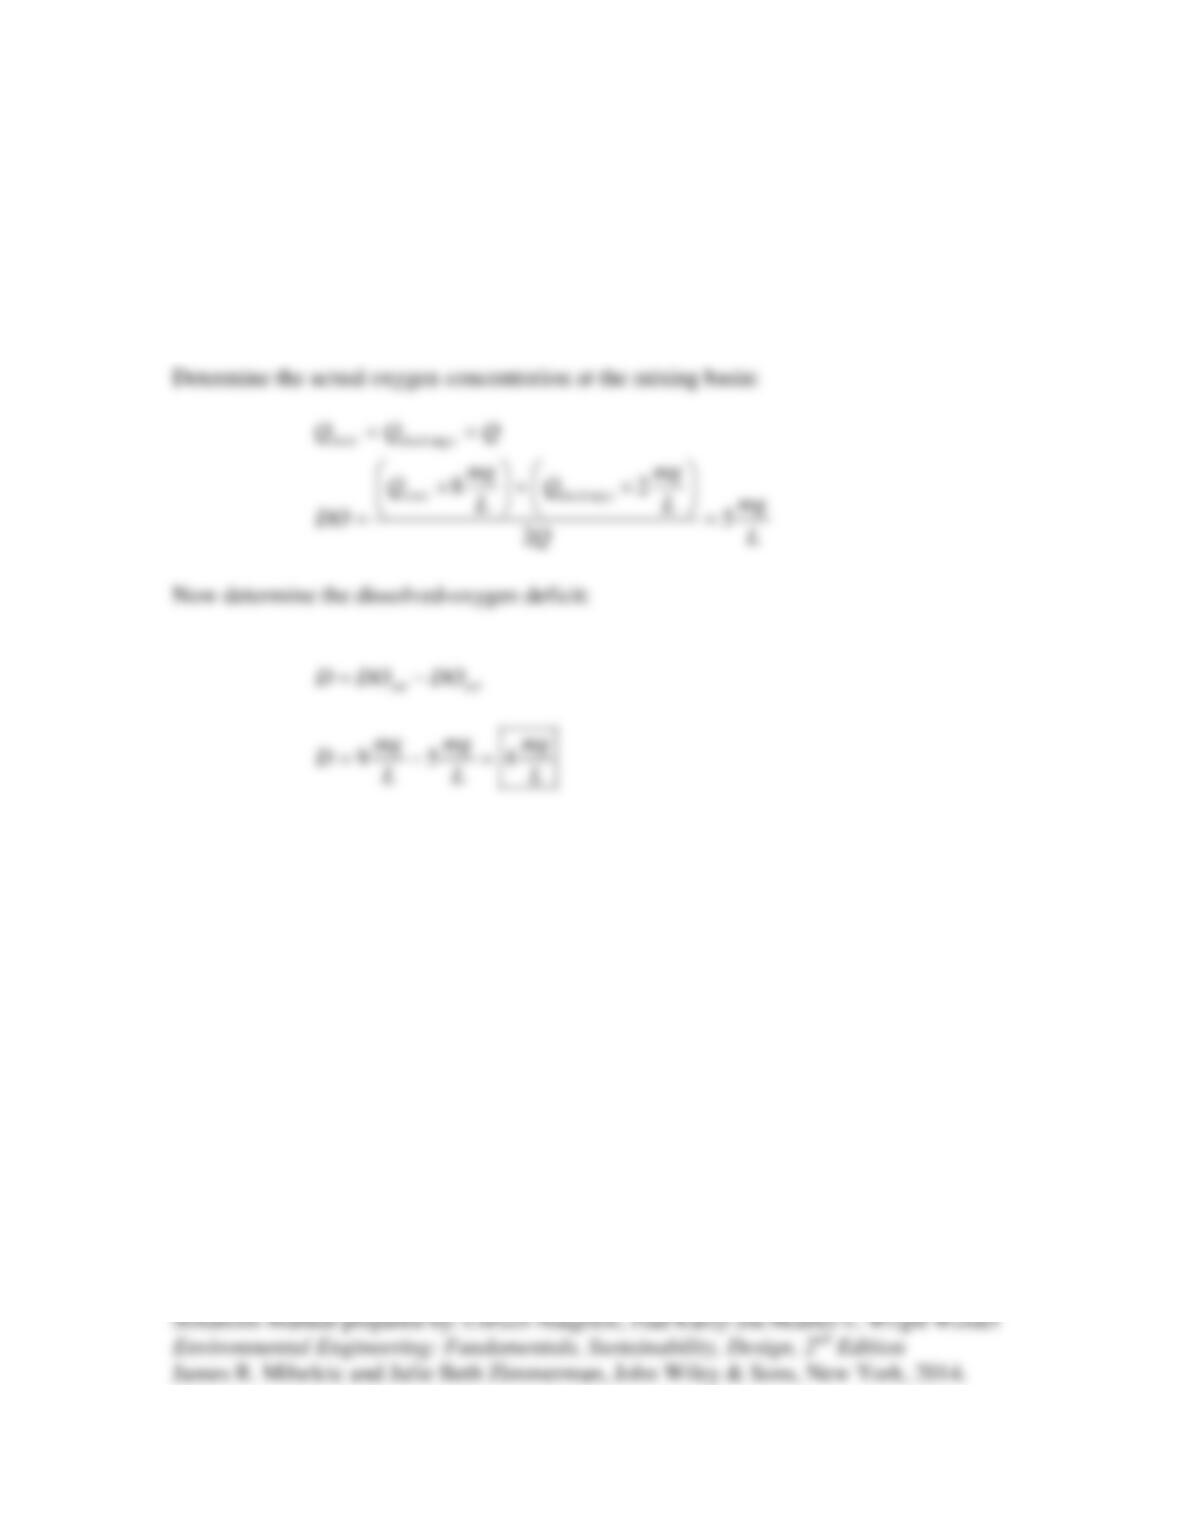
7.33 A wastewater treatment plant discharges an effluent containing 2 mg/L of dissolved
oxygen to a river that has a dissolved-oxygen concentration of 8 mg/L upstream of the
discharge. Calculate the dissolved-oxygen deficit at the mixing basin if the saturation
dissolved oxygen for the river is 9 mg/L. Assume that the river and plant discharge have
the same flow rate.
Solution: