
Chapter 7 Water: Quantity and Quality
7.1 The average annual rainfall in an area is 60 cm. The average annual
evapotranspiration is 35 cm. Thirty percent of the rainfall infiltrates and percolates into
the underlying aquifer; the remainder is runoff that moves along or near the ground
surface. The underlying aquifer is connected to a stream. Assuming there are no other
inputs or outputs of water to the underlying aquifer and the aquifer is at steady state
(neither gains nor loses water), what is the amount of baseflow contributed to the stream
from the groundwater?
Solution:
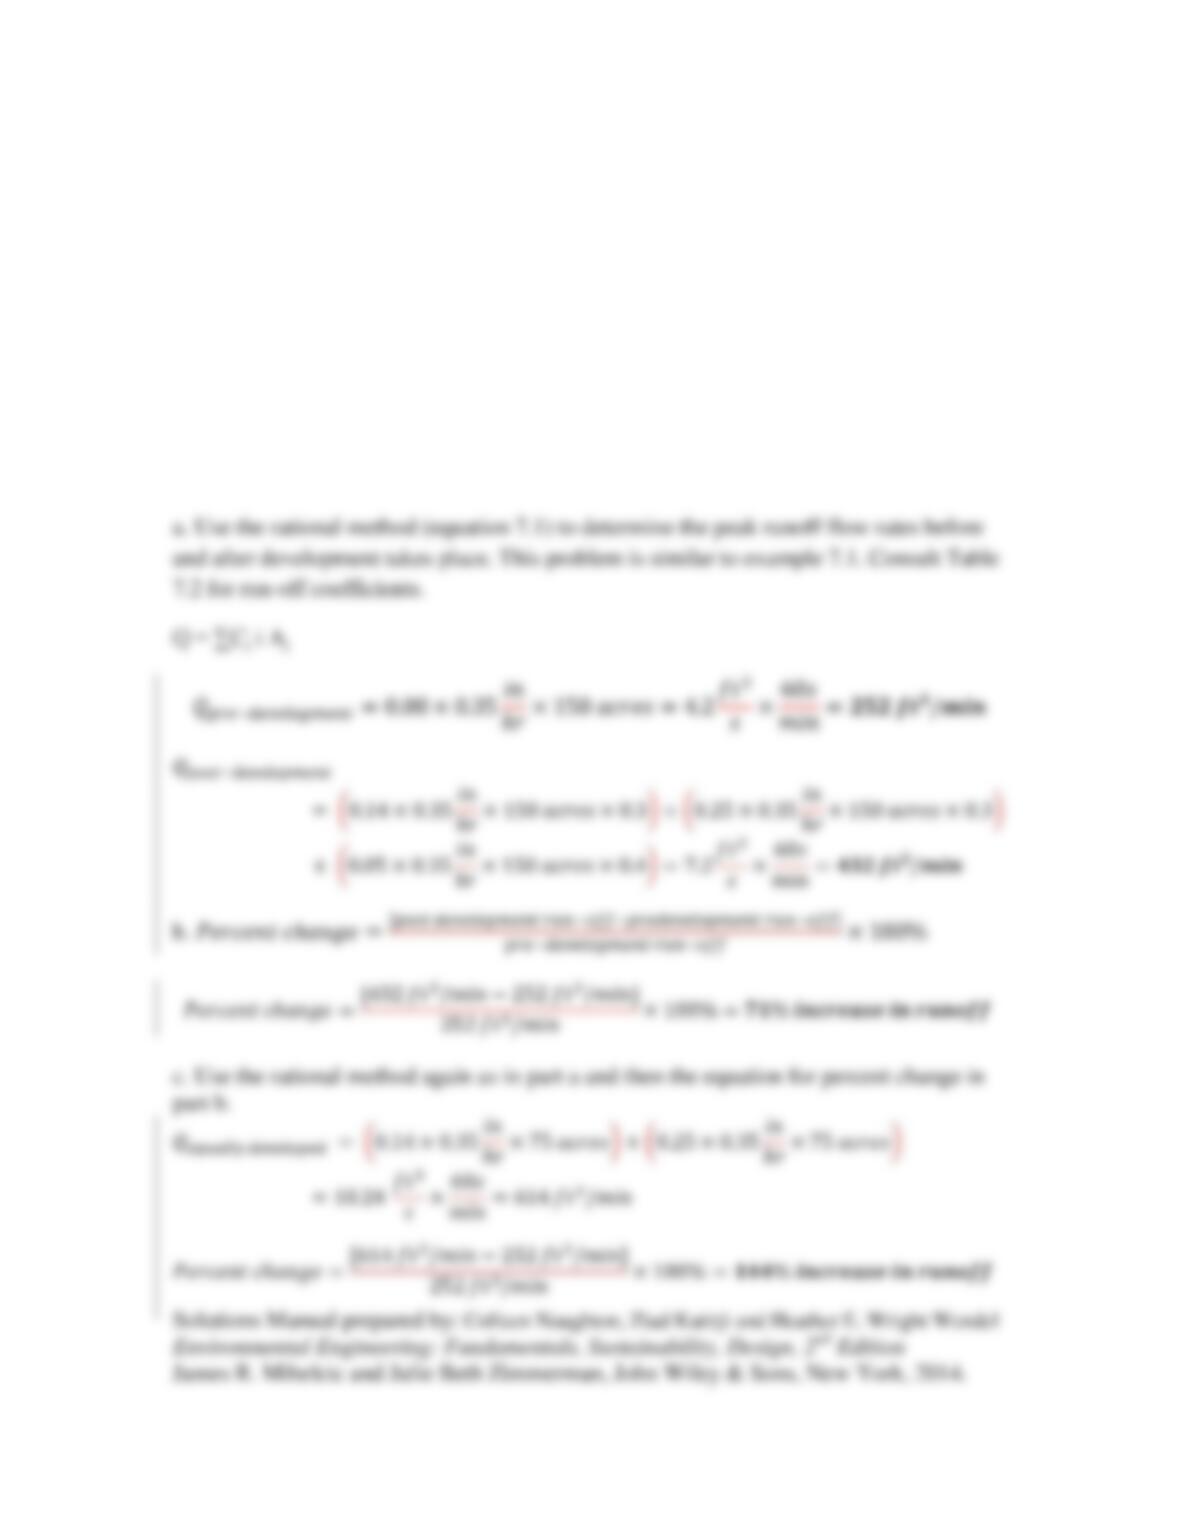
7.2 An agricultural watershed that is managed to minimize runoff consists of 150 acres
that has a land slope of 1-2% and sandy soils. The land is planned to be developed into a
residential subdivision (30% as a low–density residential area, 30% as a medium-density
residential area, and the remaining land preserved as green space. (a) Calculate the peak
runoff flowrate (ft3/min) before and after the development takes place for a storm with
rainfall intensity of 0.35 in/hr. (b) Determine the percent change in peak runoff between
the two land use scenarios. (c) If the greenspace was equally developed between low– and
medium- density development, how does your answer to part (b) change? (d) How do
your answers for the peak runoff flow rate in part (a) change if 100% of the land is
developed in a high-density residential?
Solutions:

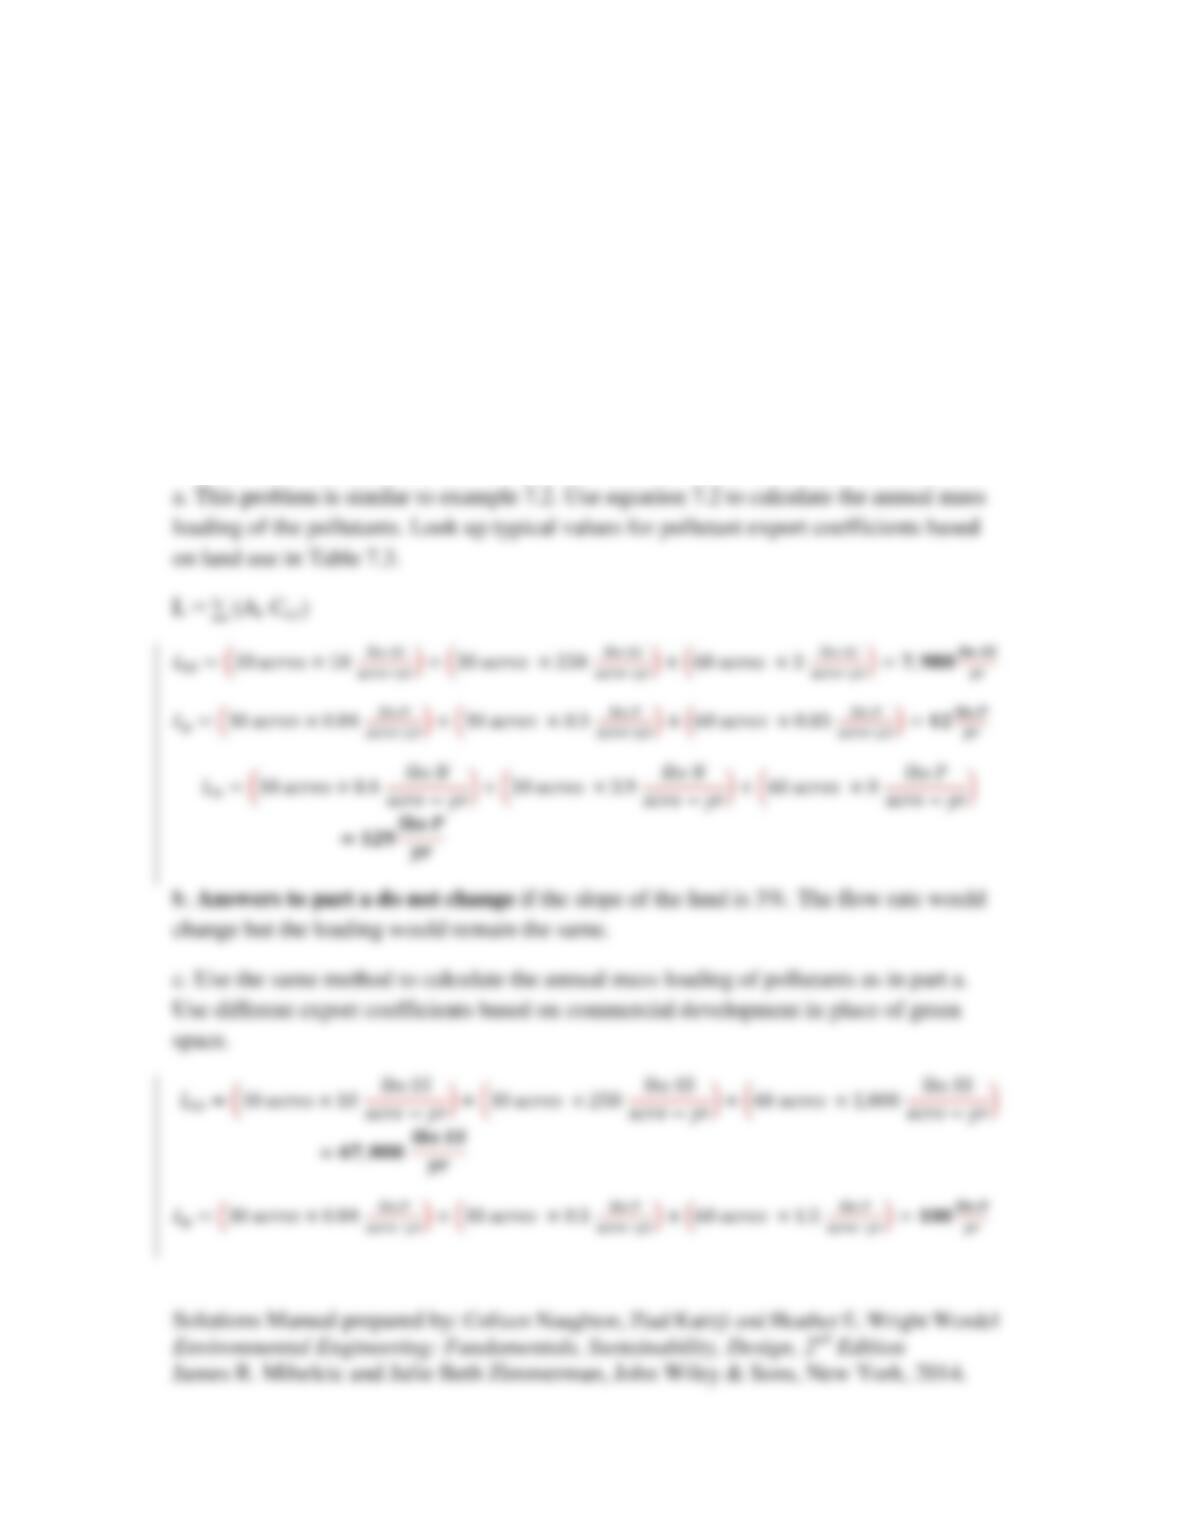
7.3 A rural watershed that is managed to minimize runoff consists of 120 acres of
cultivated land that has a gentle land slope (1-2%) and silty/sandy soils. The land is
planned to be developed into a residential housing with plans for 25% low-density
residential area, 25% for medium-density residential area, and 50% set aside as green
space. (a) Estimate the annual mass loading due to runoff for suspended solids (SS),
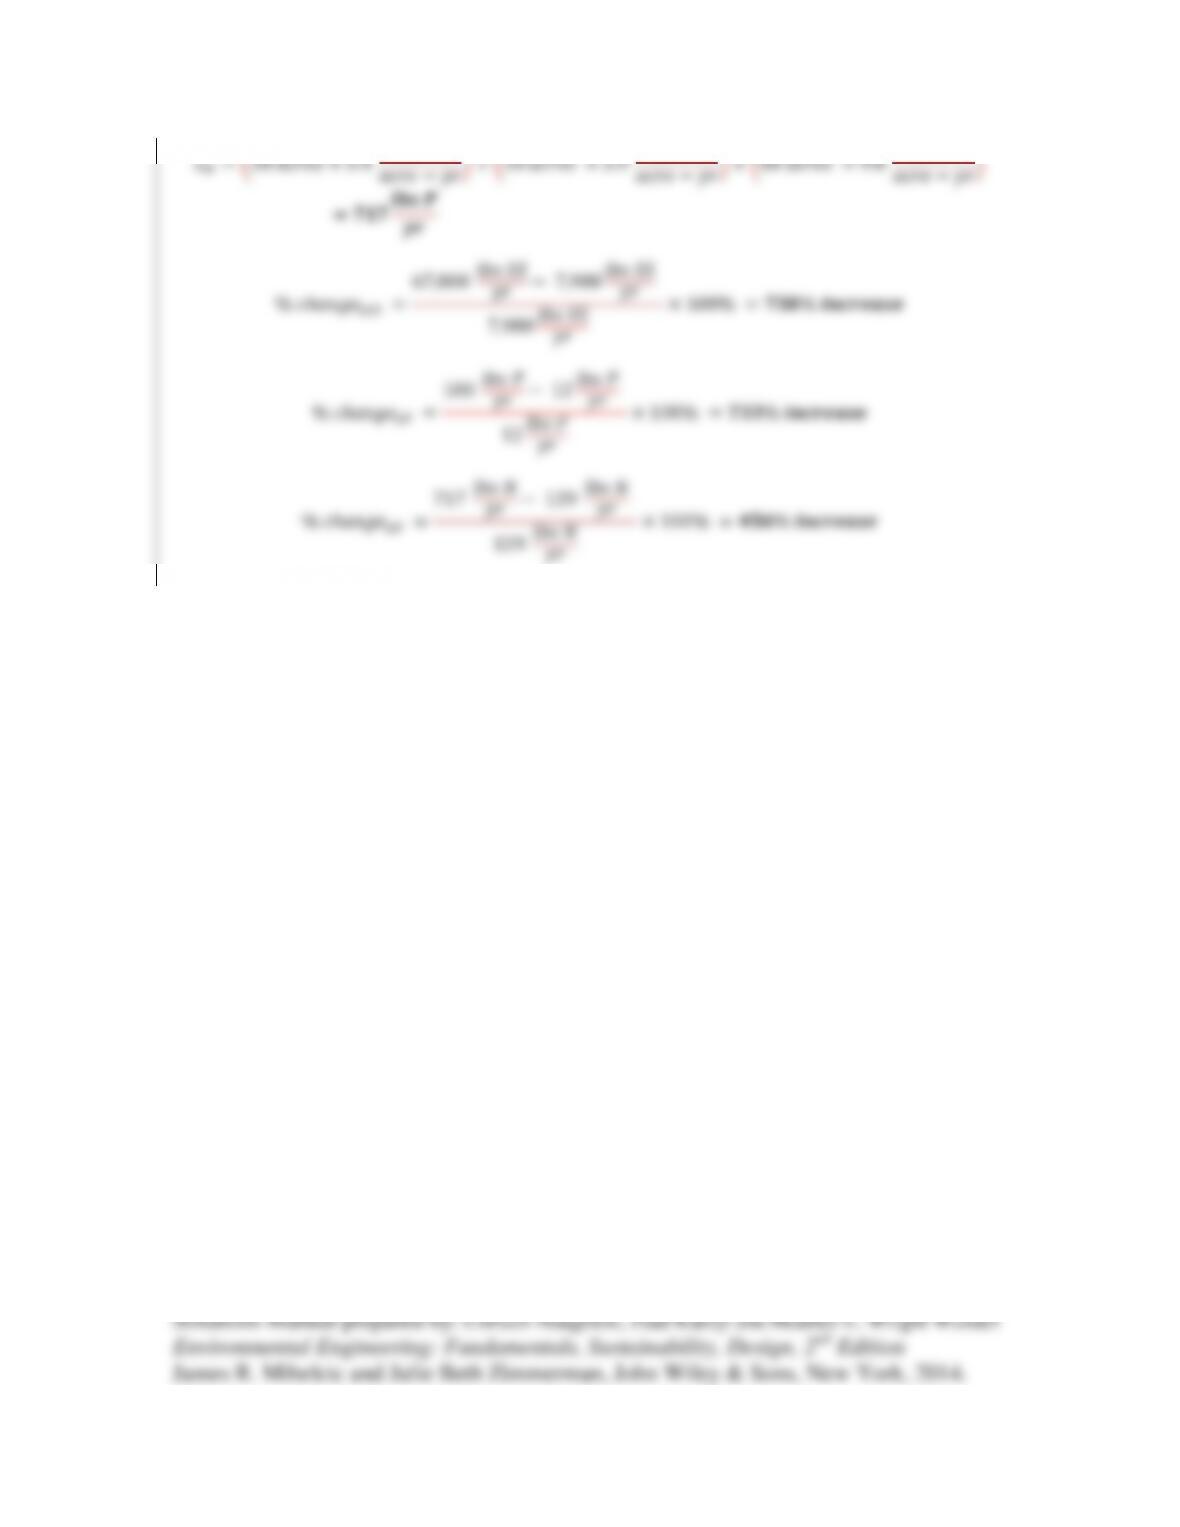
phosphorus (P), and nitrogen (N) (lbs/year). (b) How does your answer to part (a)
change if the slope of the land is 3%? (c) How does your answer to part (a) change if the
greenspace is developed into commercial development to serve social and economic
needs of the community, without leaving any natural areas as open green space?
Solution:
129 𝑙𝑏𝑠 𝑁
𝑦𝑟
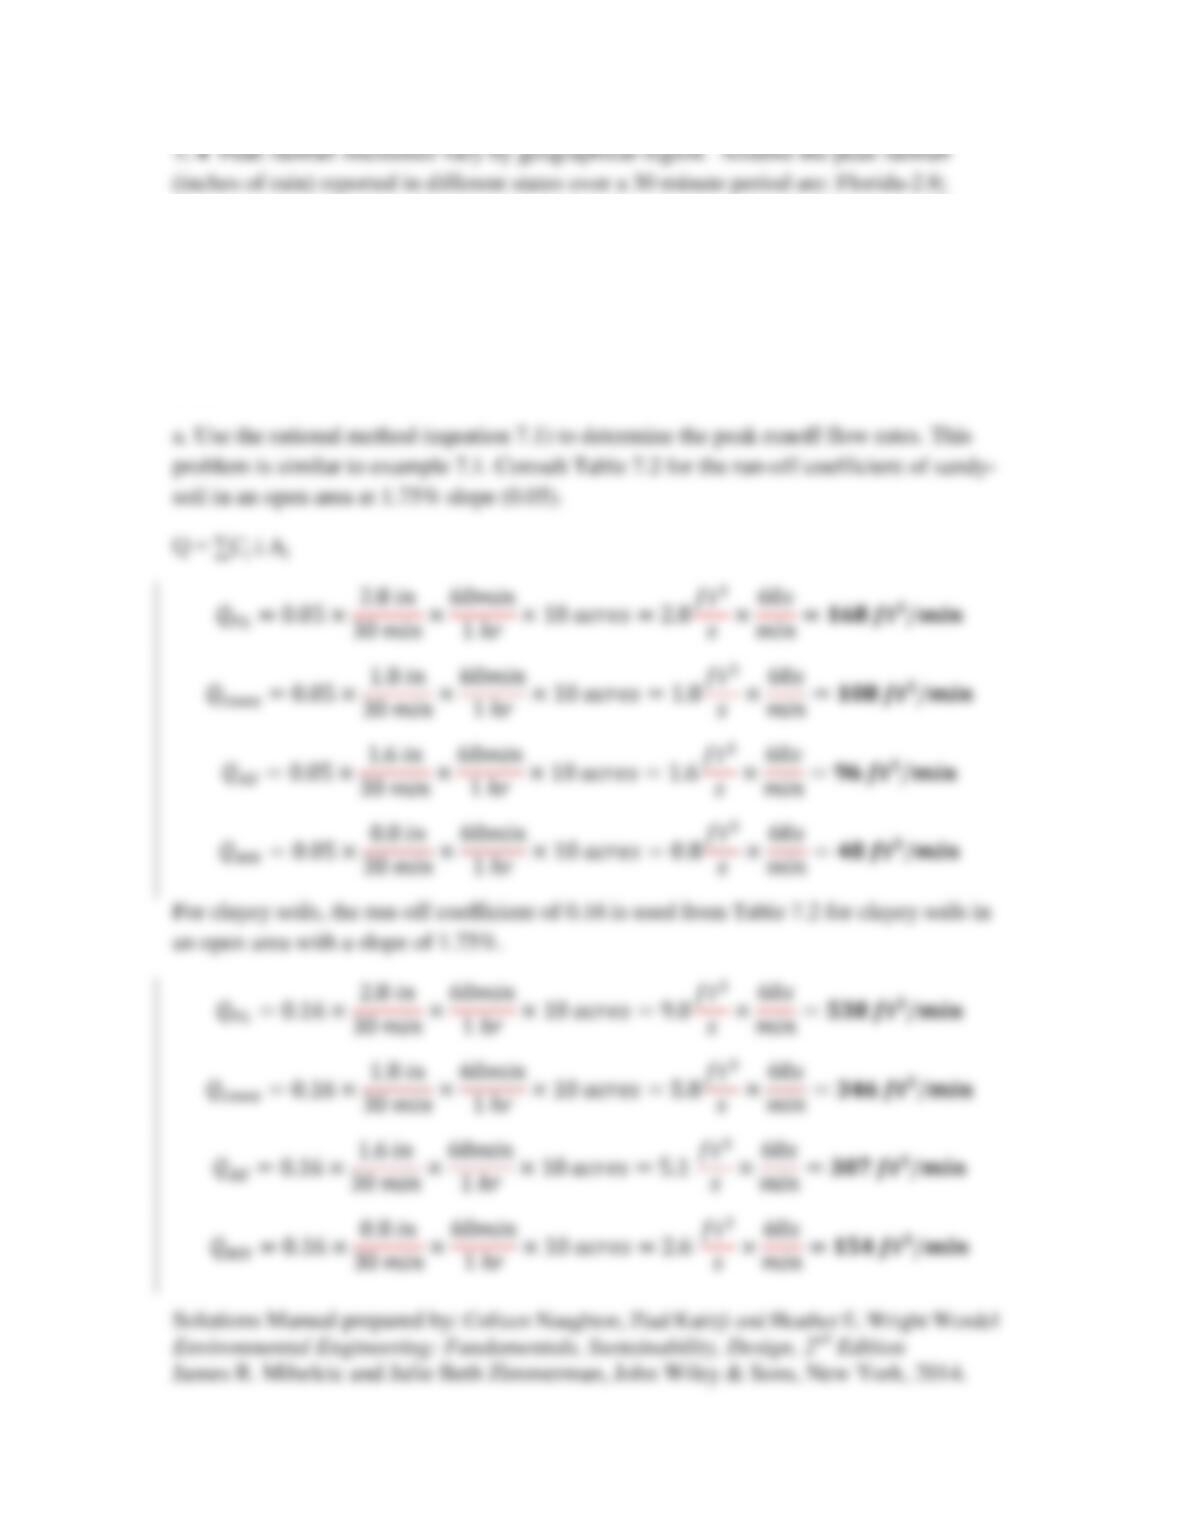
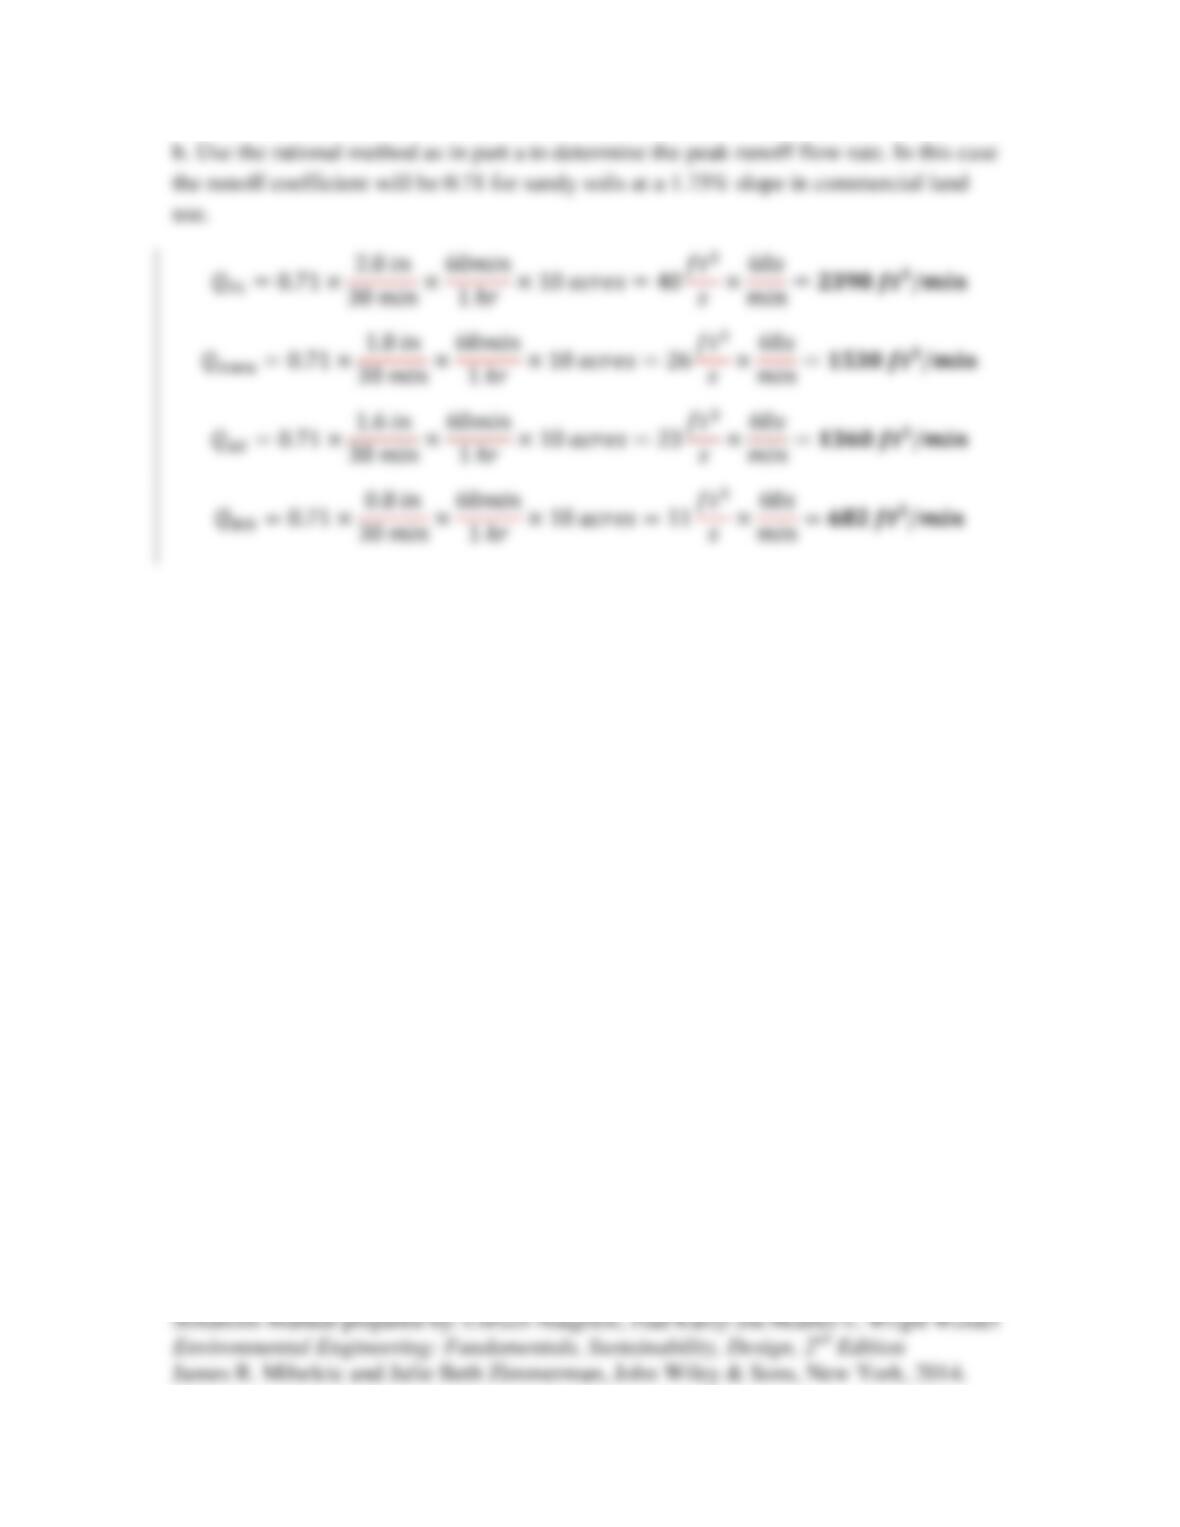
Iowa-1.8; Arizona-1.6; and Montana-0.8. (a) What is the peak runoff flow rate (ft3/min)
for an undisturbed open area of 10 acres with a slope of 1.75% that consists of sandy
soil? Perform the same calculations for clayey soils (b) What is the peak runoff flow
rate for a similar topography and soil type, but if the 10 acres of open area are
commercially developed.
Solution:
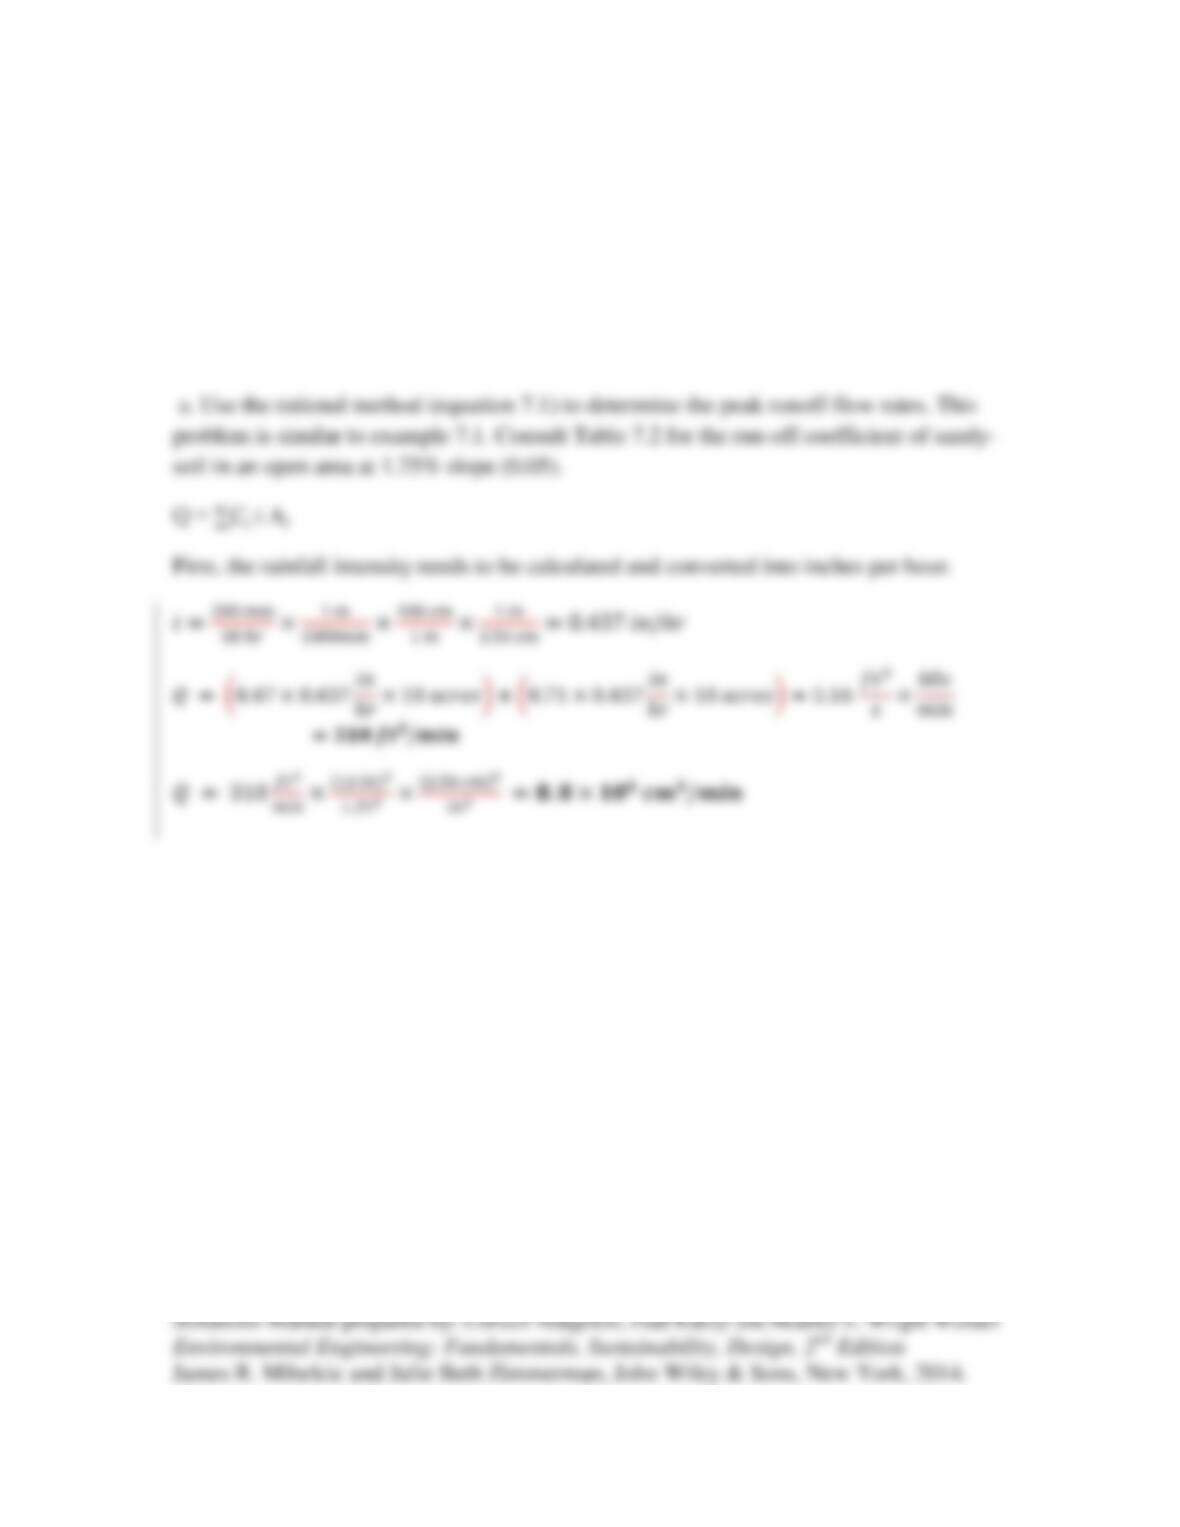
7.5 Western Australia is expected to see by the year 2030 a 10–20% increase in peak
rainfall intensity from the effects of climate change. If the current peak rainfall intensity
is 200 mm of rainfall falling over an 18-hr period, what is the peak runoff flowrate you
expect for a densely populated urban area of 20 acres on sandy soils with a slope of
1.75%, that consists of one half high-density residential development and one half
commercial development? Report your results in cm3/min and ft3/min.
Solution:
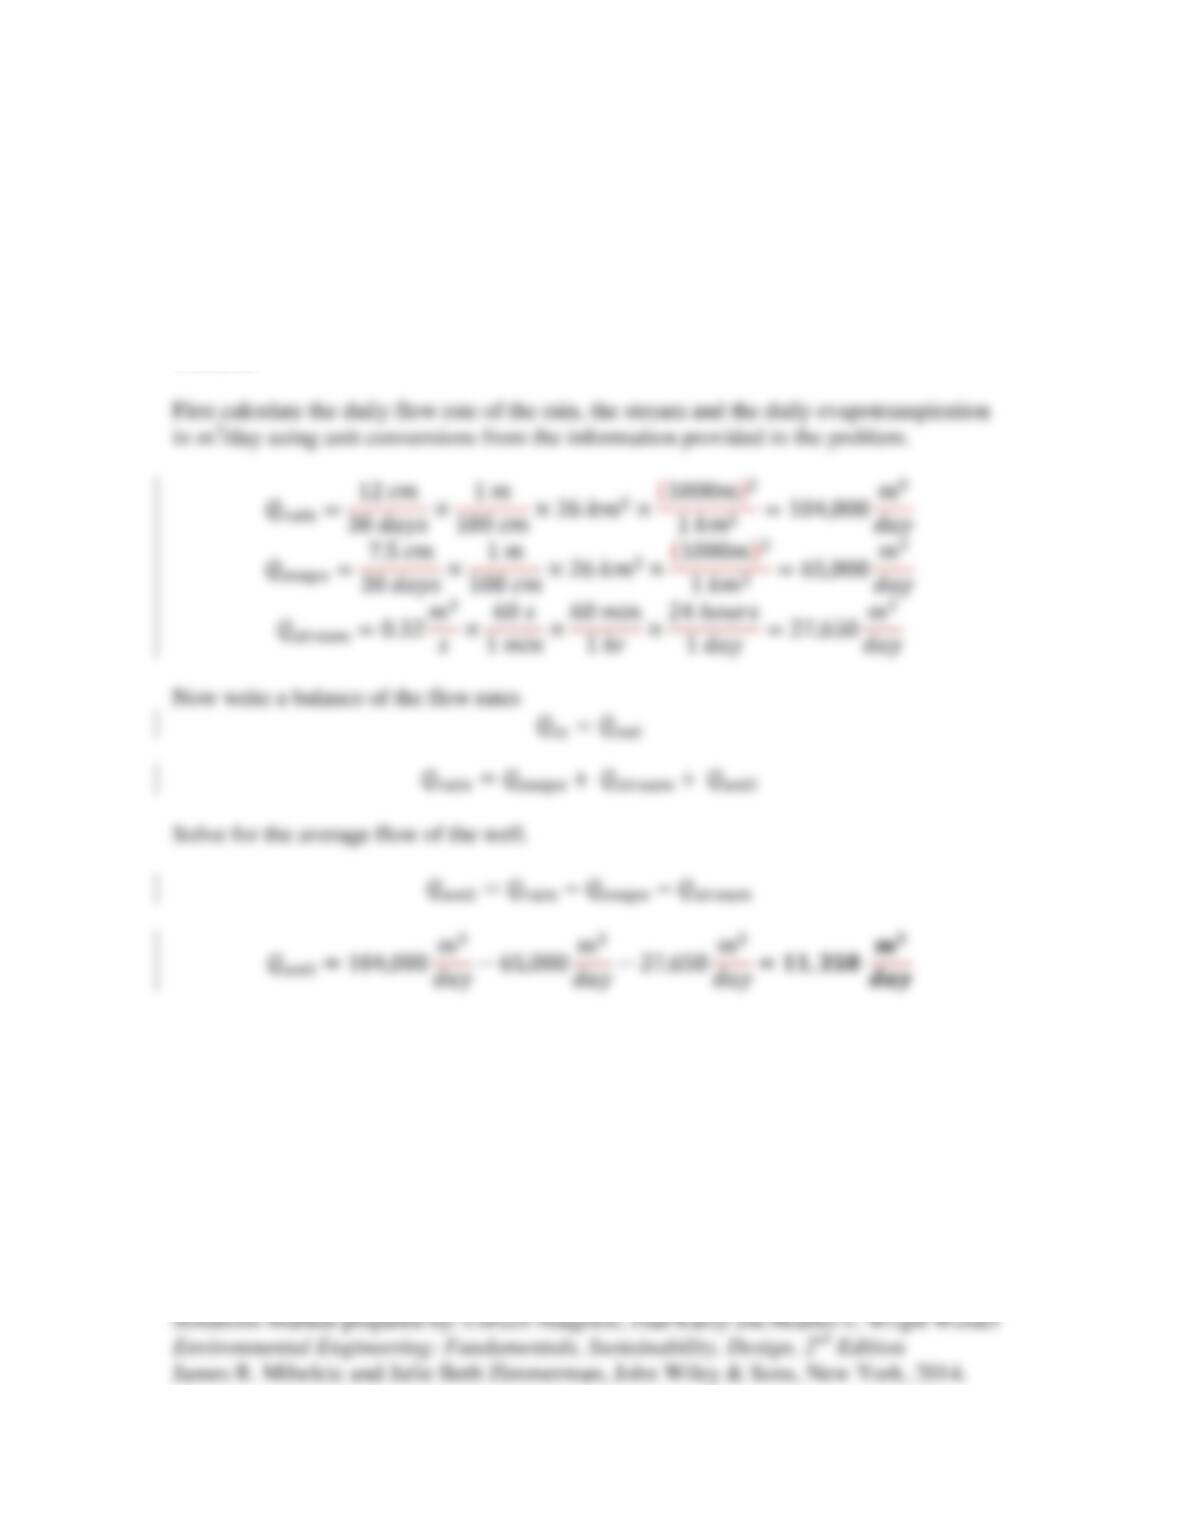
7.6 A small public well is used to supply drinking water to a small residential community
located in a 26 square-kilometer watershed. For the month of June, the measured rainfall
was 12 cm, the estimated evapotransiration was 7.5 cm and the surface water runoff
entered a small stream with an average flow of 0.32 m3/sec that leaves the watershed.
Estimate the average flow (m3/day) from the public well without depleting the underlying
aquifer (neither gains nor loses water). Assume that all water that infiltrates will percolate
to the aquifer.
Solution:

7.7 Go to the United Nations Environment Programme’s Global Environment Outlook
Web page, http://geodata.grid.unep.ch/. Look up two countries located in different
hemispheres. (a) What are their current amounts of water withdrawals and freshwater
withdrawals? (b) Are these countries currently experiencing water scarcity or expected to
experience water scarcity?
Solution:

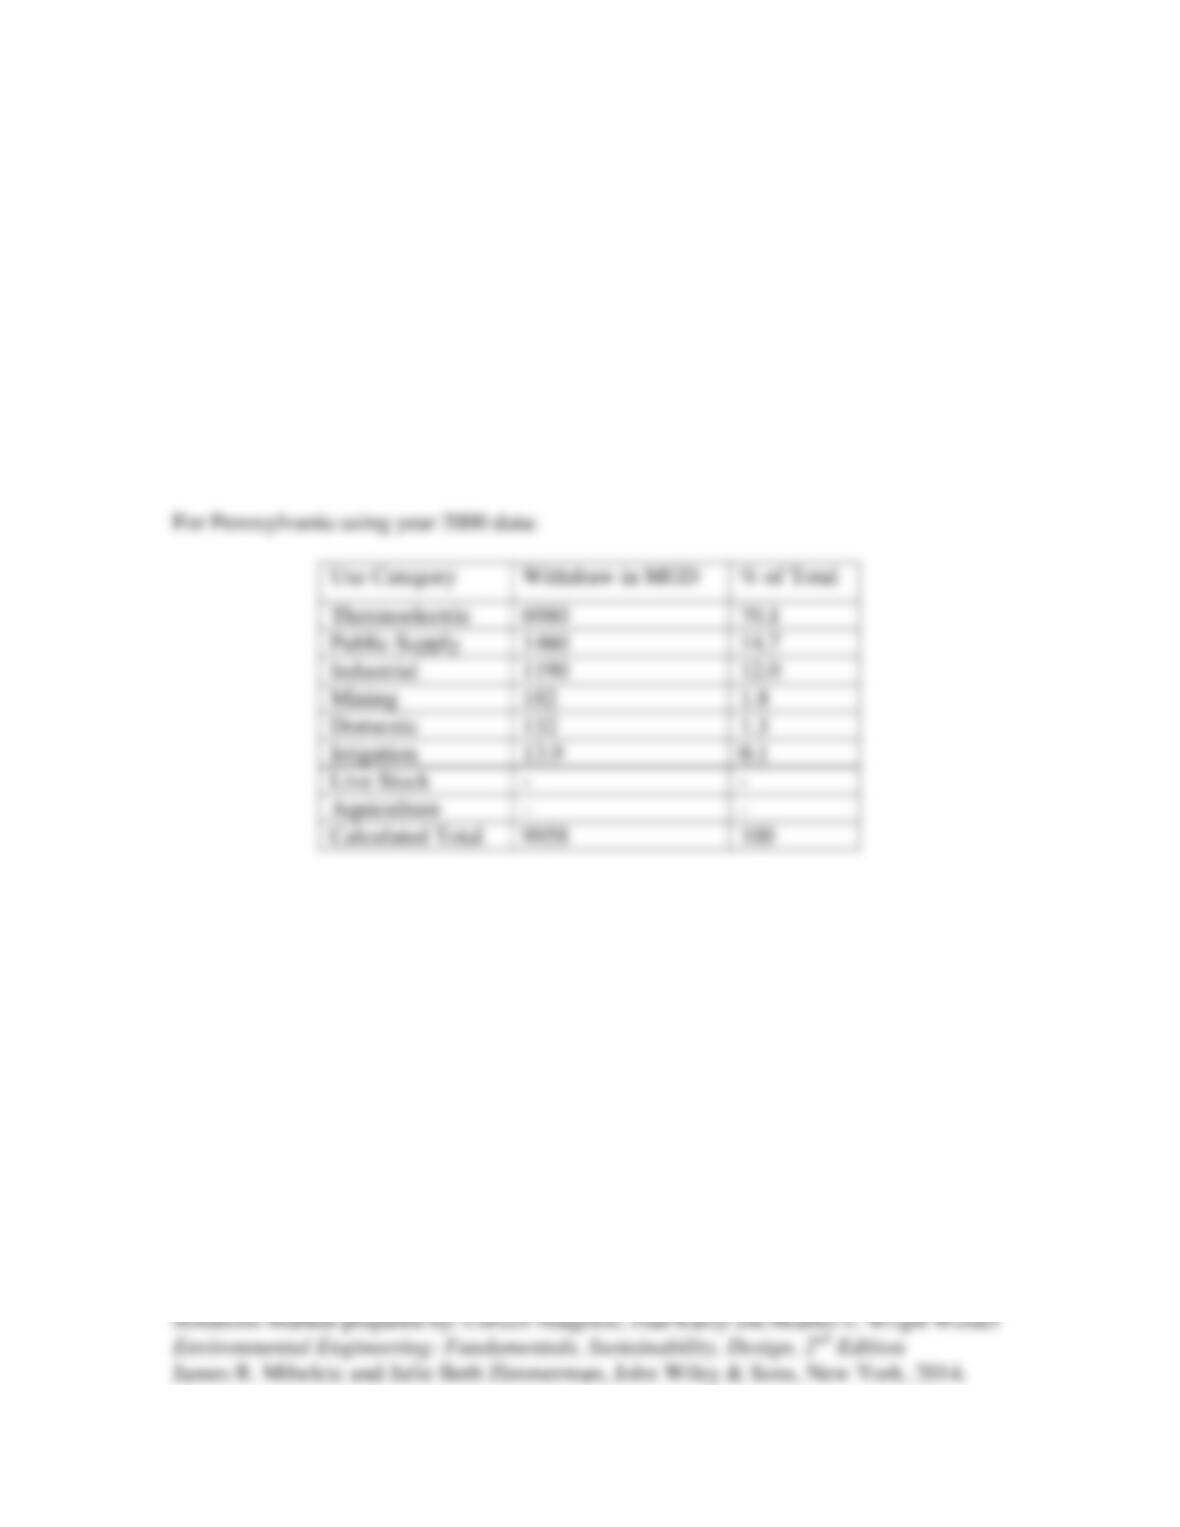
7.8 Go to the Web site of the U.S. Geological Survey (USGS), www.usgs.gov, and
navigate to “Water Use in the United States.” Look up the total water withdrawals
associated with the following uses in your state: thermoelectric, irrigation, public supply,
industrial, domestic, livestock, aquaculture, and mining. Place the eight uses in a table in
order of greatest to least water withdrawals. Determine the percent of the total water
withdrawals associated with each of these uses. Compare these percentages to the
national percentages listed in Table 7.6. Discuss how your state compares with the
national average.
Solution:
Students’ responses will vary depending on state.

7.9 Go to the Web site of the U.S. Geological Survey (USGS), www.usgs.gov, and
navigate to “Water Use in the United States.” Look up the total surface water and
groundwater withdrawals associated with your state. Determine the percent of surface
water and groundwater withdrawals relative to total withdrawals in your state. Compare
these percentages with the national distribution of surface water and groundwater use.
Discuss how your state compares with the national average.
Solution:
Students’ responses will vary depending on state.

7.10 Contact your local water or wastewater authority. Ask for the annual water usage
rates (average, maximum-day, minimum-day, and so on). For a water authority, ask how
much is unaccounted-for water; for a wastewater authority, ask for how much is wet-
weather flows. Use these numbers to estimate a demand factor and per capita (or metered
connections) water usage rates. Discuss how your local values compare with the expected
range of values described in this chapter.
Solution:
Students’ responses will vary depending on to water authority.

7.11 (a) Estimate your own actual water use during a typical day. List your water use
activities, and estimate the volume of water used for each activity. (b) Compare your
water usage rate with that of an average per person rate such as 101 gpdc. (c) Explain
why your rate may be more or less than the average rate. (d) How much of your water use
do you think was discharged as wastewater? (e) Did you do any water use activity that
did not create any collected wastewater?
Solution:
Students’ responses will vary.
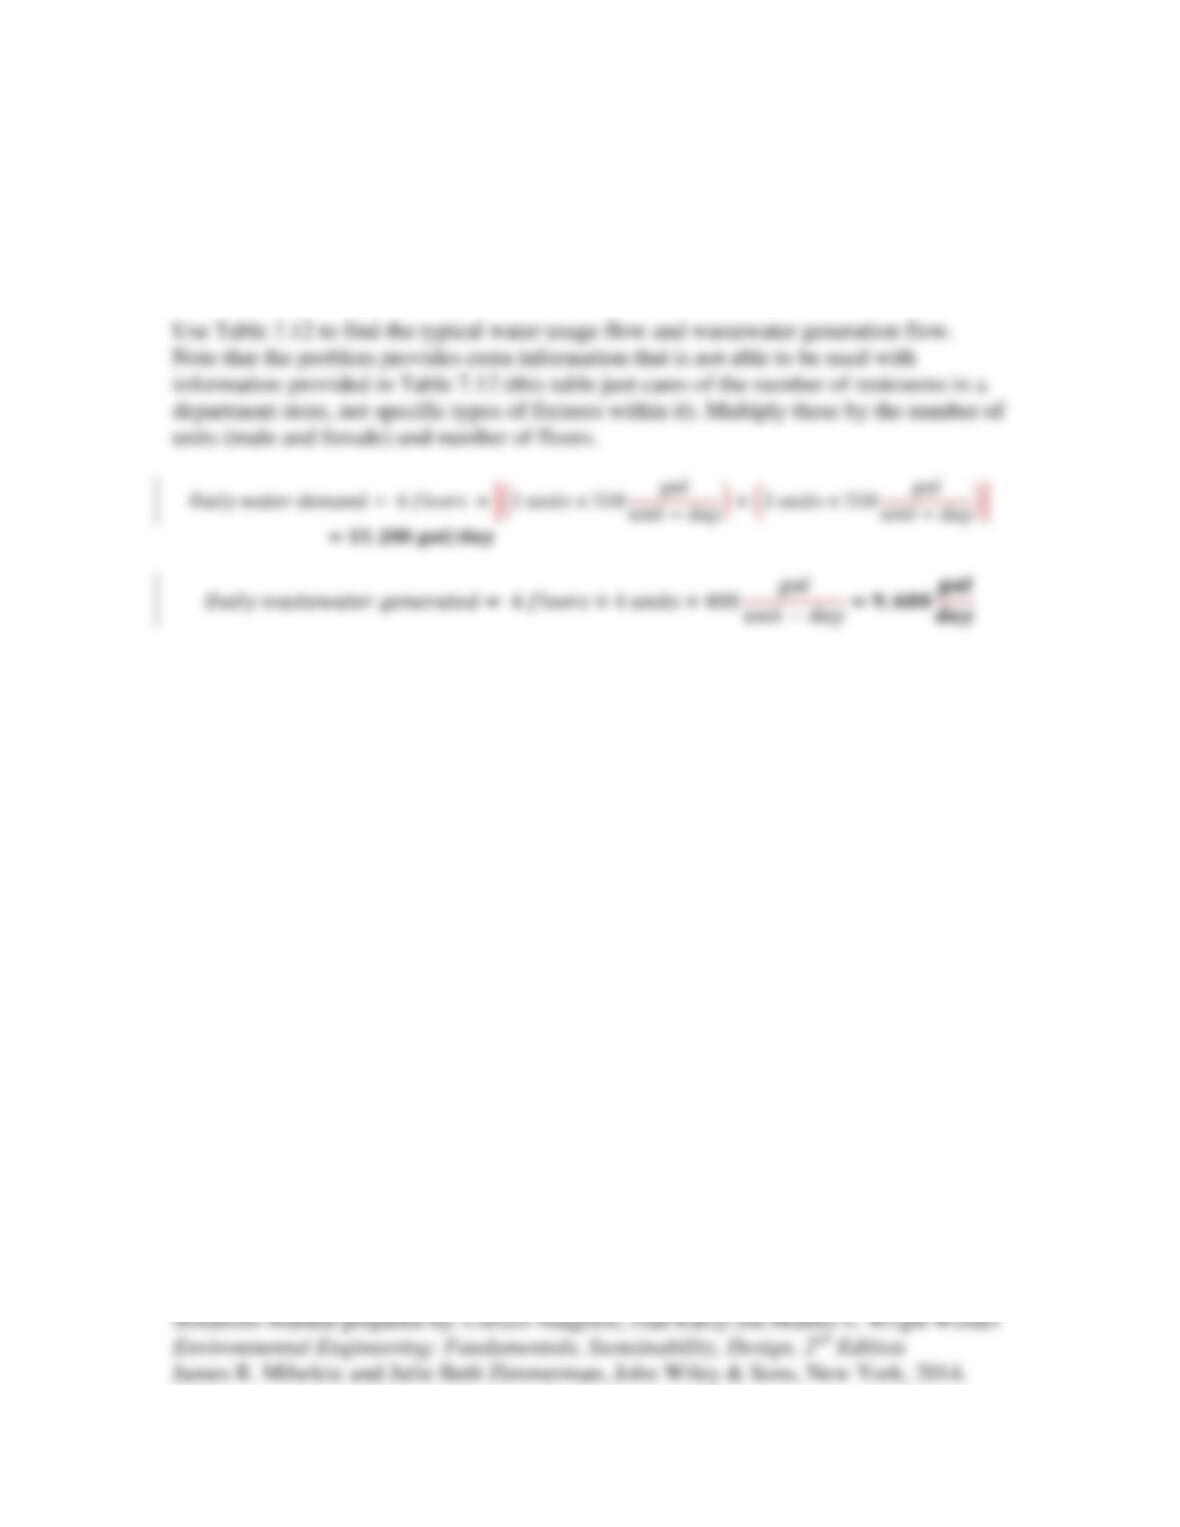
7.12 Estimate the daily water demand and wastewater generation for a department store
that has six floors. On each floor are two sets of men’s and women’s lavatories. The
men’s have two toilets, two urinals, and three sinks; the women’s have four toilets and
three sinks. Assume that each lavatory will be used by 35 people per day.
Solution:
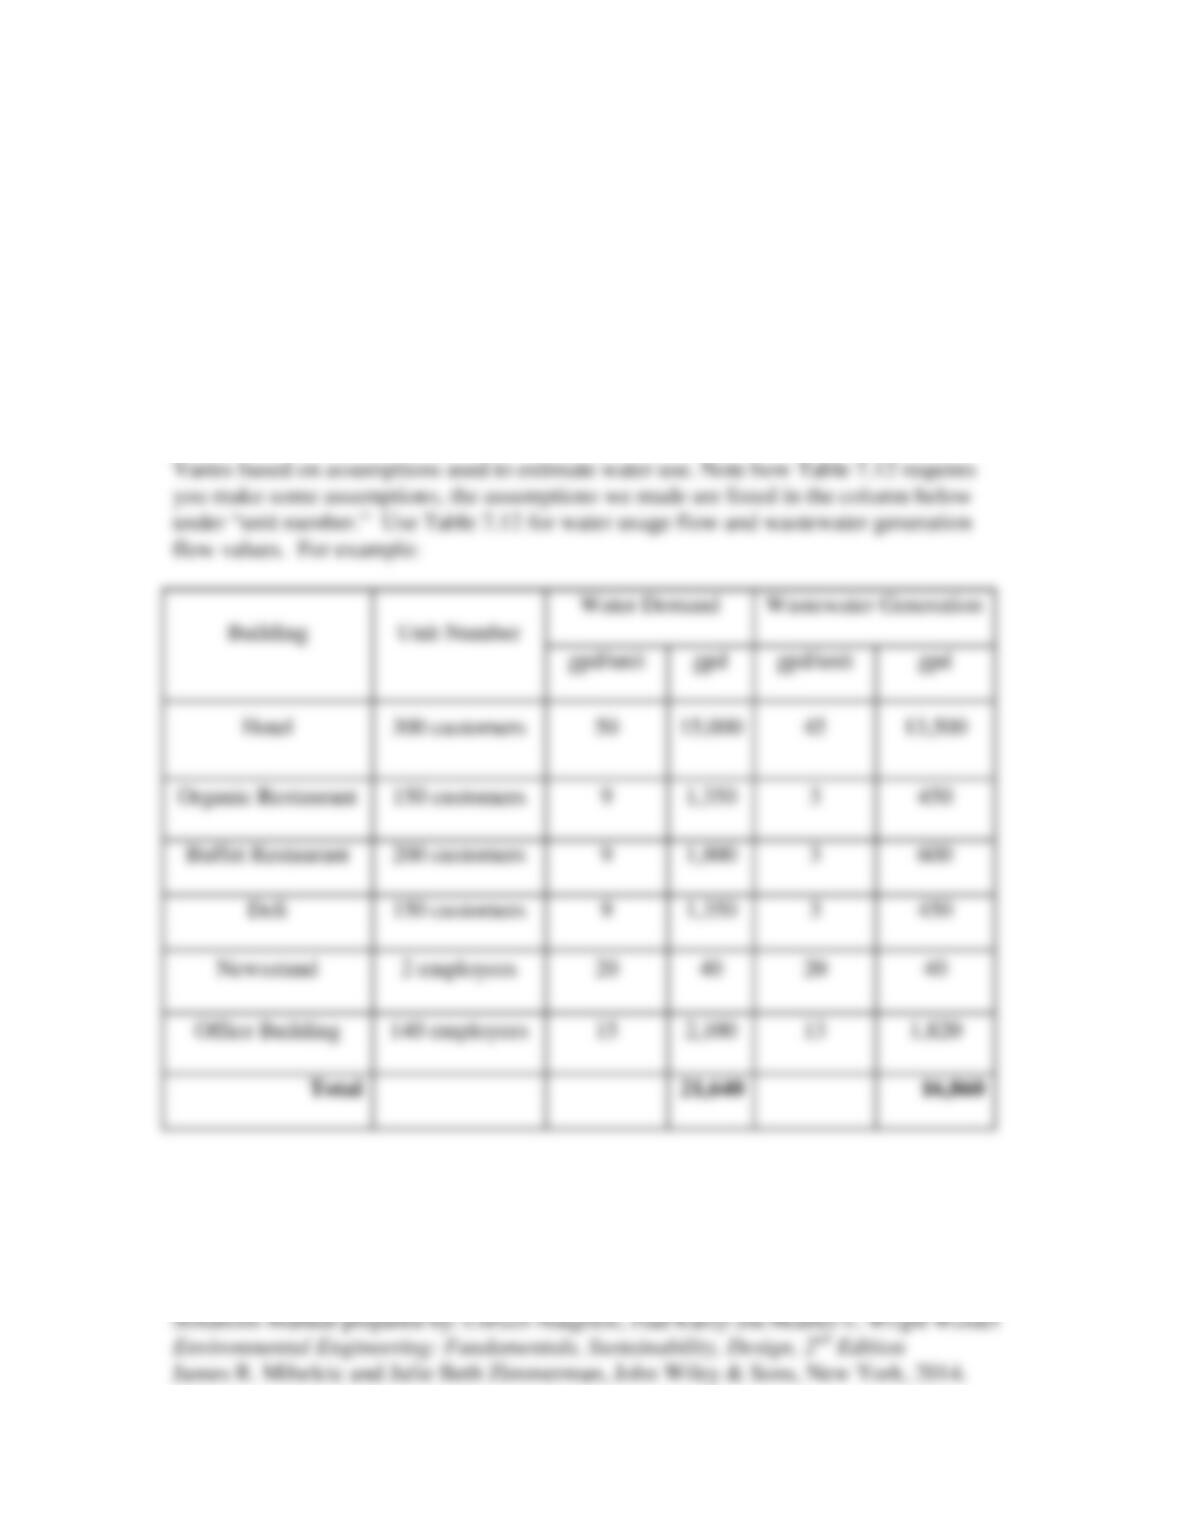
7.13 Estimate the daily water demand and wastewater generation for a small commercial
area that has the following buildings. Clearly indicate all assumptions and the estimated
water usage for each building: (a) a 200-room hotel with 35 employees and one kitchen;
(b) three restaurants, one being an organic restaurant with regionally produced foods,
another an all–you–can-eat buffet (dinner only), and the third a vegan deli open from 5:00
A.M. to 3:00 P.M.; (c) a newsstand that sells magazines, refreshments, and snacks with one
lavatory used only by the employees; and (d) a three-story office building with basement
employing 140 people and with two sets of men’s and women’s lavatories per floor.
Solution:

7.14 Estimate the maximum-day demand plus fire flow for a residential area. The
residential area is 400 acres divided into .25-acre lots with yards that are 75 ft. wide.
Assume the average population density is 2.8 people per home and the maximum-day
demand factor is 2.1.
Solution:
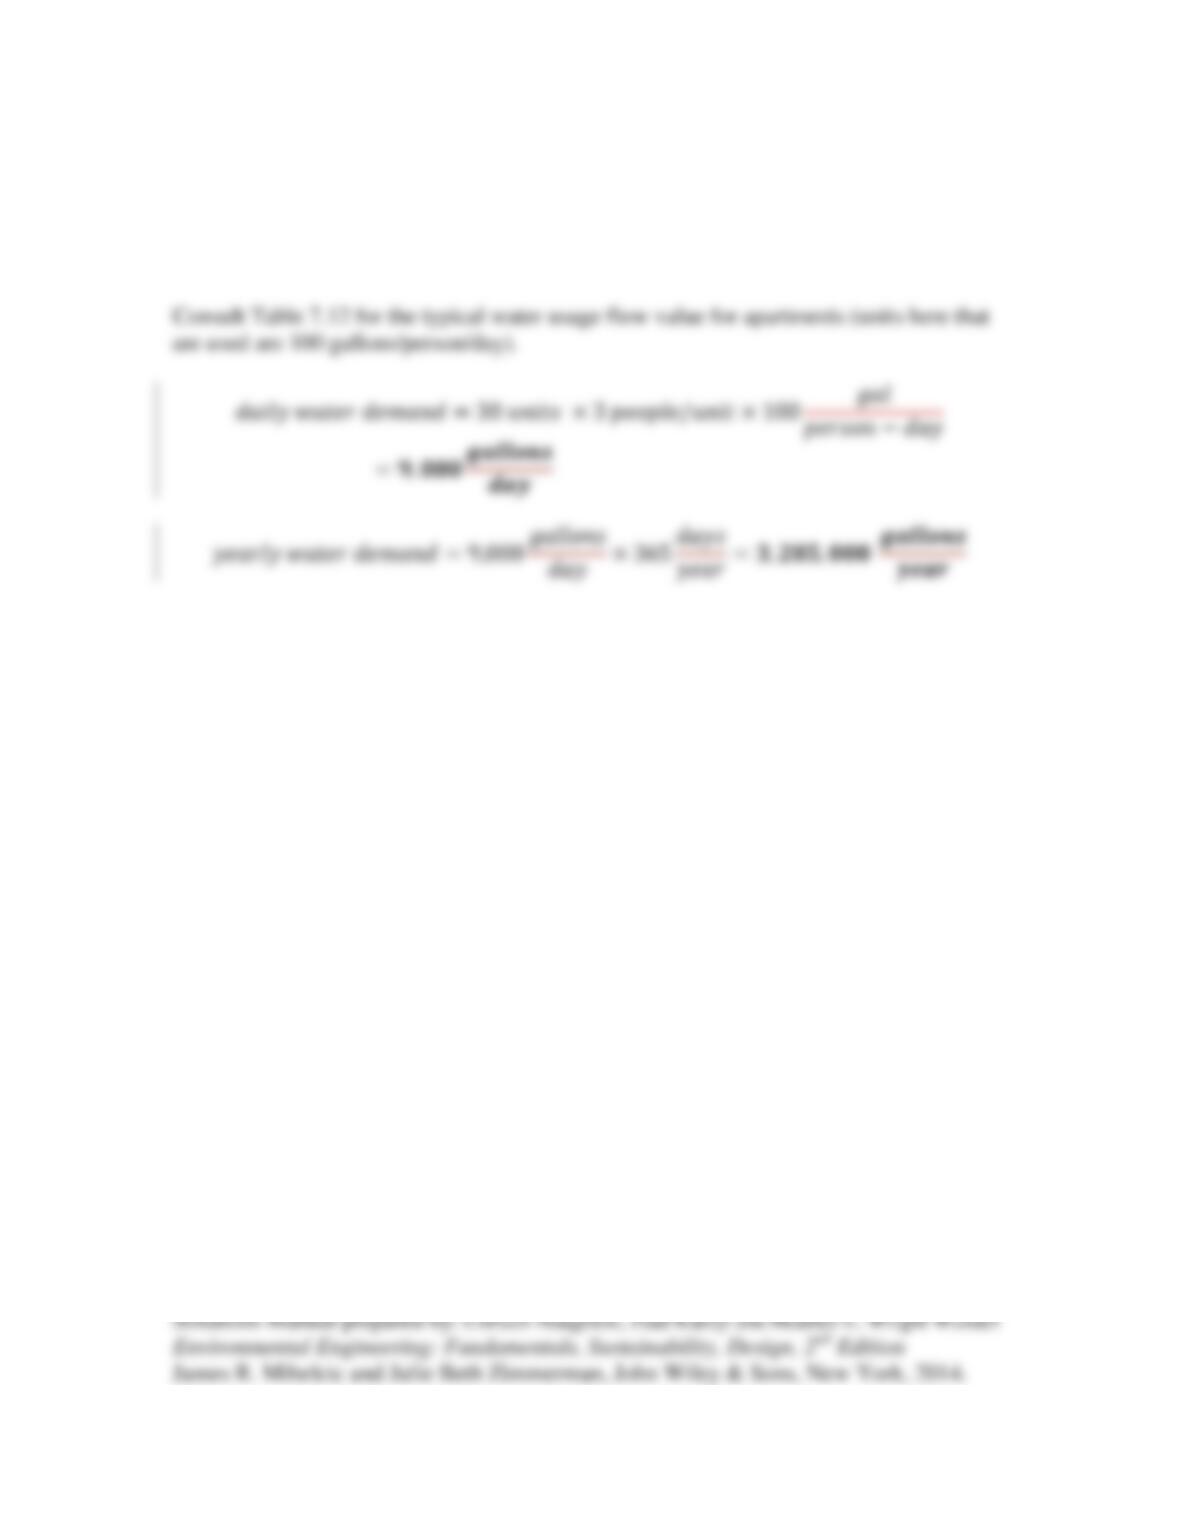
7.15 You are working on a project to put in a new set of townhouse apartments. Estimate
the daily and yearly water demand given 30 apartment units with an average of three
people living in each unit.
Solution:
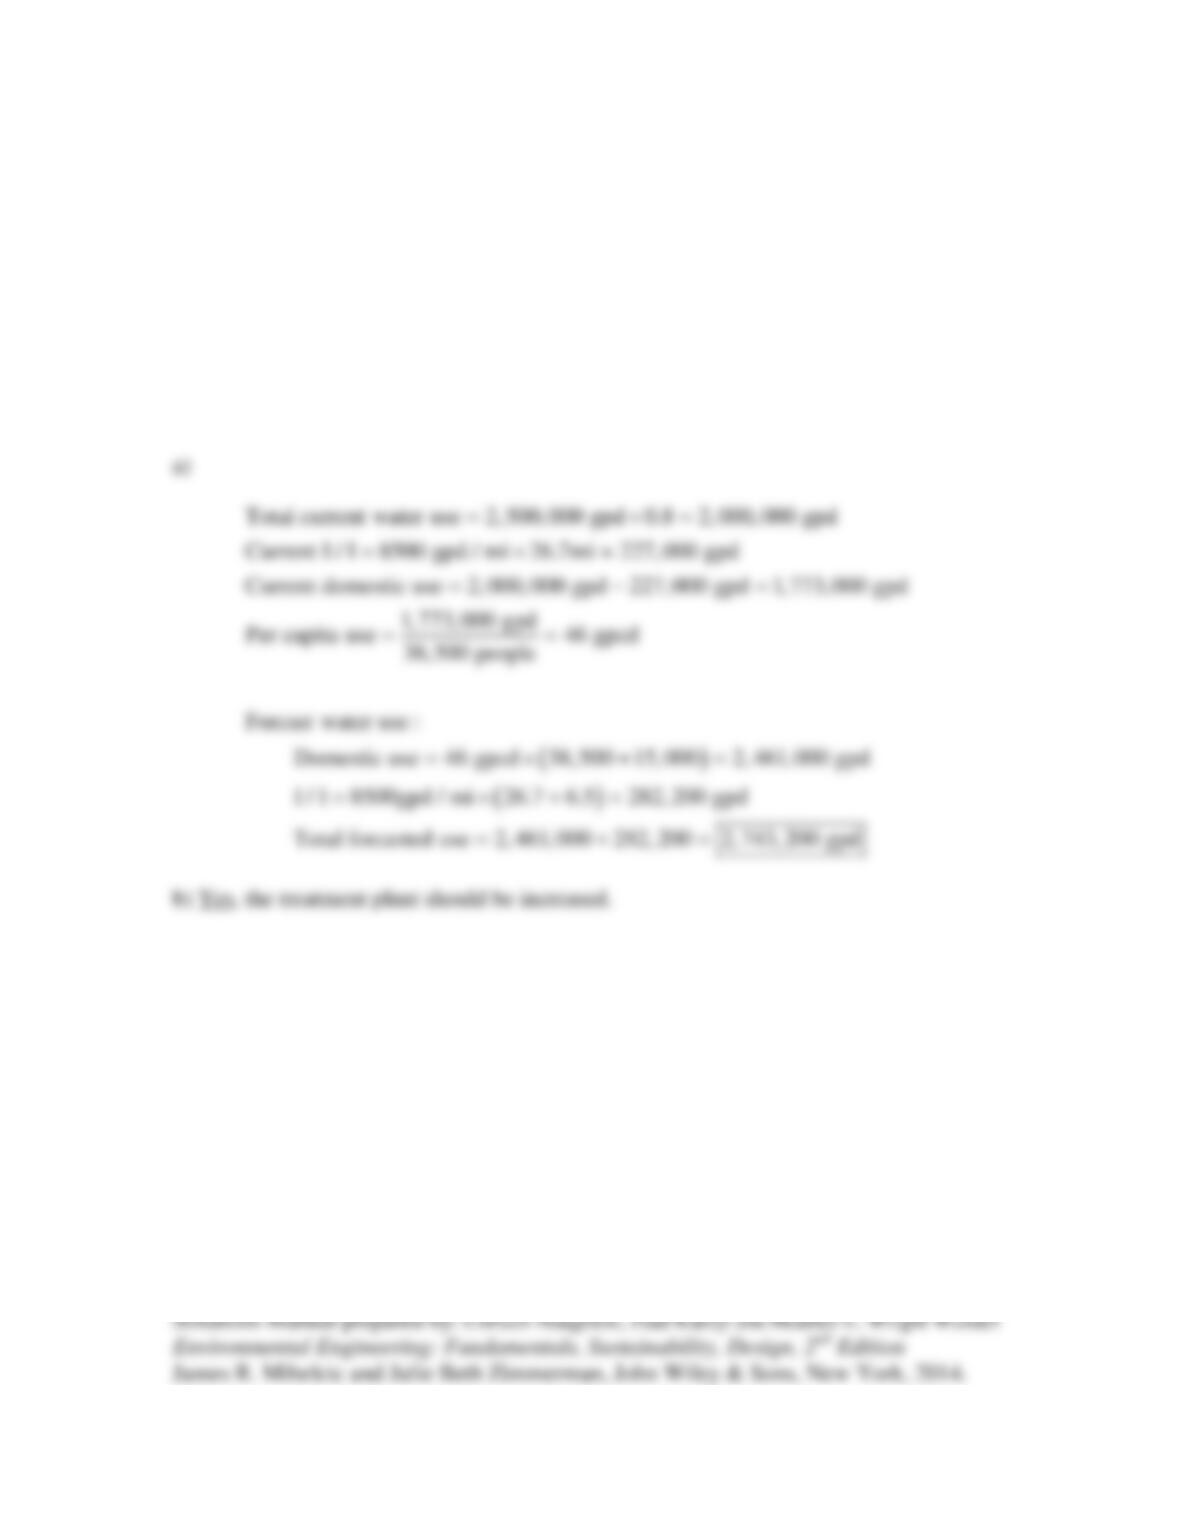
7.16 A 2.5 MGD wastewater treatment plant is currently running at 80 percent capacity
during the annual maximum day, servicing a city of 38,500 people with 26.7 mi. sewers.
During the next 10 years, it is expected that new residential developments for 15,000
people will be built, along with an additional 6.5 mi. sewers. The sewer is assumed to
leak 8,500 gpd/mi. (a) Project the maximum daily demand for the wastewater treatment
plant after the new development is built. (b) Should the wastewater treatment plant’s
capacity be increased?
Solution: