
Chapter 5. Biology
5.1 The World Health Organization (WHO) reports that diarrhea causes 4% of all deaths
worldwide, killing 2.2 million people every year, mostly children in developing countries.
Diarrhea is a symptom of infection caused by members of which four organism groups listed in
Figure 5.4 which can be spread by contaminated water?
Solution:

5.2 Figure 5.4 described the major organism groups important to environmental engineering,
many which cause water related diseases. Water related diseases include those diseases derived
from exposure to microorganisms or chemicals that are found in water humans drink. Other
water related diseases include those that have part of their lifecycle in water (e.g.,
schistosomiasis), diseases like malaria that have water–related vectors due sometimes to
improper management of stormwater and solid waste, and other diseases such as legionellosis
that is carried by aerosols that contain disease causing organisms. Use Figure 5.4 and research
you perform on the World Health Organization’s web site on “water related diseases” to answer
the following questions: (a) Giardia intestinalis and Cryptosporidium are members of what
group, (b) Legionella is a member of what group, (c) Hepatitis A and E are caused by members
of what group, (d) Typhoid fever is caused by Salmonella typhi and Salmonella paratyphi that
are part of what group, (e) cholera is caused by Vibrio cholera which is a member of what
group? (f) Ascariasis is an infection of the small intestine caused by the large roundworm,
Ascaris lumbricoides, that is a member of what group?
Solution (links were active in November, 2013):

5.3 Figure 5.4 described the major organism groups important to environmental engineering,
many which are used in treatment of domestic, agricultural, and industrial wastes. Identify the
major organism groups listed in this figure (e.g., viruses, bacteria, algae, protozoa, rotifers) that:
(a) use solar energy to transfer oxygen into wastewater stabilization ponds (i.e., lagoons), (b) are
key organisms in the removal of the organic matter that makes up biochemical oxygen demand
in wastewater, (c) are single–cell organisms found in biological wastewater treatment and
resource recovery systems that feed on bacteria and algae, (d) are multi-cellular organisms found
in biological wastewater systems, (e) include the gram-positive organism, Nocardia, which is
normally found in wastewater treatment plants, but if it experiences excessive growth, can result
in foaming and poor settling of solids in the secondary settling reactor (i.e., clarifier).
Solution:

5.4 The World Health Organization reports that malaria is the most important parasitic infectious
disease. WHO estimates there are 300–500 million cases of malaria globally with the primary
burden assumed by those living in Sub-Saharan Africa. Humans contract malaria after being
bitten by a malaria–infected mosquito. These mosquitos breed in fresh and sometimes brackish
water, which may be because of improper management of irrigation water, stormwater, and solid
waste. Malaria is known to be caused by four species of Plasmodium parasites (P. falciparum,
P. vivax, P. ovale, P. malariae). Are these parasites prokaryotes or eukaryotes?
Solution:
5.5 Mathematical models are used to predict the growth of a population, that is, population size
at some future date. The simplest model is that for exponential growth. The calculation requires
knowledge of the organism’s maximum specific growth rate. A value for this coefficient can be
obtained from field observations of population size or from laboratory experiments where
population size is monitored as a function of time when growing at high substrate concentrations
(i.e., S >> Ks):
Time (d)
Biomass (mg/L)
0
50
1
136
2
369
3
1,004
4
2,730
5
7,421
Calculate µmax for this population assuming exponential growth; include appropriate units.
Solution:
5.6 Once a value for µmax has been obtained, the model may be used to project population size at
a future time. Assuming that exponential growth is sustained, what will the population size in
Problem 5-5 be after 10 days?
Solution:
10
LL
5.7 Consider a population with an initial biomass (X0) of 5 mg VSS/L, a maximum specific
growth rate (
max
μ
) of 0.9/day, and a respiration rate coefficient of 0.15/day. Determine the
biomass concentration (mg VSS/L) at the end of (a) 5 days and (b) 20 days.
Solution:
b) 𝑋20 𝑑𝑎𝑦𝑠 =(5 𝑚𝑔𝑉𝑆𝑆/𝐿)× 𝑒�0.9
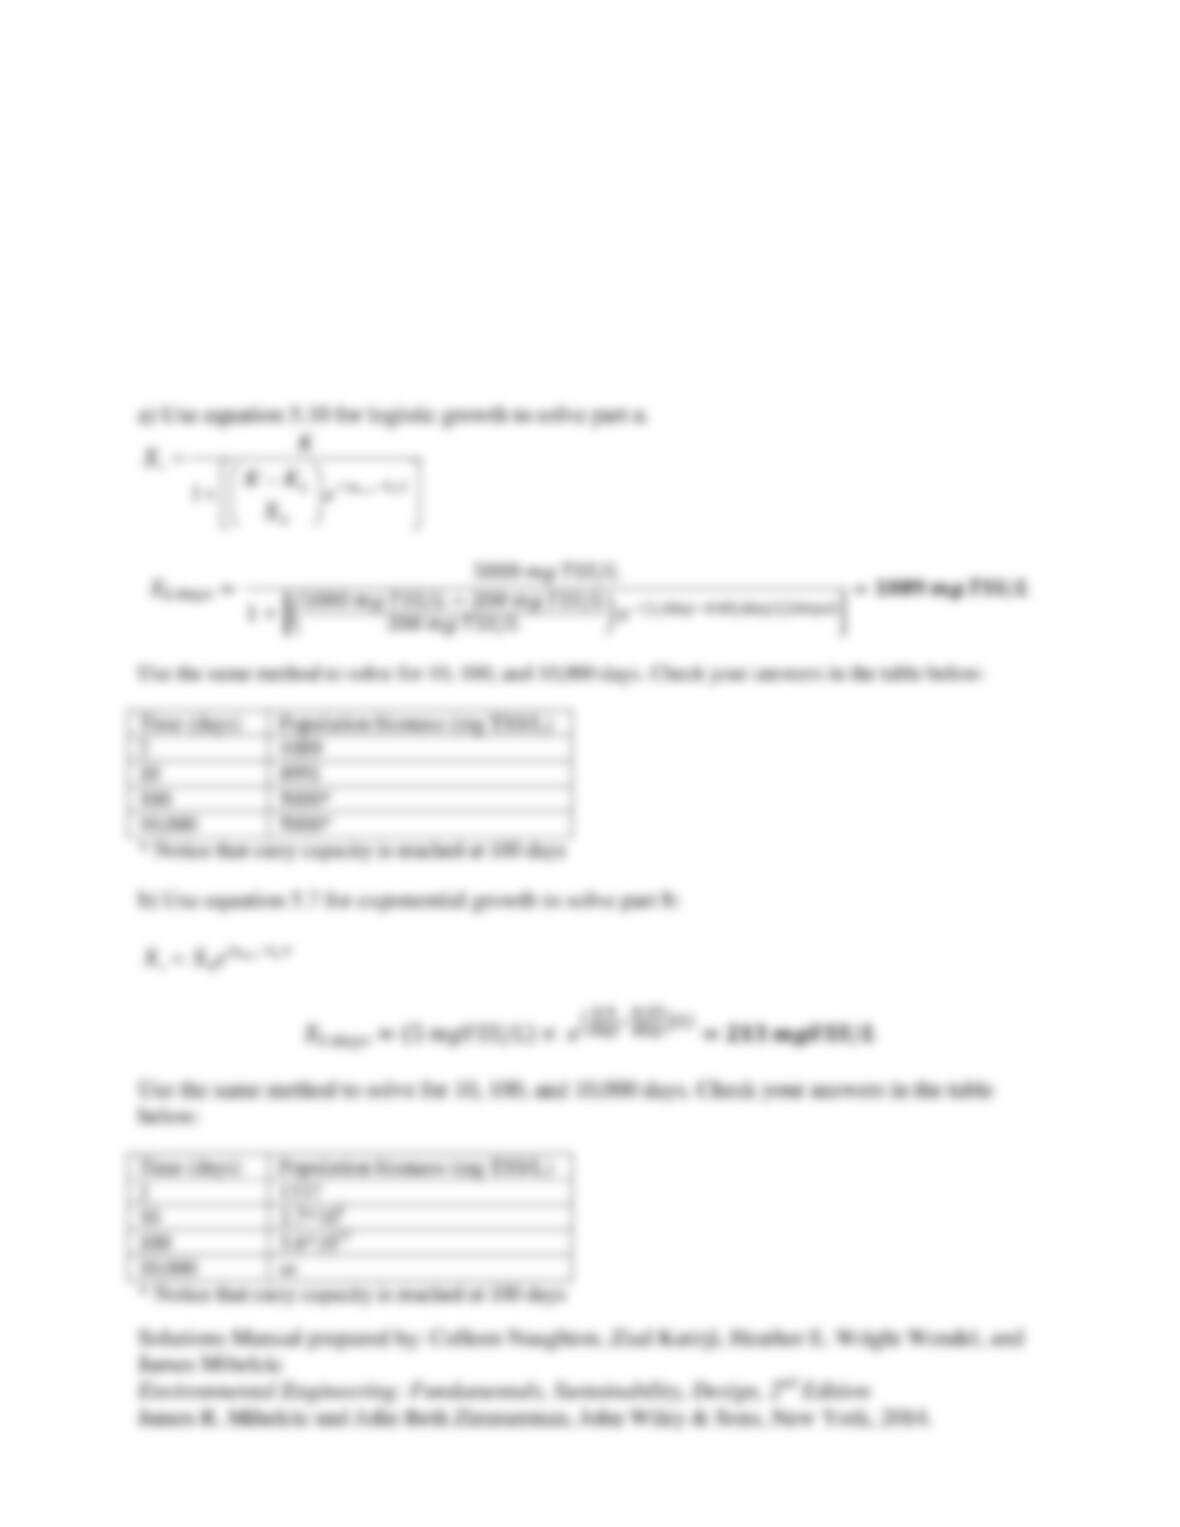
5.8 Consider a population with the following characteristics; initial biomass (X0) of 200 mg
TSS/L, maximum specific growth rate (
max
μ
) of 1/day, and a respiration rate coefficient of
0.05/day. (a) Assume logistic growth. Determine the population’s biomass (in units of TSS/L)
after 2, 10, 100, and 10,000 days if the carrying capacity (K) is reported to be 5,000 mg TSS/L.
(b) Assume exponential growth. Determine the population’s biomass (in units of TSS/L) after 2,
10, 100, and 10,000 days.
Solution:
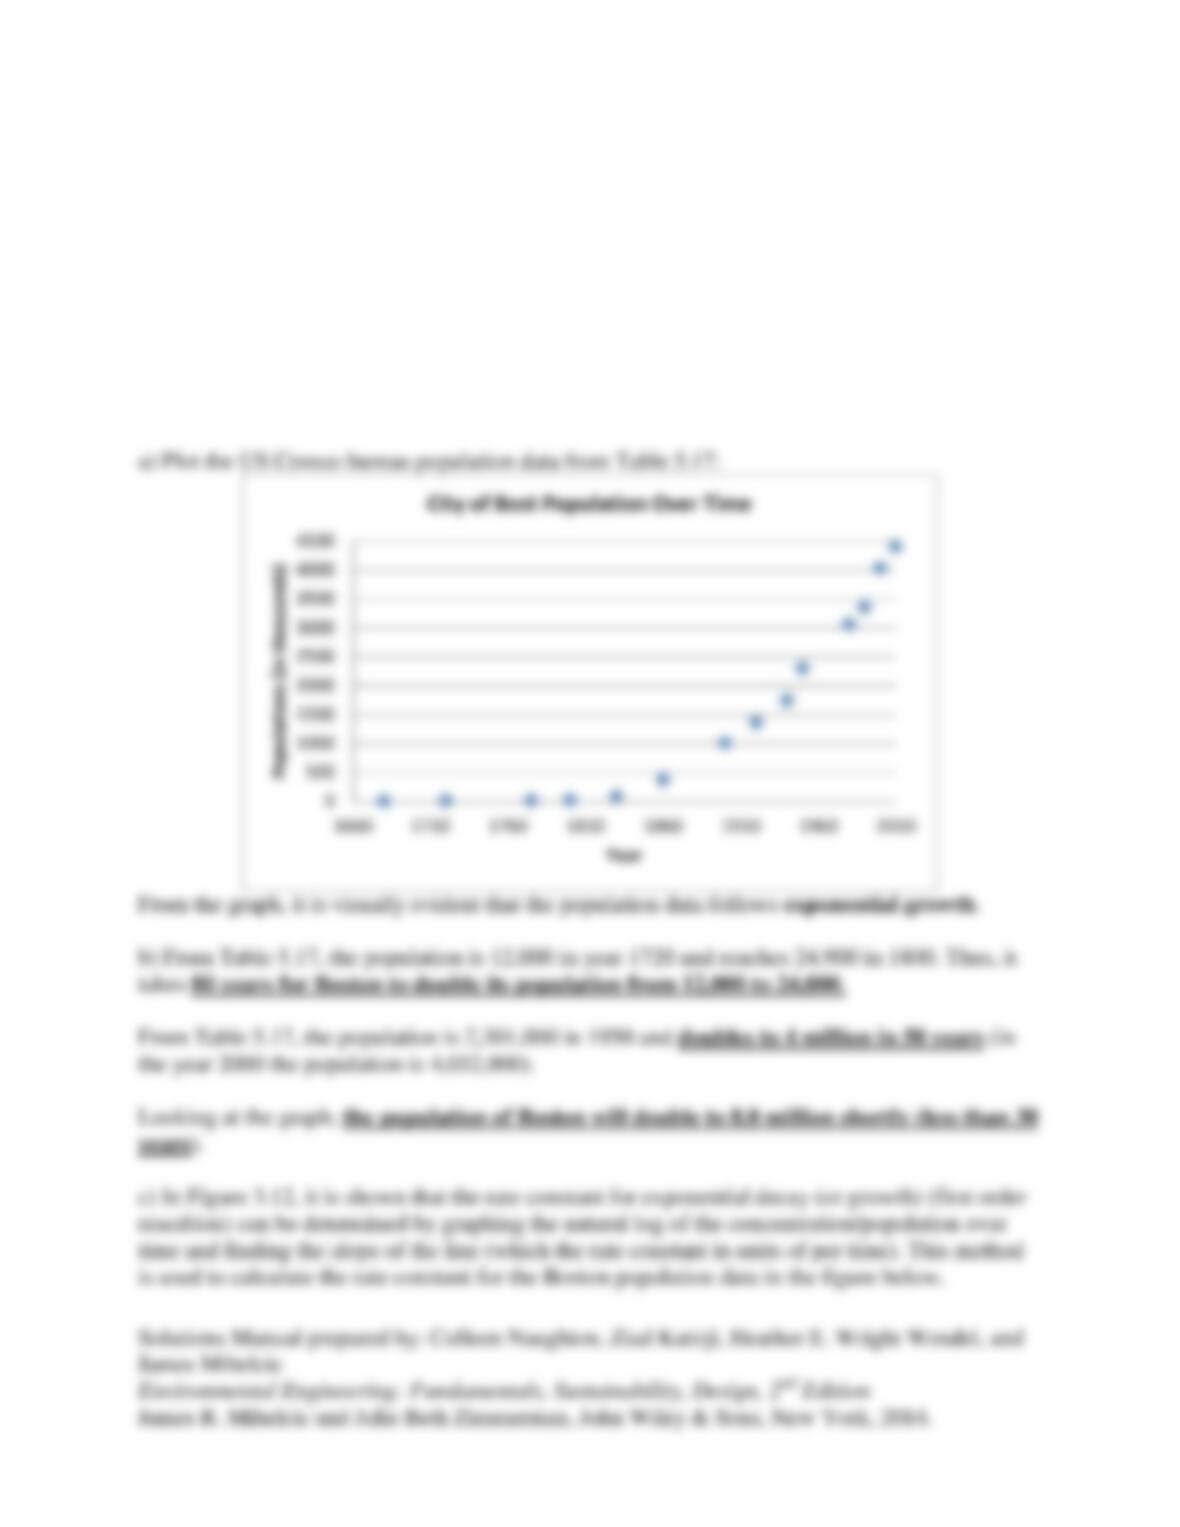
5.9 Table 5.17 provides the U.S. Census Bureau estimate of the population of the city of Boston
from 1680 to 2010.
Enter this data into a spreadsheet and make a graph of population over time. (a) Does the
population growth follow exponential or logistic growth? (b) How many years did it take for
Boston to double its population from 12,000 to 24,000 and from 2 million to 4 million? takes for
the population to double to 8.8 million? (c) Using you knowledge of half life from Chapter 3,
determine the rate constant for this population growth. Is the rate of growth changing over time?
If so, by how much in percent?
Solution:
From the graph, it is visually evident that the population data follows exponential growth.
b) From Table 5.17, the population is 12,000 in year 1720 and reaches 24,900 in 1800. Thus, it
takes 80 years for Boston to double its population from 12,000 to 24,000.
From Table 5.17, the population is 2,301,000 in 1950 and doubles to 4 million in 50 years (in
the year 2000 the population is 4,032,000).
Looking at the graph, the population of Boston will double to 8.8 million shortly (less than 30
years).
c) In Figure 3.12, it is shown that the rate constant for exponential decay (or growth) (first order
reacdtion) can be determined by graphing the natural log of the concentration/population over
time and finding the slope of the line (which the rate constant in units of per time). This method
is used to calculate the rate constant for the Boston population data in the figure below.
0
500
1000
1500
2000
2500
3000
3500
4000
4500
1660 1710 1760 1810 1860 1910 1960 2010
Populations (in thousands)
Year
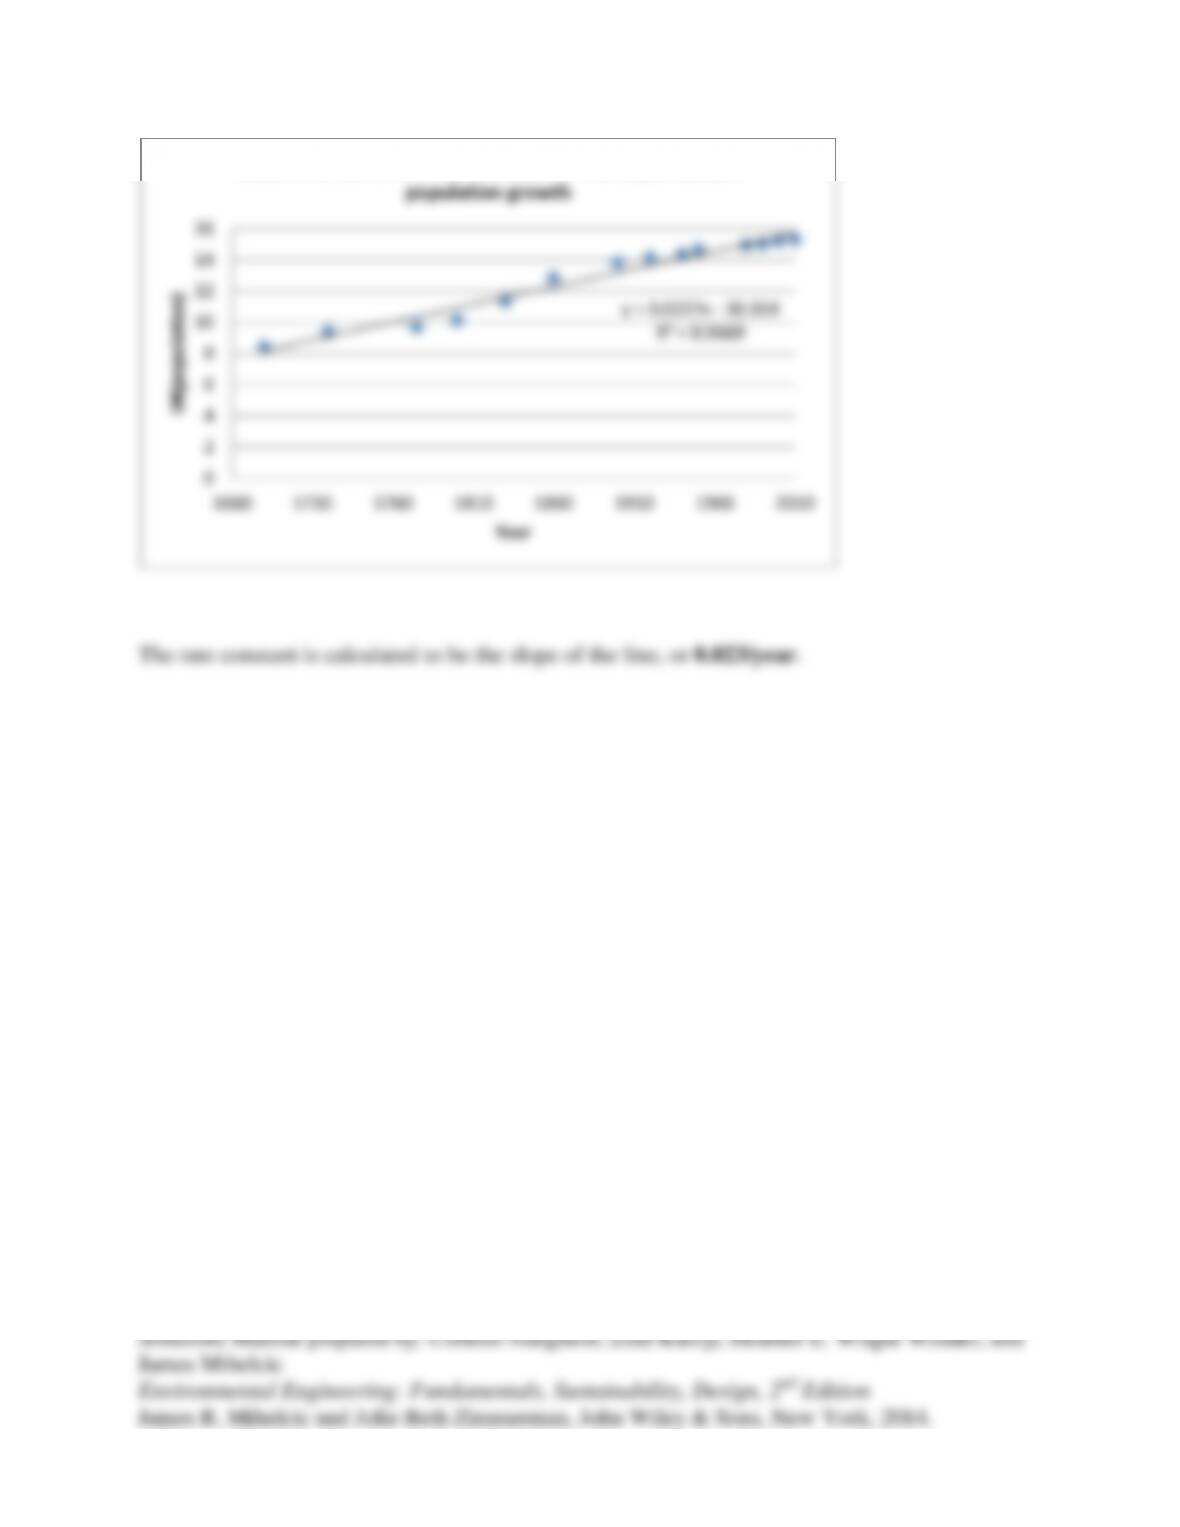
The rate constant is calculated to be the slope of the line, or 0.023/year.
y = 0.0227x – 30.014
R² = 0.9669
0
2
4
6
8
10
12
14
16
1660 1710 1760 1810 1860 1910 1960 2010
LN(population)
Year
Determination of the rate constant for the city of Boston
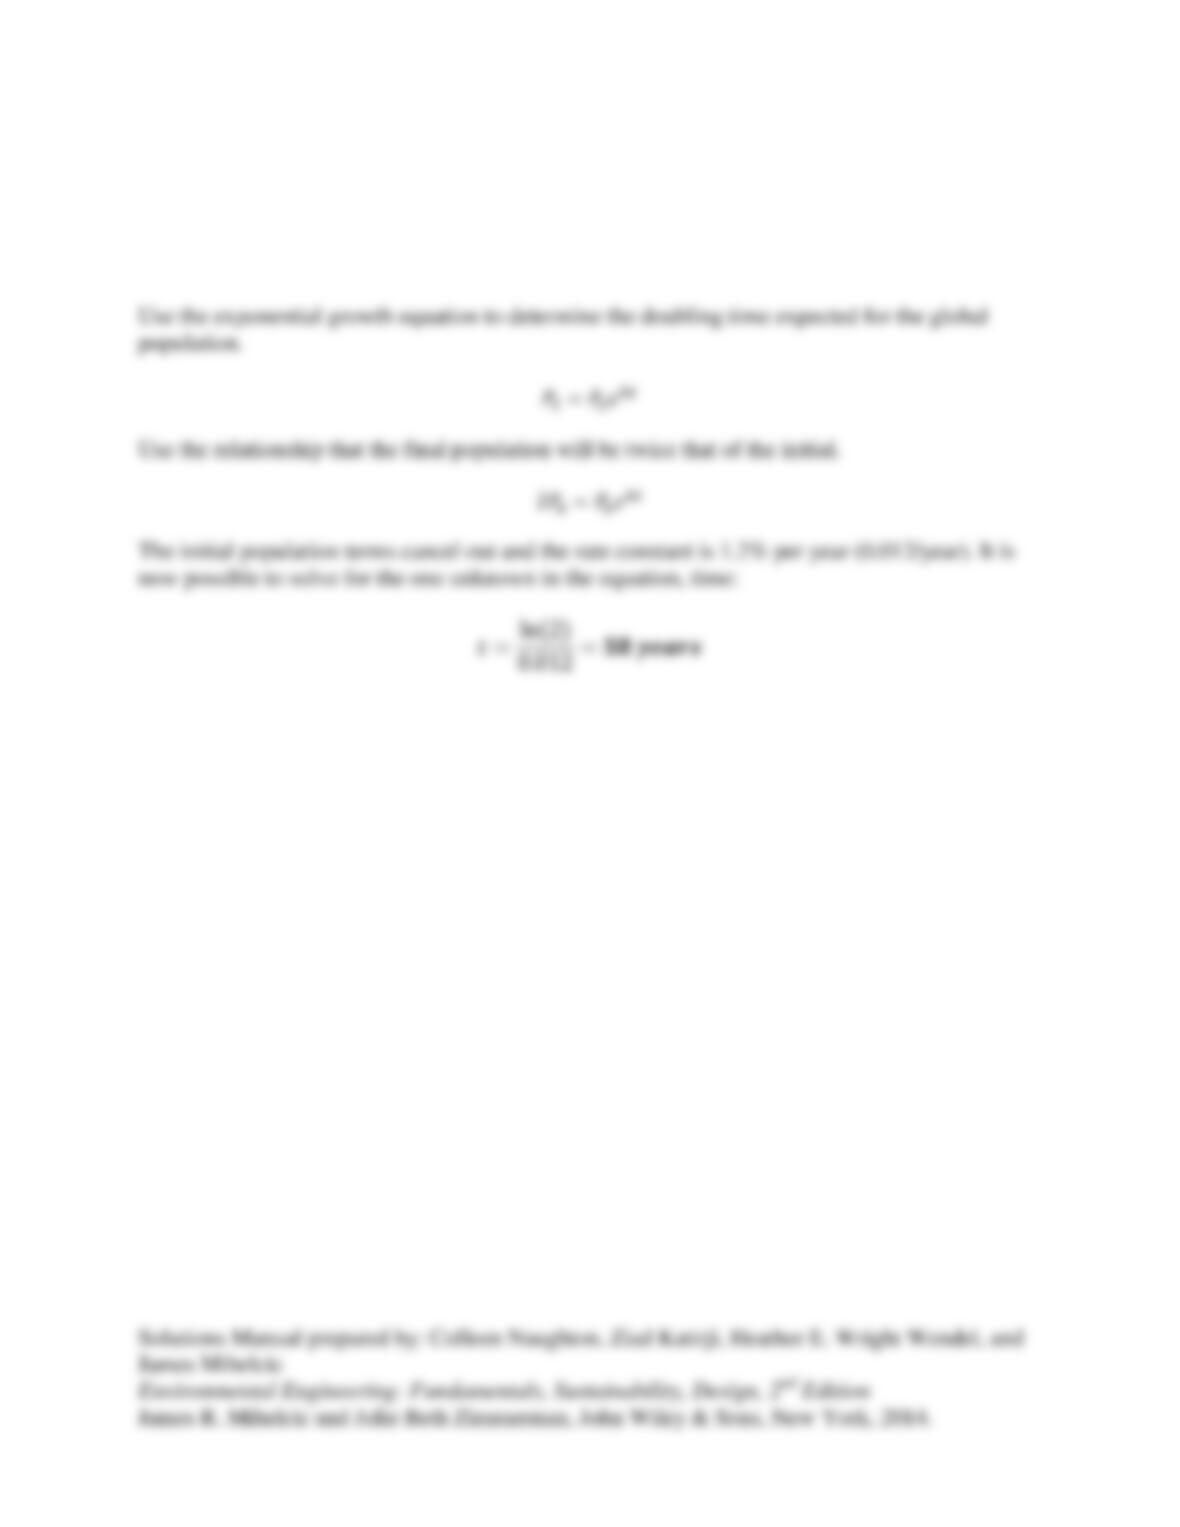
5.10 This chapter described that in 2007 the average rate growth of the global population was
1.2 percent per year (page 201 above Figure 5.12). Determine the doubling time expected for
the global population using this information
Solution:
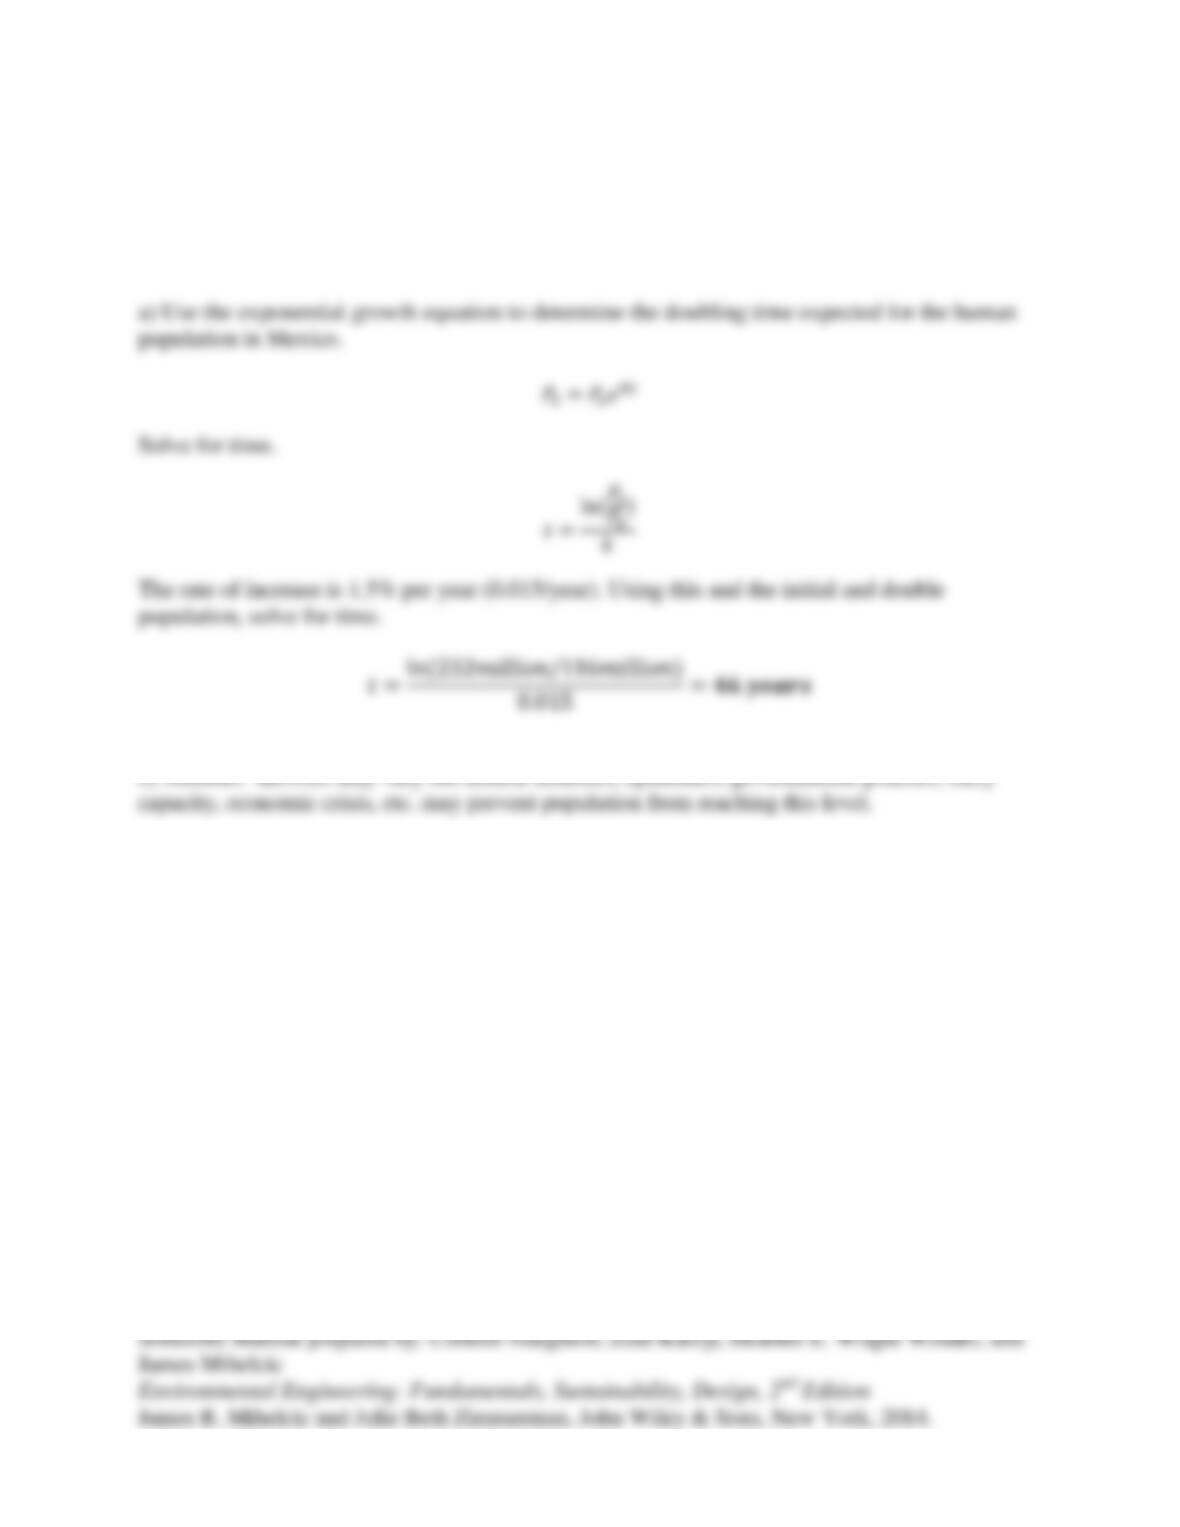
5.11 The rate of increase for the human population in Mexico was 1.5 percent. (a) How long
would you expect their population to double from its current level of 116 million people to 232
million in 2058? (b) What might prevent the population from reaching this level?
Solution:
b) Students’ answers may vary but natural disasters, epidemics, governmental policies, carry
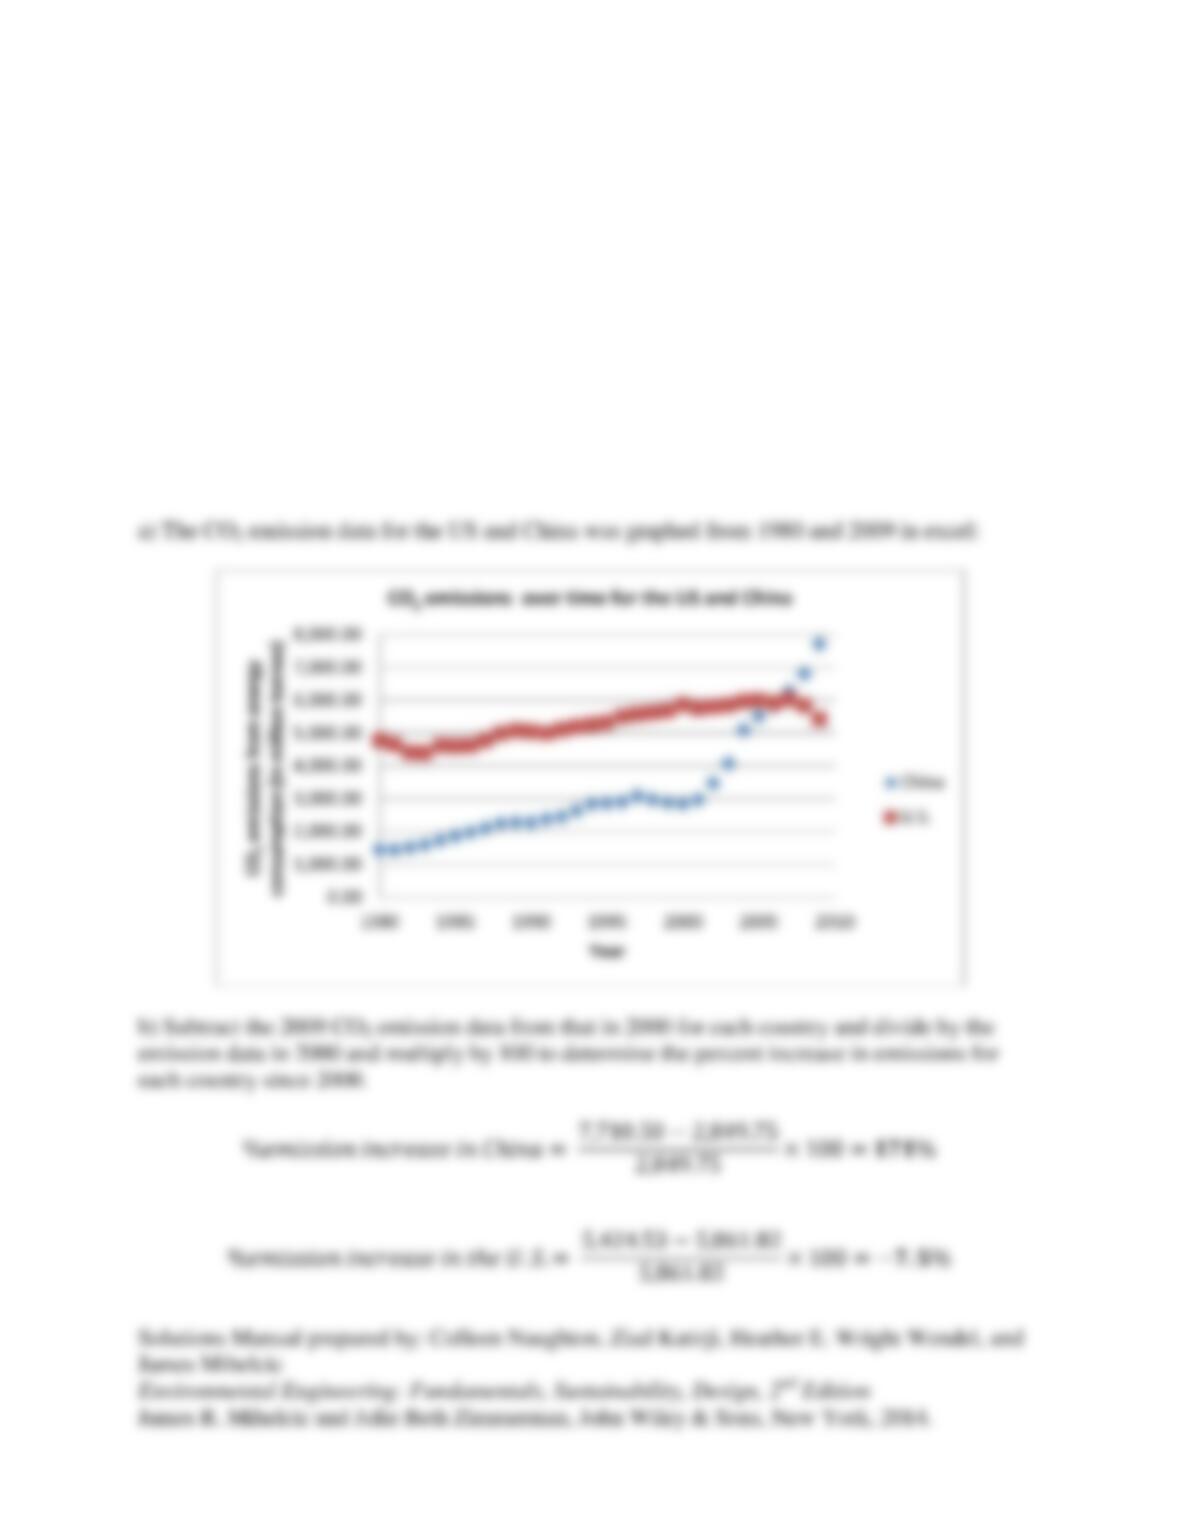
5.12 China and the U.S. were the top two producers of CO2 emissions associated with energy
consumption in 2009. Table 5.18 provides data of CO2 emissions from energy consumption (in
million tonnes) by the U.S. and China from 1980-2009 (data from the Energy Information
Administration). (a) Enter this data into a spreadsheet and make a graph of CO2 emissions from
1980 to 2009 for these two countries. (b) What is the percent increase in emissions for each
country since 2000? (c) in a half of page, discuss how technology efficiency, price of fossil
fuels, and growth of the economy would have impacted U.S. CO2 emissions in 2008 and 2009?
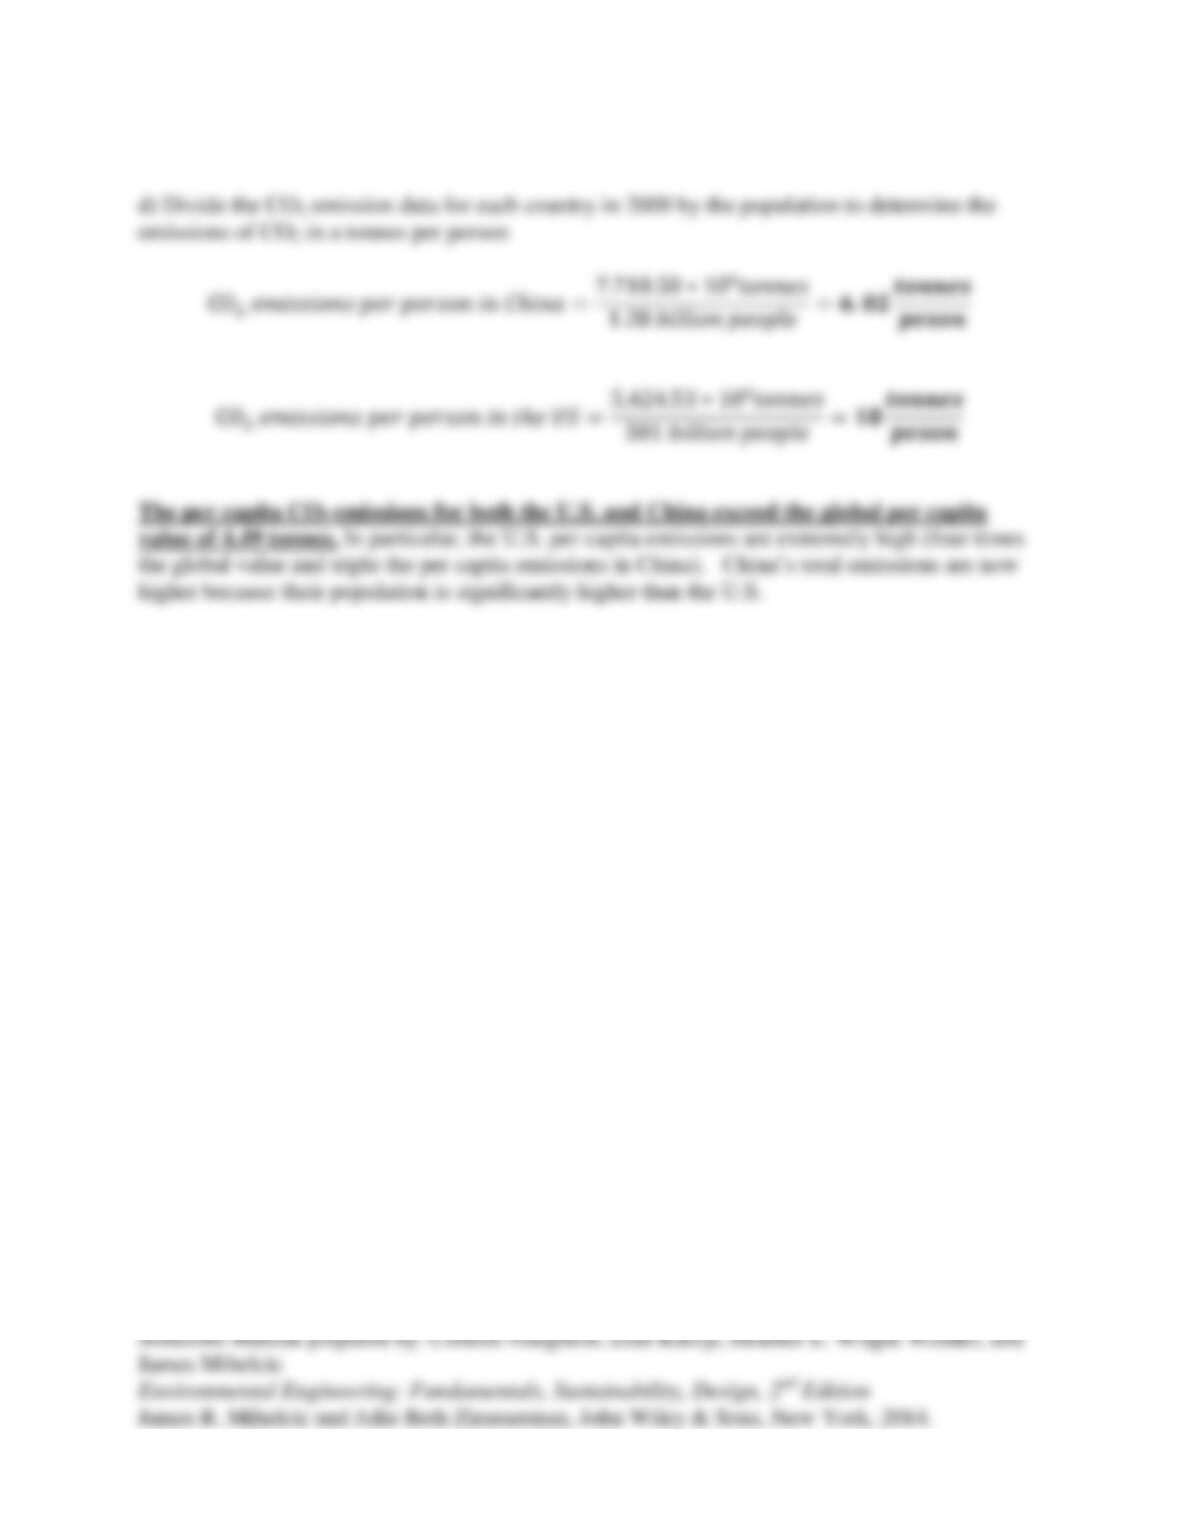
(d) If the population of China was approximately 1.28 billion and the population of the U.S.,
was approximately 301 million people, what was their emissions of CO2 on a tonnes per person
basis? Compare your results to the 2009 global value of 4.49 tonnes of CO2 per person.
Solution:
b) Subtract the 2009 CO2 emission data from that in 2000 for each country and divide by the
emission data in 2000 and multiply by 100 to determine the percent increase in emissions for
each country since 2000.
%𝑒𝑚𝑖𝑠𝑠𝑖𝑜𝑛 𝑖𝑛𝑐𝑟𝑒𝑎𝑠𝑒 𝑖𝑛 𝐶ℎ𝑖𝑛𝑎 = 7,710.50 −2,849.75
2,849.75 ×100 =𝟏𝟕𝟏%
%𝑒𝑚𝑖𝑠𝑠𝑖𝑜𝑛 𝑖𝑛𝑐𝑟𝑒𝑎𝑠𝑒 𝑖𝑛 𝑡ℎ𝑒 𝑈.𝑆. = 5,424.53 −5,861.82
5,861.82 ×100 =−𝟕.𝟓%
0.00
1,000.00
2,000.00
1980 1985 1990 1995 2000 2005 2010
CO2 emissions from energy
consumption (in million tonnes)
Year
c) Students’ answers may vary
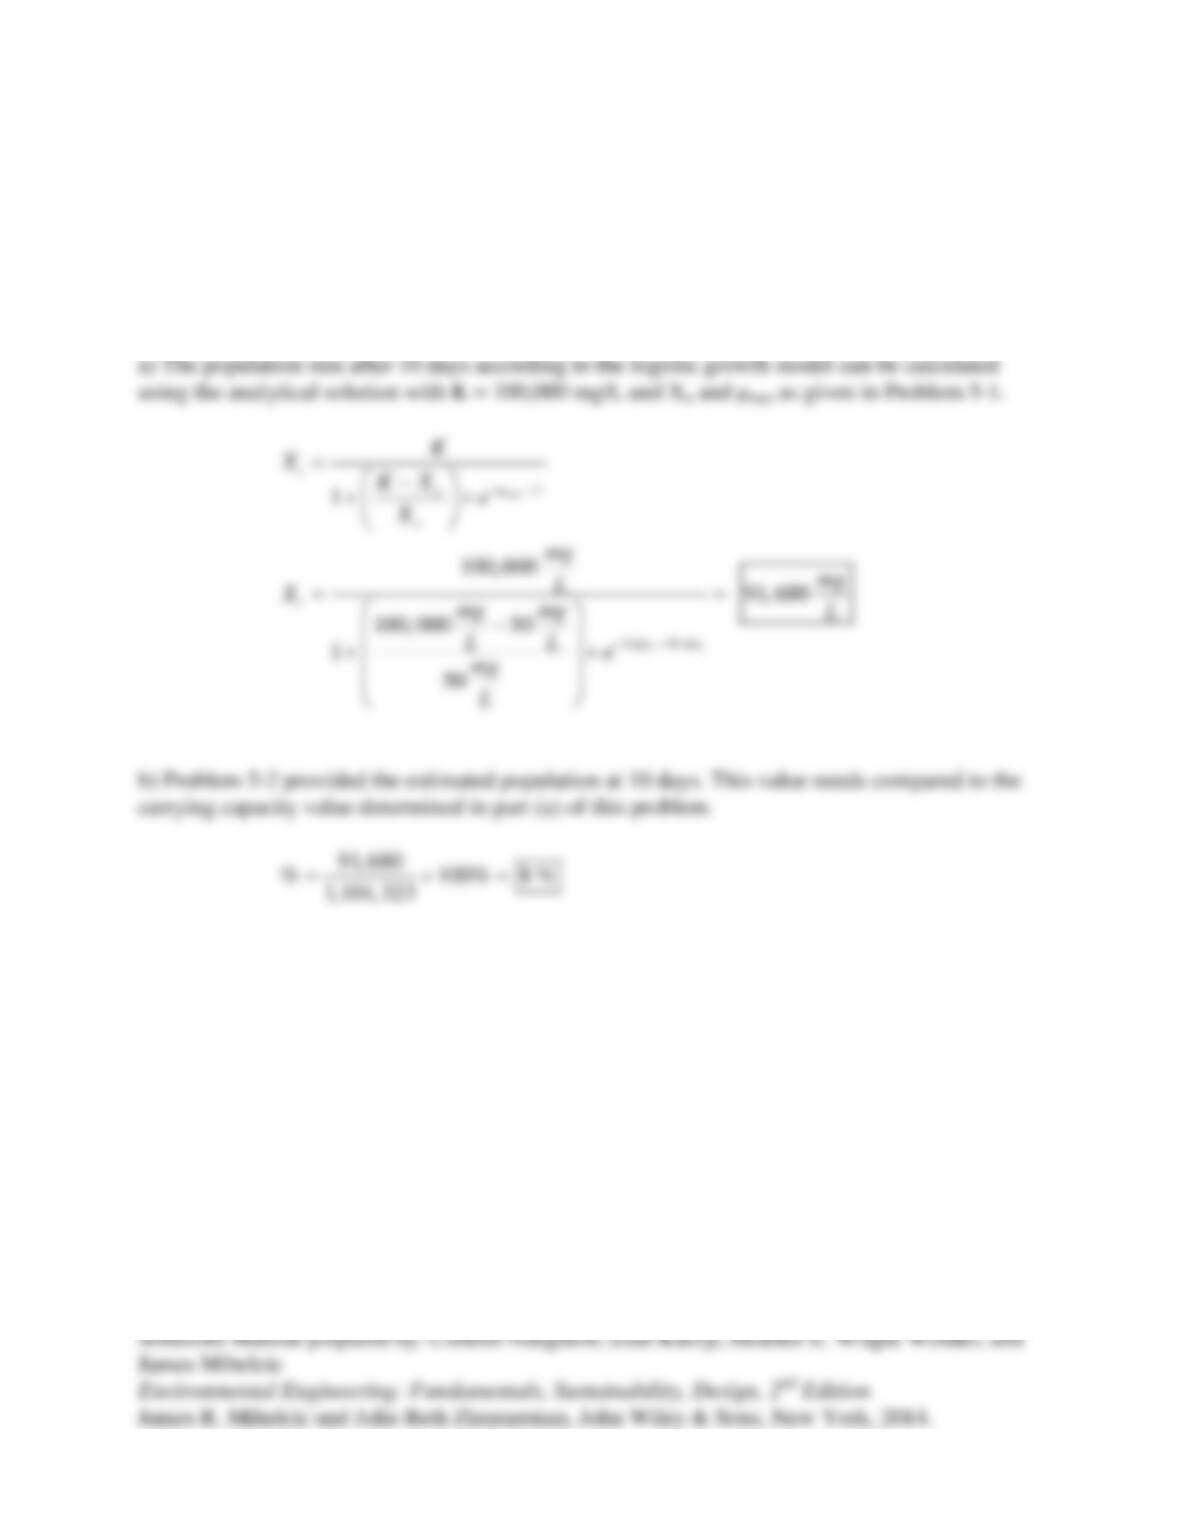
5.13 Exponential growth cannot be sustained forever because of constraints placed on the
organism by its environment, that is, the system’s carrying capacity. This phenomenon is
described using the logistic growth model. (a) Calculate the size of the population in Problem 5-1
after 10 days, assuming that logistic growth is followed and that the carrying capacity is 100,000
mg/L. (b) What percentage of the exponentially growing population size would this be?
Solution:
5.14 As reported by Mihelcic et al. (2009) “water demand is a function of the design population,
minimum personal water requirements, and factors such as seasonal activities and infrastructural
demands (e.g., from schools, churches, and clinics). Design population (PN) is the projected
population in the last year of the design life.” It can be calculated as follows:
for populations < 2,000
1100
×
=+
NO
rN
PP
or
for populations > 2,000
1100
=+
N
NO
r
PP
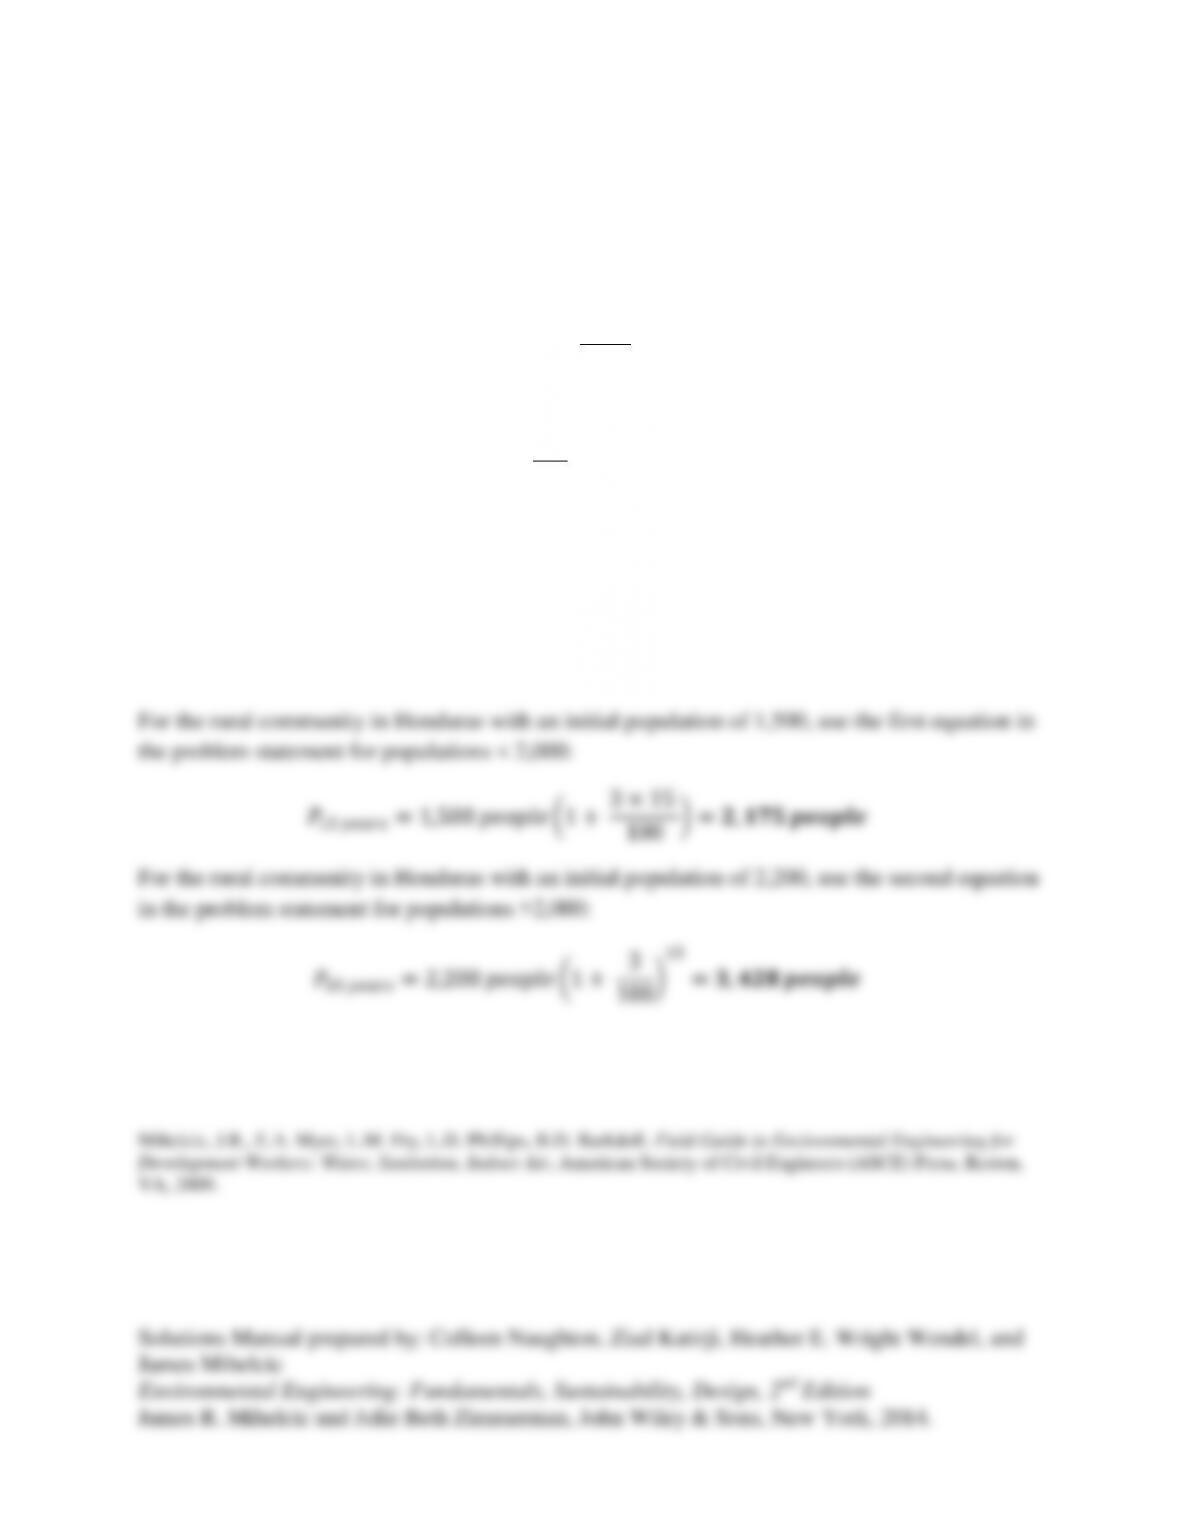
Assume two rural communities in Honduras have initial populations of 1,500 and 2,200
respectively. If you are designing a water system with an expected life of 15 years (N), and the
percentage rate of growth is expected to be 3%, what is the community size you would design for
in 15 years for each community?
Solution:
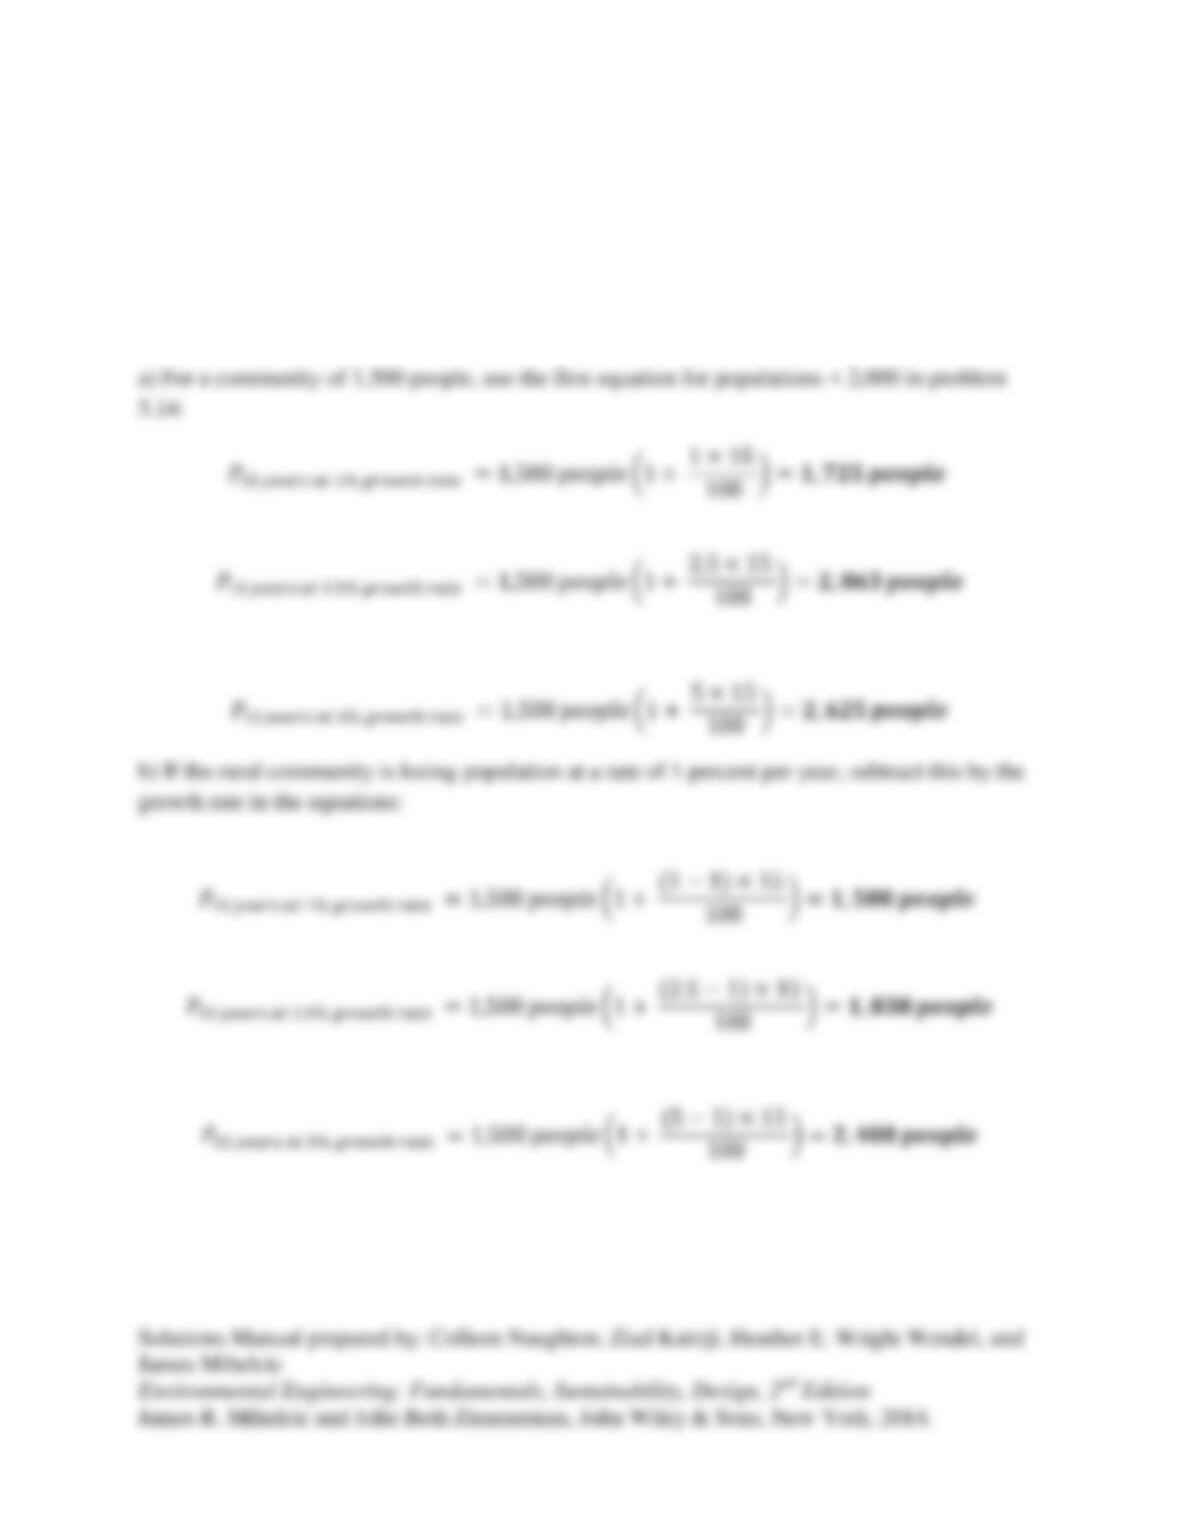
5.15 Using information provided in Problem 5.14., (a) determine the expected population for
the community of 1,500 people after 15 years for estimated population rate of growths of 1, 2.5,
and 5 percent. (b) Assume this rural community is losing population at a rate of 1 percent per
year because of the global phenomenon of rural migration to urban areas. What is the expected
population of the community in 15 years?
Solution:
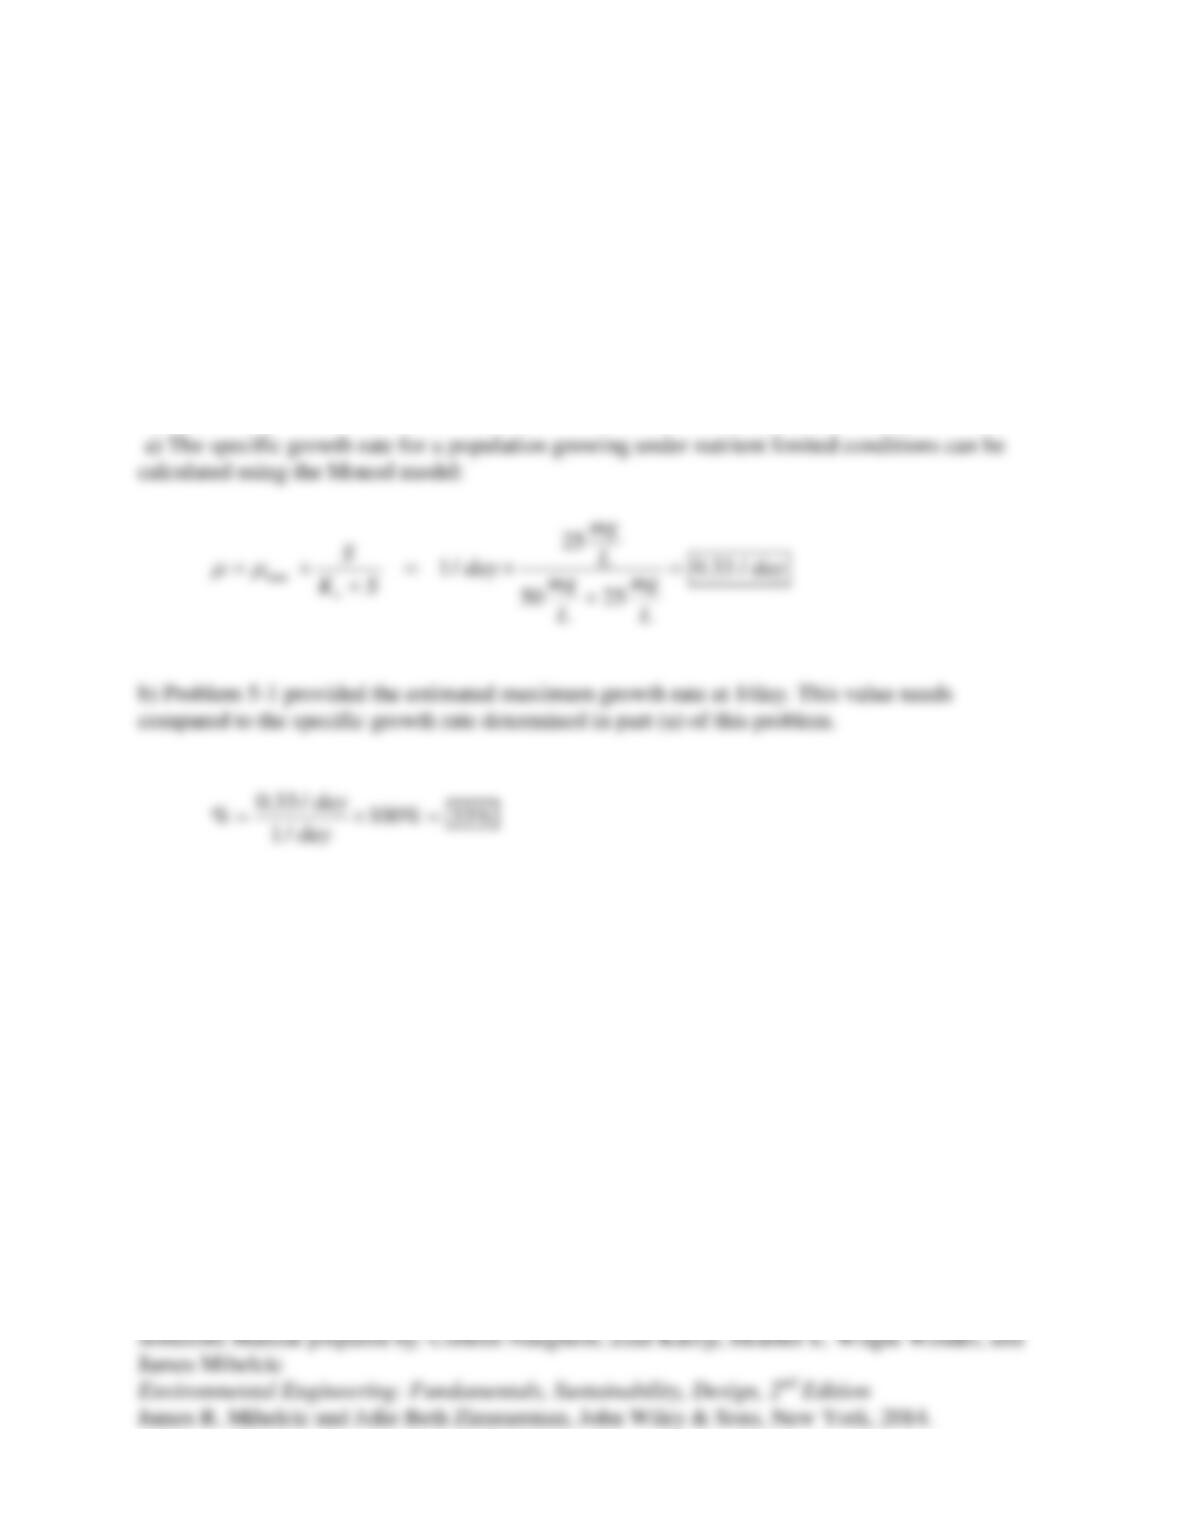
5.16 Food limitation of population growth is described using the Monod model. Population
growth is characterized by the maximum specific growth rate (
max
μ
) and the half-saturation
constant for growth (Ks). (a) Calculate the specific growth rate (
μ
) of the population in Problem
5.5 growing at a substrate concentration of 25 mg/L according to Monod kinetics if it has a Ks of
50 mg/L. (b) What percentage of the maximum growth rate for the exponentially growing
population size would this be?
Solution:
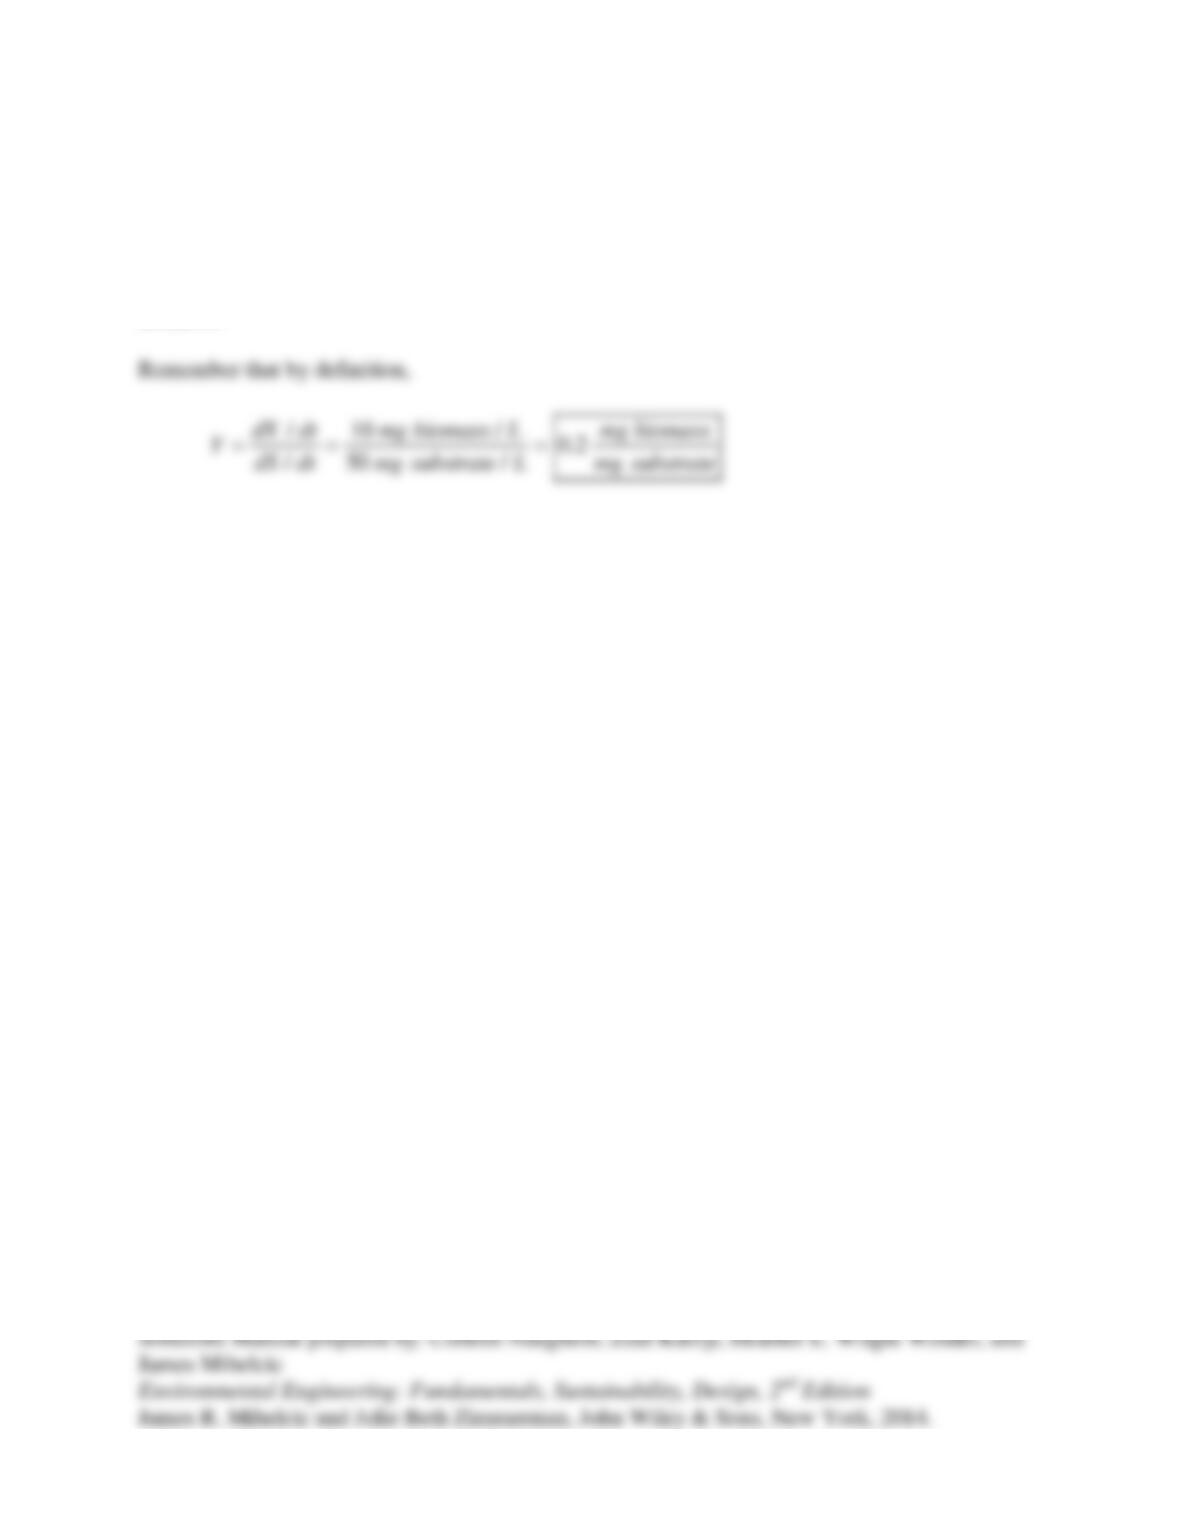
5.17 Laboratory studies have shown that microorganisms produce 10 mg/L of biomass in
reducing the concentration of a pollutant by 50 mg/L. Calculate the yield coefficient, specifying
the units of expression.
Solution:
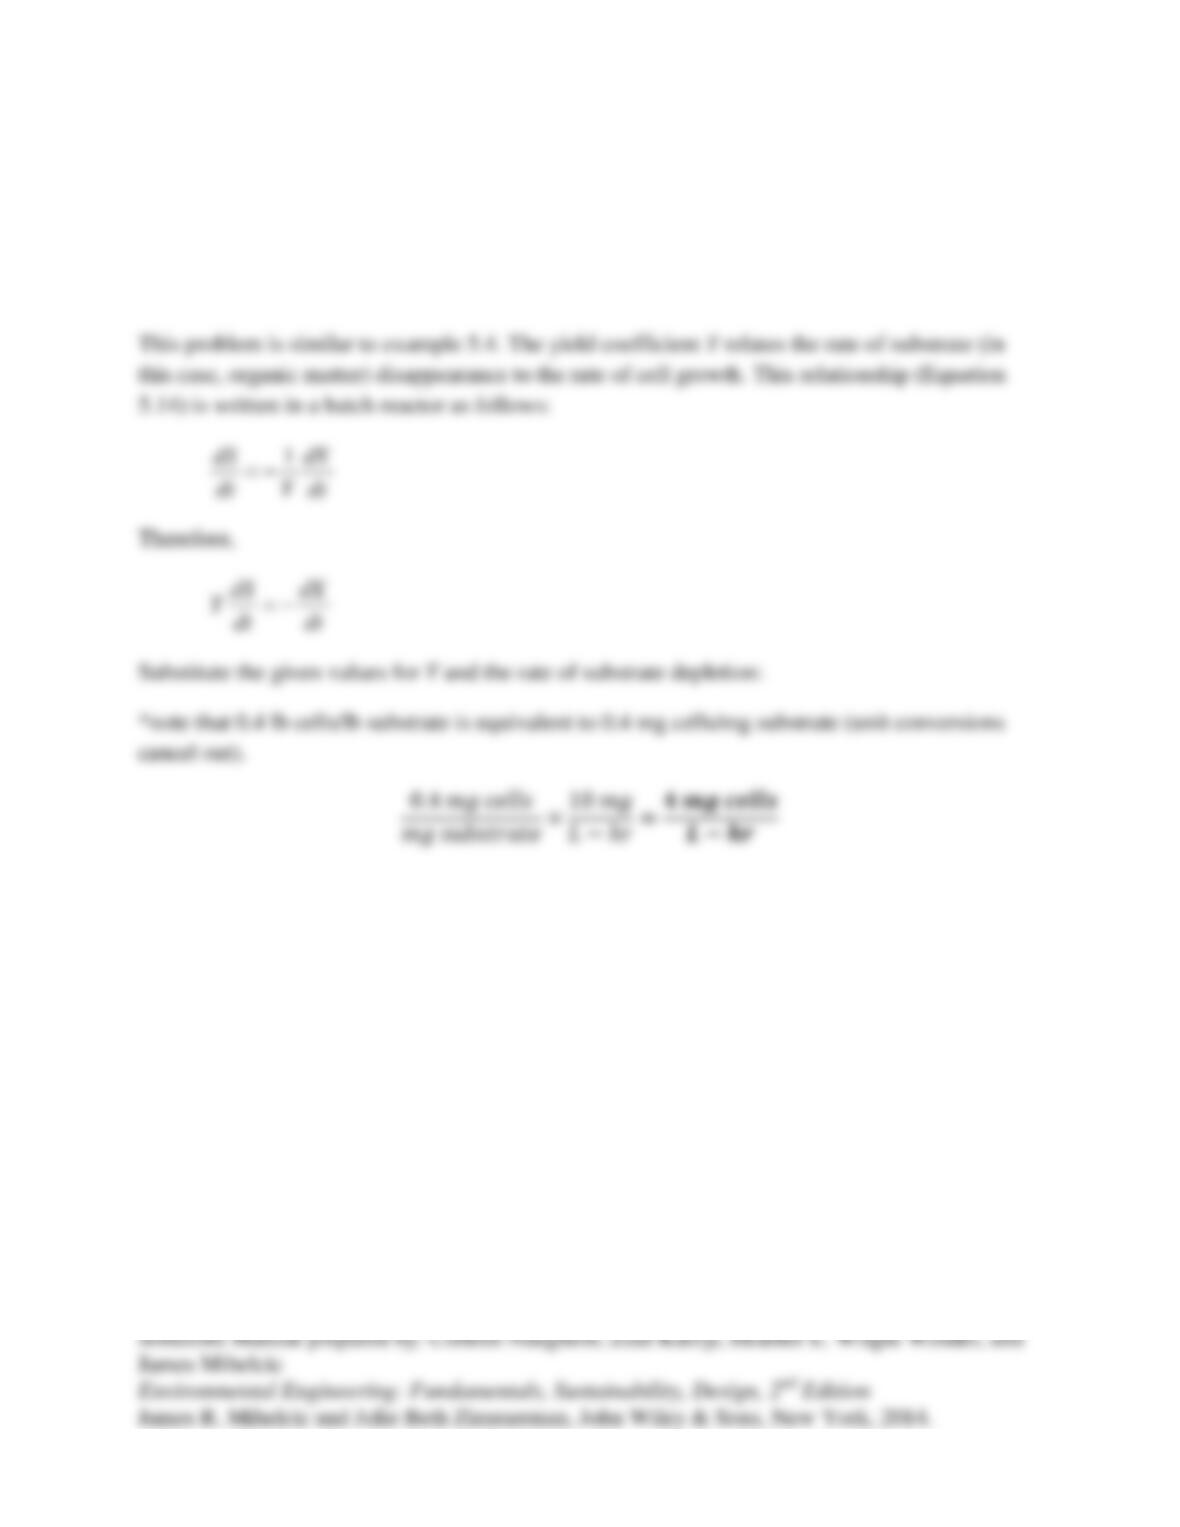
5.18 An pilot scale facility maintained under aerobic conditions has monitored the rate of
removal of pollutant as 10 mg/L-hour. What is the rate of growth of the microorganisms
oxidizing the pollutant (mg cells/L-hour) if their yield coefficient is reported to equal 0.40 lb
cells/lb substrate?
Solution: