Unlock document.
This document is partially blurred.
Unlock all pages and 1 million more documents.
Get Access
Chapter 10. Solid Waste Management
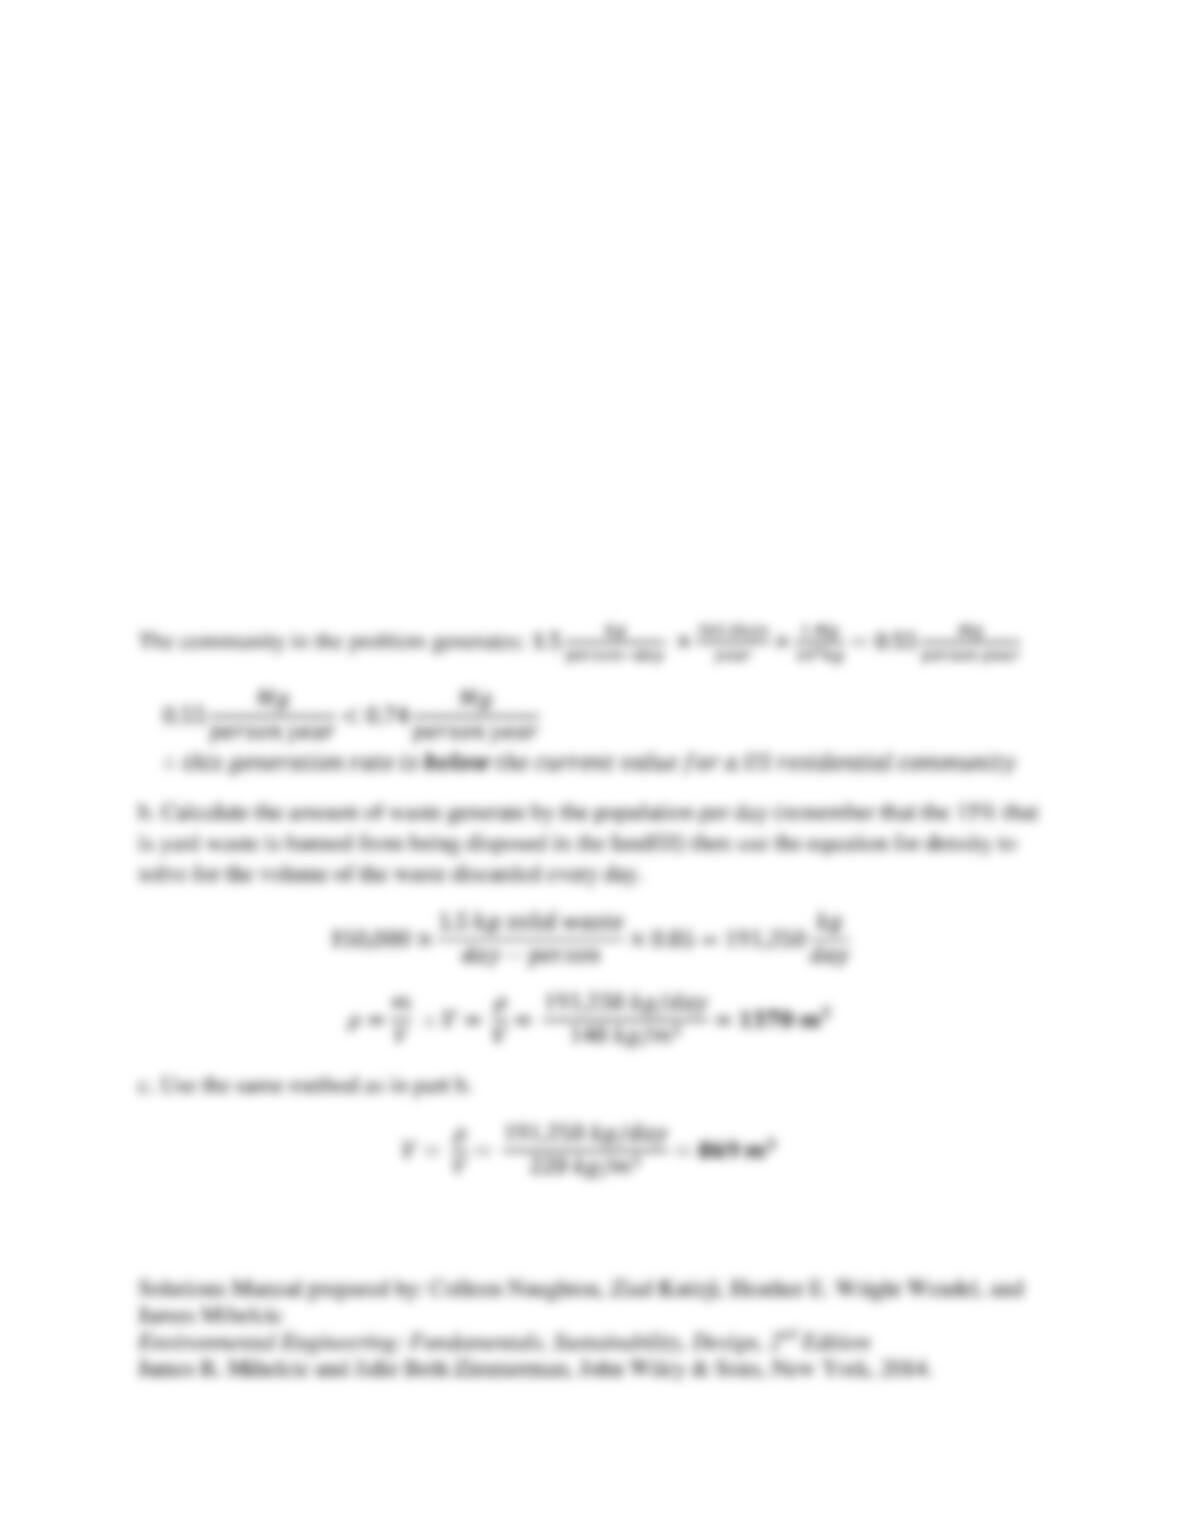
10.1 A community with a population of 150,000 has a solid waste generation rate of 1.5 kg solid
waste/day-person. Assume that yard waste makes up 15% of the total waste generated (by
weight) and yard waste is banned by the state from being disposed of in a landfill, therefore, the
community has set up a program to collect and compost yard waste. Assume the density of the
loose solid waste is 140 kg/m3 at the curb, is compacted to 340 kg/m3 in the truck that collects
the waste at the home, and is 220 kg/m3 after the material is removed from the compacter truck
at the landfill. (a) is this generation rate above or below the current value for a U.S. residential
community? (b) What is the volume of waste that is discarded every day by the community at the
source (m3)? (c) What is the volume of waste that will removed from the compacter truck at the
landfill (m3)?
Solution:
a. From Table 10.2, 0.74 Mg of waste is generated per person per year in 2010.
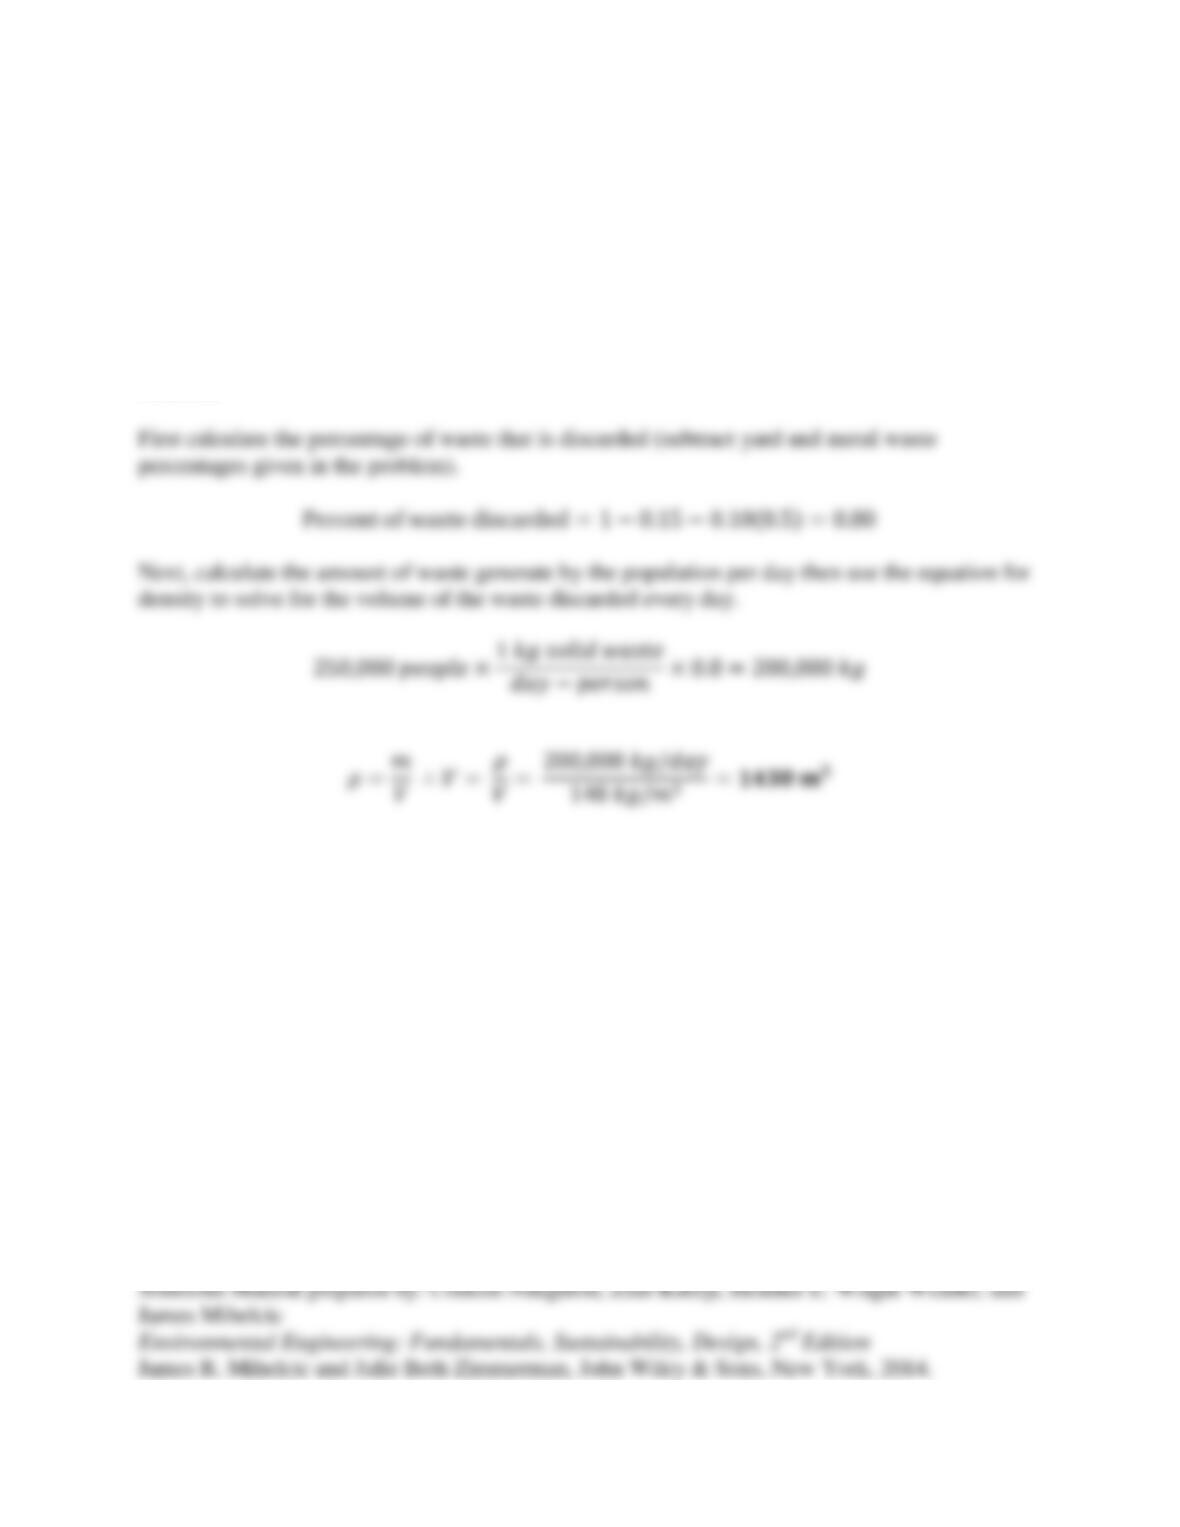
10.2 A new solid waste landfill site is being designed with a projected life of 10 years. The
landfill will serve a population of 250,000 that generates 1 kg solid waste/day-person. Assume
that yard waste makes up 15% of the total waste (by weight), paper makes up 40% of the total
waste (by weight), and metals make up 10% of the waste (by weight). The municipality bans the
placement of yardwaste in landfill and has a recycling program that collects one half of all
discarded metals. (a) What is the volume of waste that is discarded by the community every day
(assume a waste density at the curb of 140 kg/m3).
Solution:

10.3 Design and safely perform a waste characterization on the solid waste at your residence and
at an office at your university or college. (a) How does your waste characterization compare with
the data in Figure 10.2? (b) Which of the following pollution prevention strategies (source
reduction, reuse, recycle) would you implement to reduce the discard rate?
Solution:
Students’ responses will vary.

10.4 Identify one source of solid waste on your campus that could readily be reduced, one source
that could be reused, and one that could be recycled. What social, economic, and environmental
benefits would come from implementing a plan to deal with the three items you identified?
Solution:
Students’ responses will vary.

10.5 Research the energy and water savings associated with recycling 1,000 kg office paper.
Which value do you consider the most reliable of the ones you found? Justify your choice, and
provide a reference for your preferred source of information.
Solution:
Students’ responses will vary.
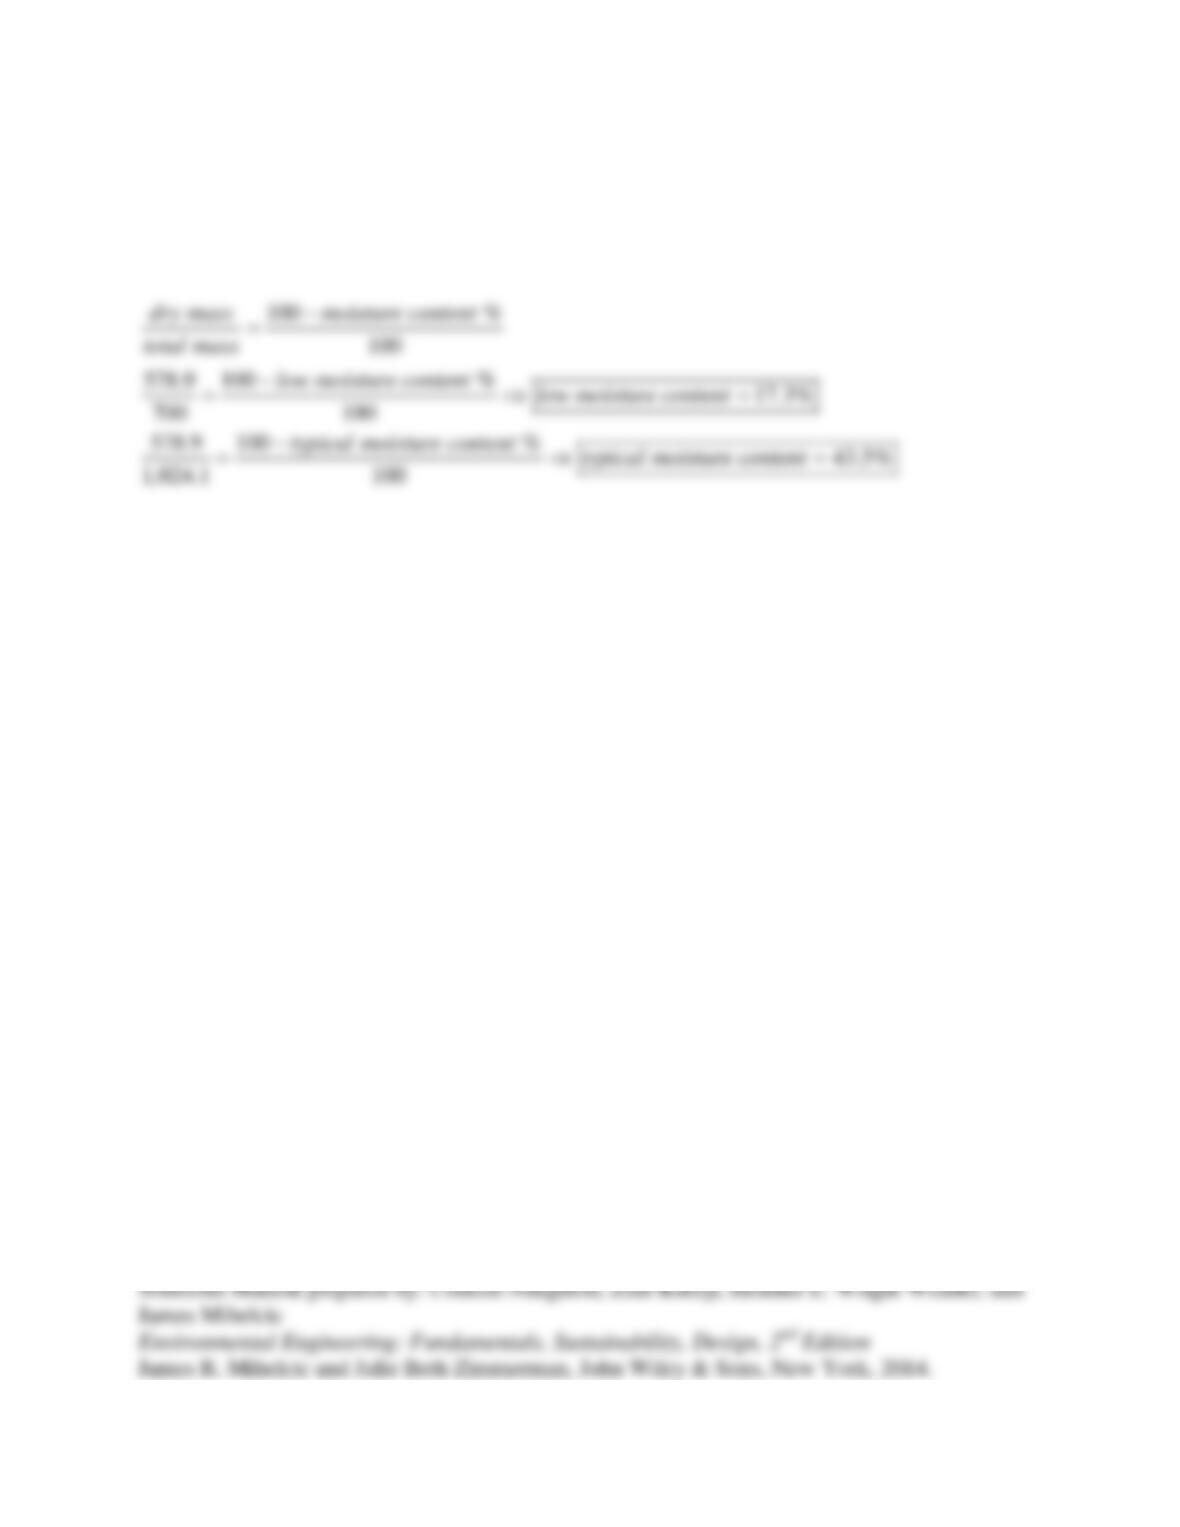
10.6 Using the values provided in Example 10.2, estimate the low moisture content and typical
moisture content for the waste as a whole.
Solution:
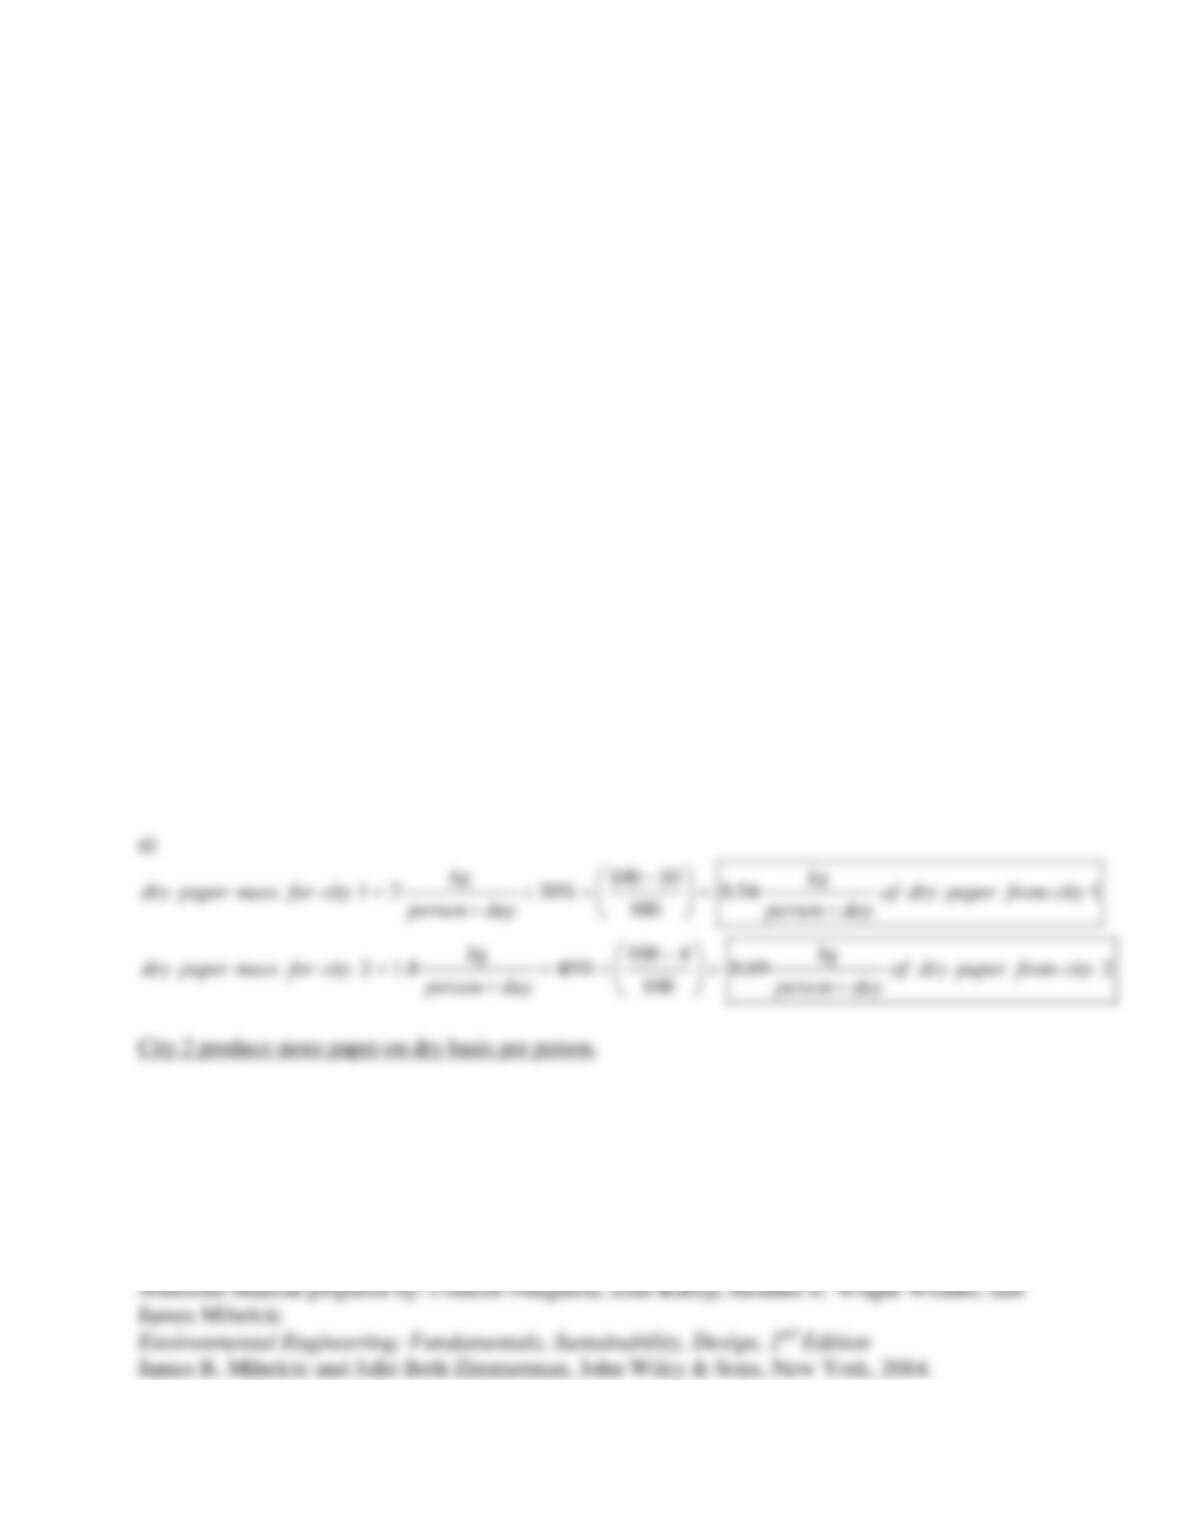
10.7 Waste composition has been measured for two cities. The results are summarized in Table
10.19.
.
City 1 City 2
Wet Weight Generation Rate
(kg/person-day) 2.0 1.8
Wet Weight Composition (%)
Food 15 10
Paper 30 40
Yard 20 15
Other 35 35
Moisture Content of Fractions (% on wet weight basis)
Food 80 50
Paper 10 4
Yard 80 30
Other 5 4
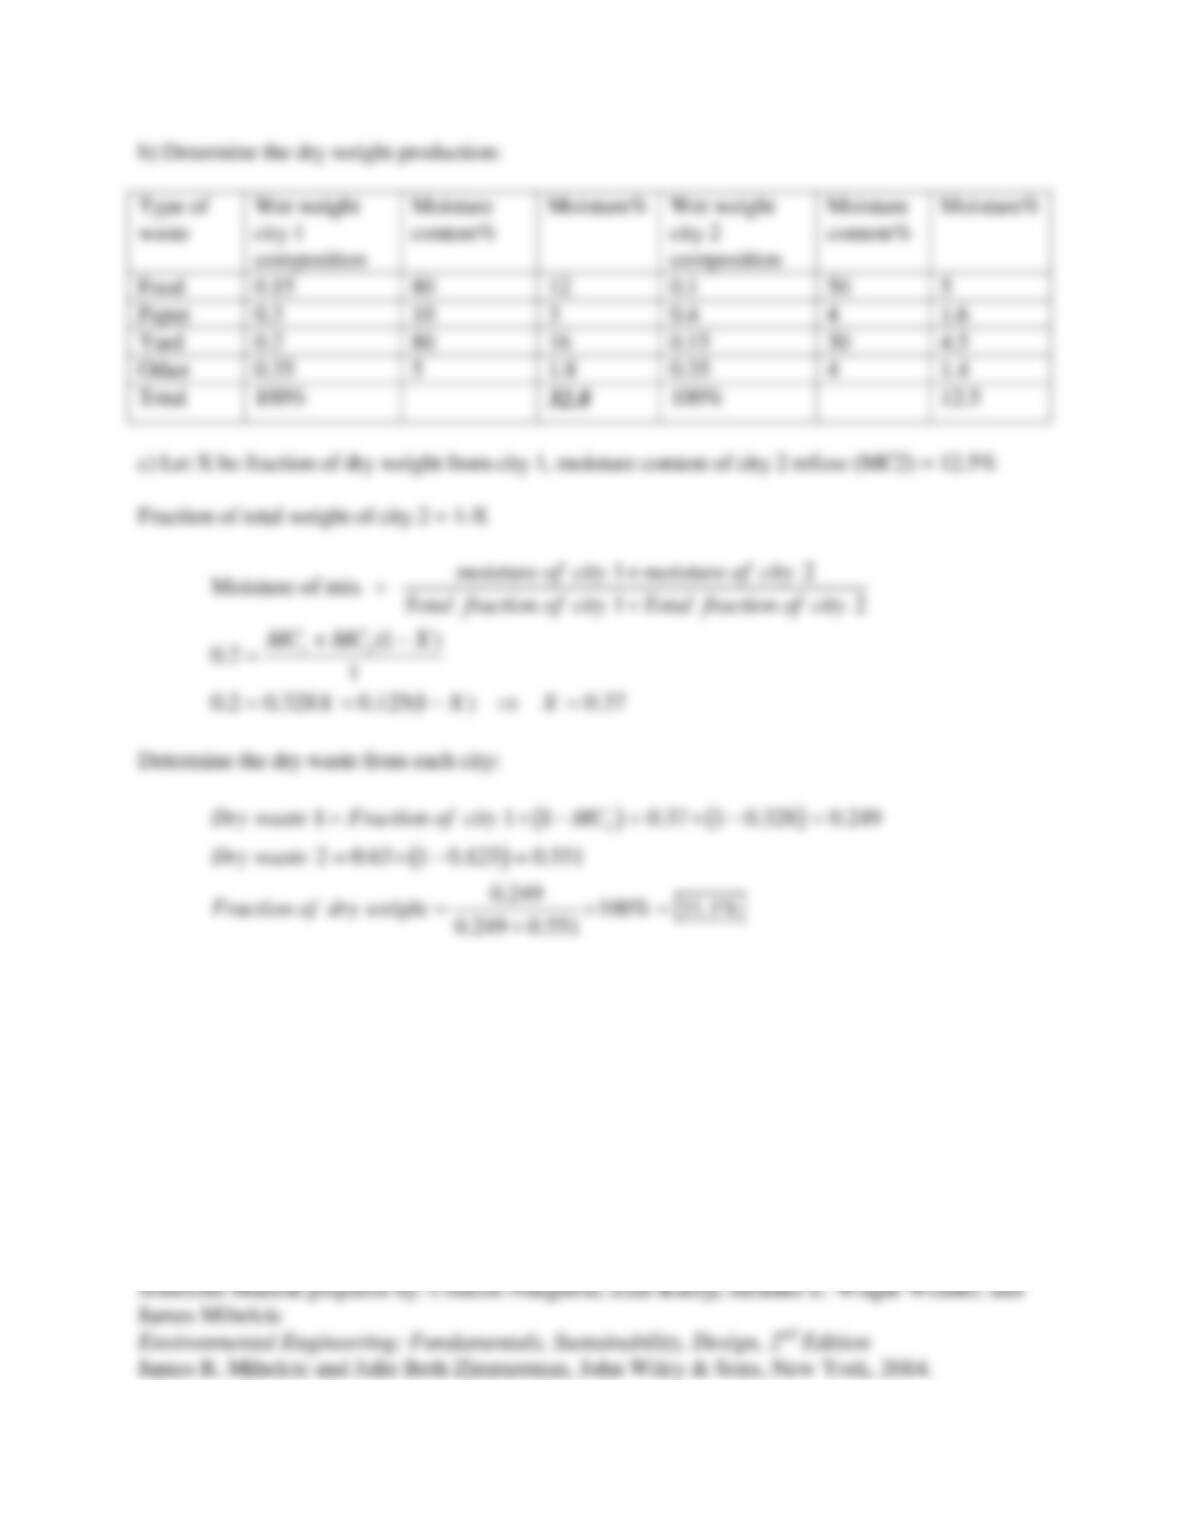
(a) Which city generates more paper on a dry weight basis? (b) Find the percent moisture (wet
weight basis) for city 1. (c) A nearby disposal site receives all of its MSW from cities 1 and 2.
The average moisture content for MSW disposed of at the site is 20percent. What fraction of the
dry weight refuse comes from city 1?
Solution:
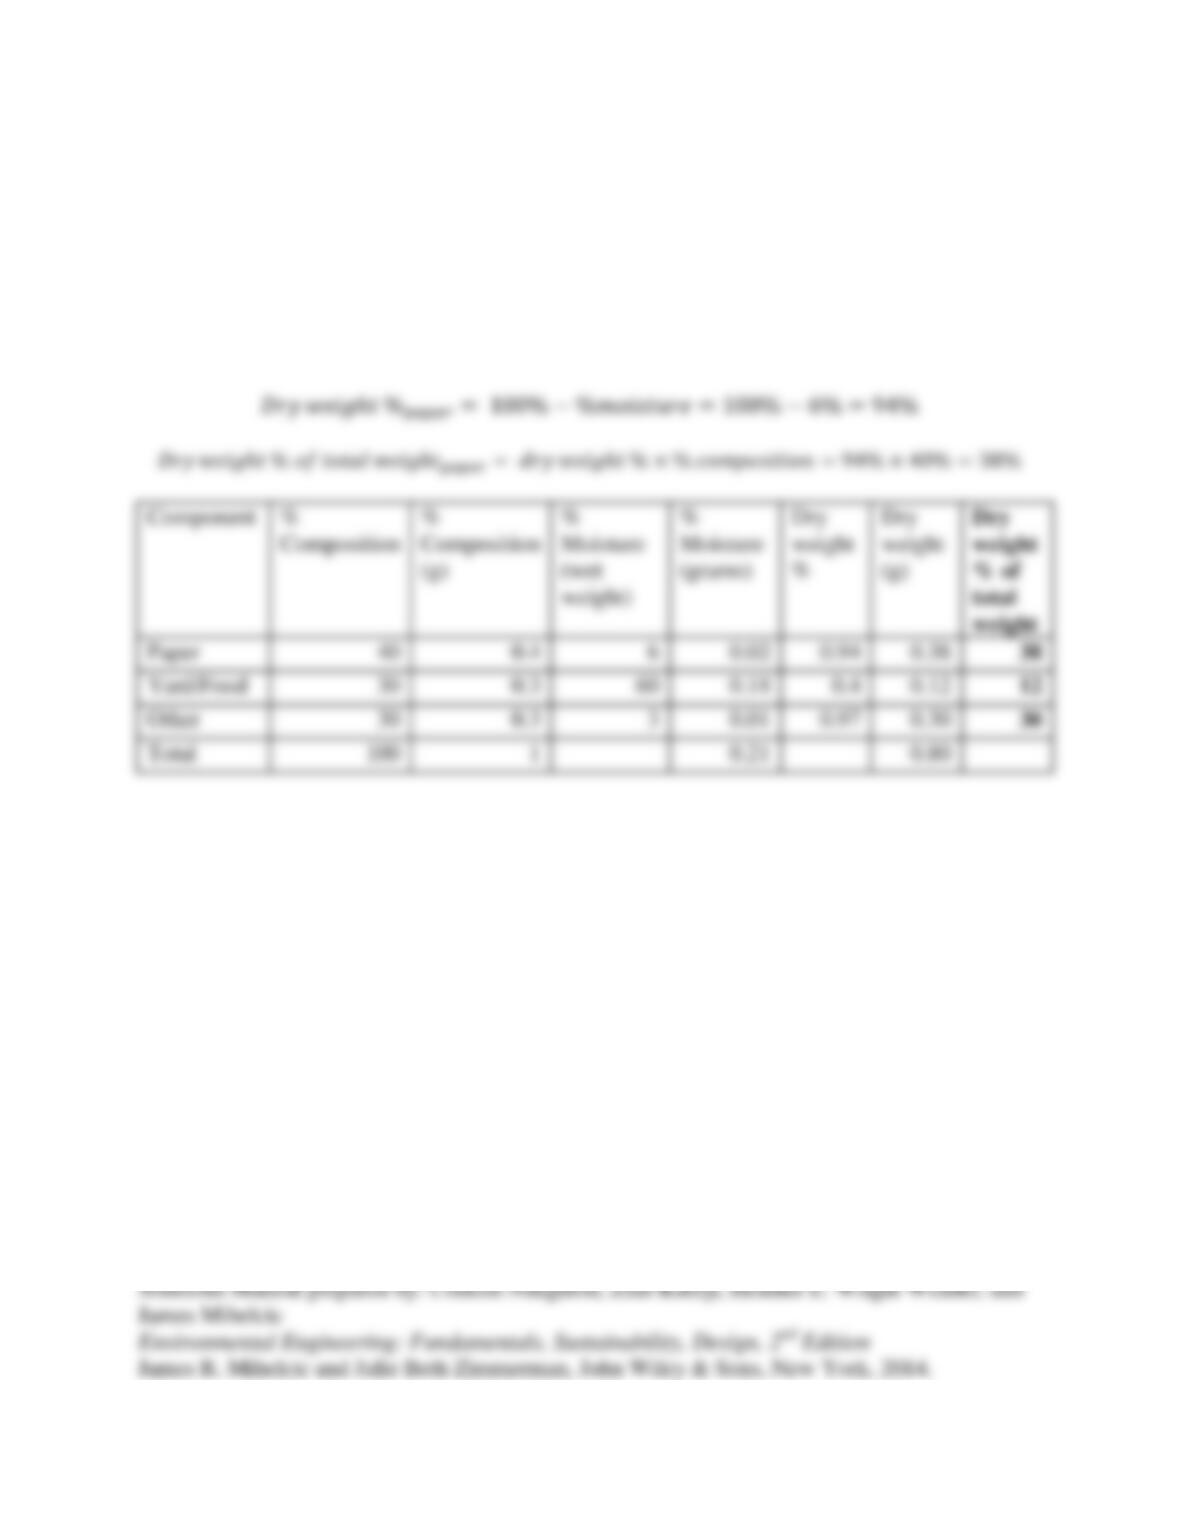
10.8 What is the dry weight percent composition for the following combined waste?
Component % Composition % Moisture (wet weight)
Paper 40 6
Yard/Food 30 60
Other 30 3
Solution:
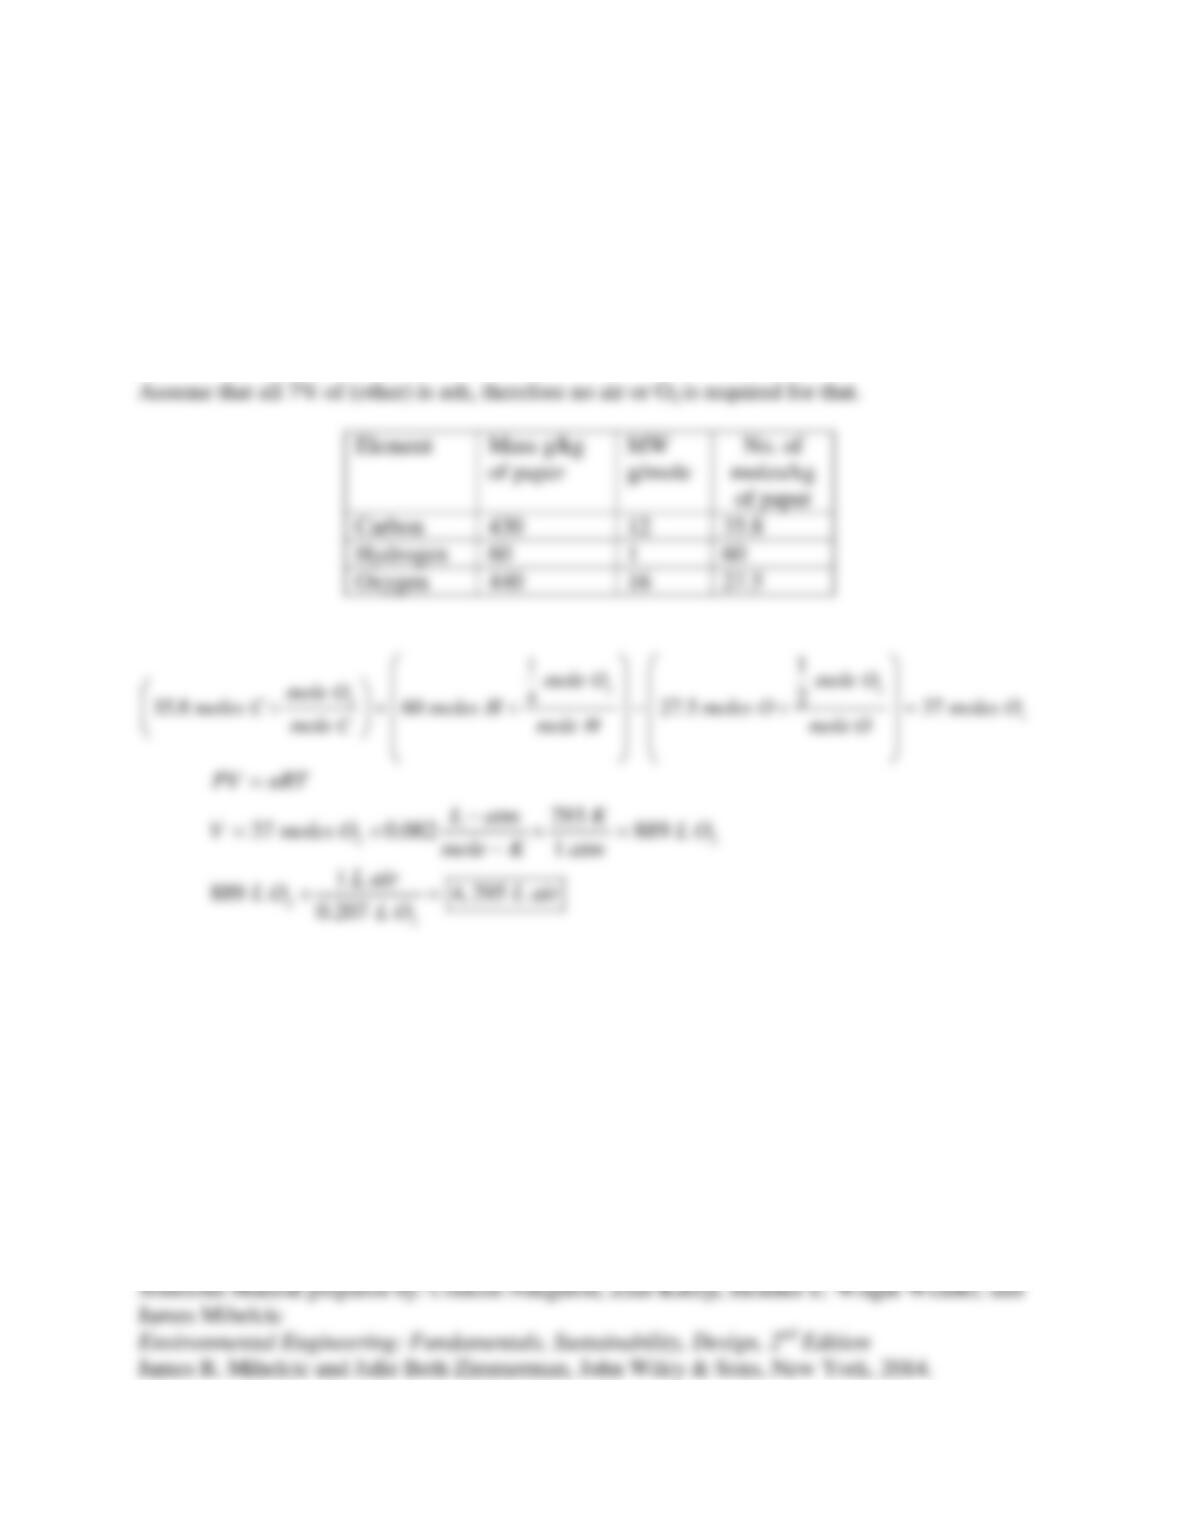
10.9 The mass composition of dry paper is 43 percent carbon, 6 percent hydrogen, 44 percent
oxygen, and 7 percent other. Estimate the liters of air required to burn 1 kg dry paper. Assume
carbon dioxide and water are the only products of combustion of carbon, hydrogen, and oxygen.
Assume a temperature of 20°C and pressure of 1 atm.
Solution:
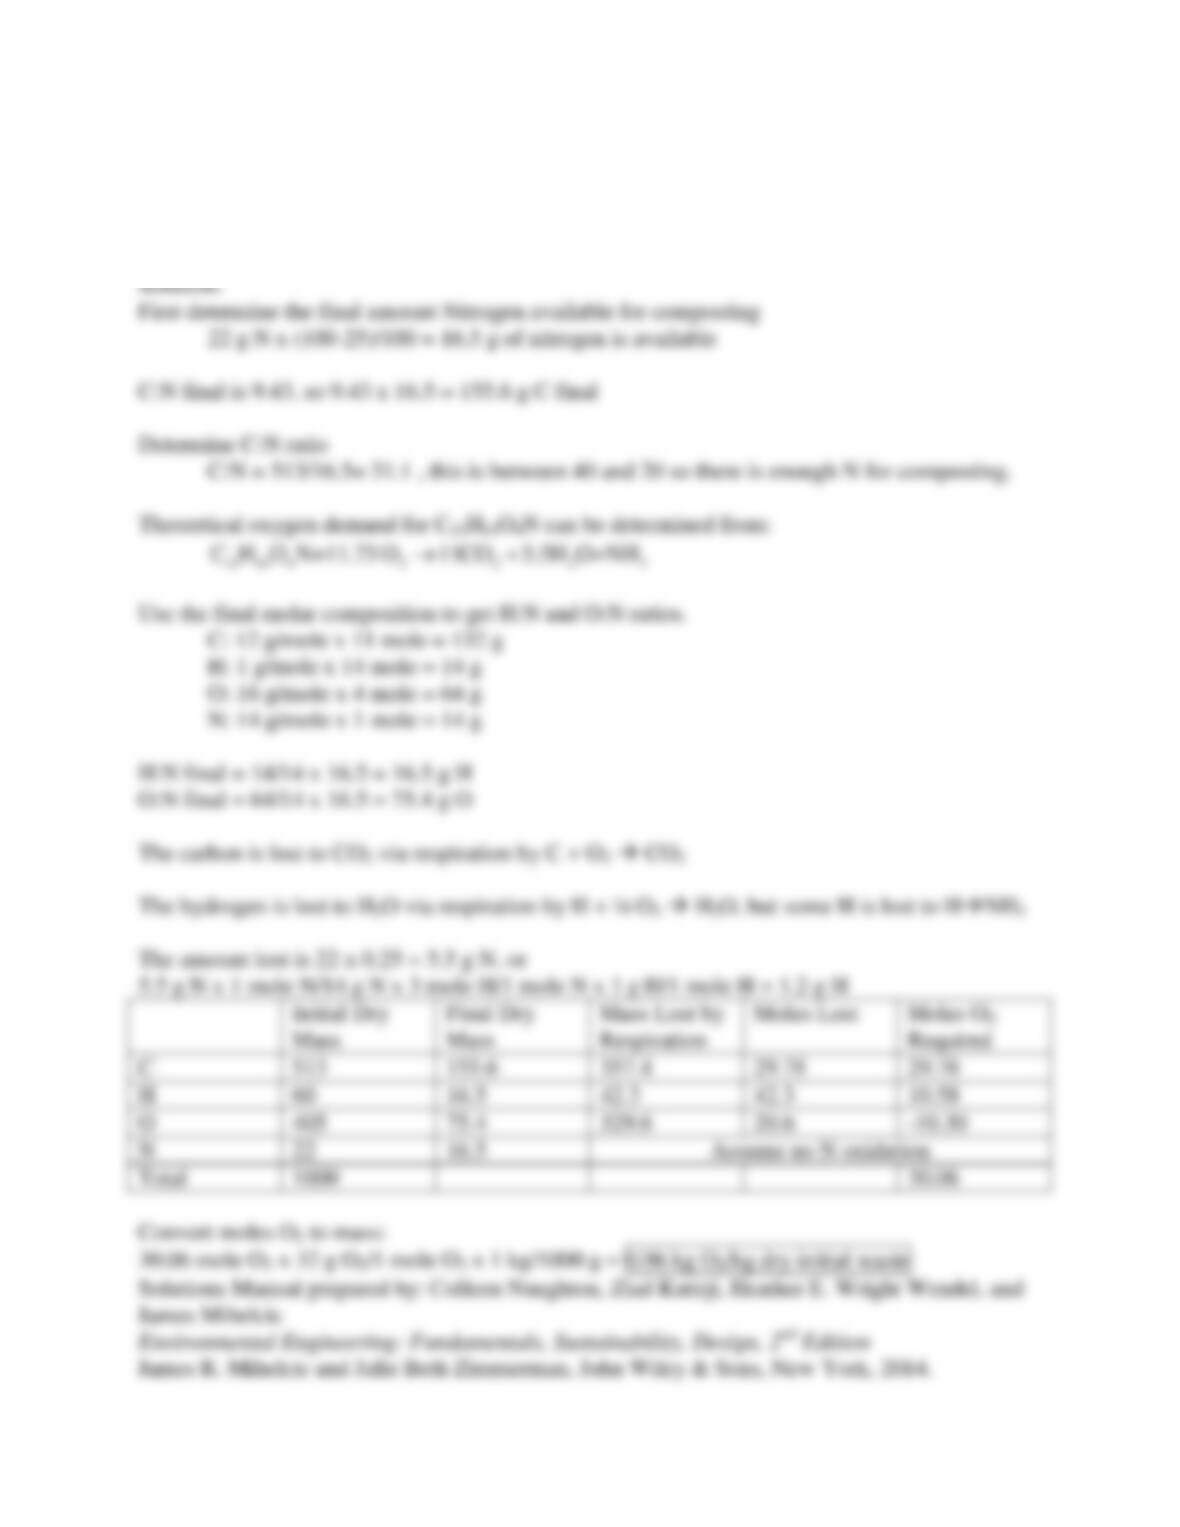
10.10 Estimate the oxygen demand for composting mixed garden waste (units of kg of O2
required per kg of dry raw waste). Assume 1,000 dry kg mixed garden waste has a composition
of 513 g C, 60 g H, 405 g O, and 22 g N. Assume 25 percent of the nitrogen is lost to NH3(g)
during composting. The final C:N ratio is 9.43. The final molecular composition is C11H14O4N.
10.11 Waste of the composition shown in the following table is disposed of at a rate of 100,000
Mg/yr for 2 yr in one section of a landfill. Assume that half of the waste is disposed of at time =
0.5 years, and half at a time of 1.5 yr. Assume that gas production follows the first-order
relationship used in Equation 10.4, and use the additional information provided in the table. How
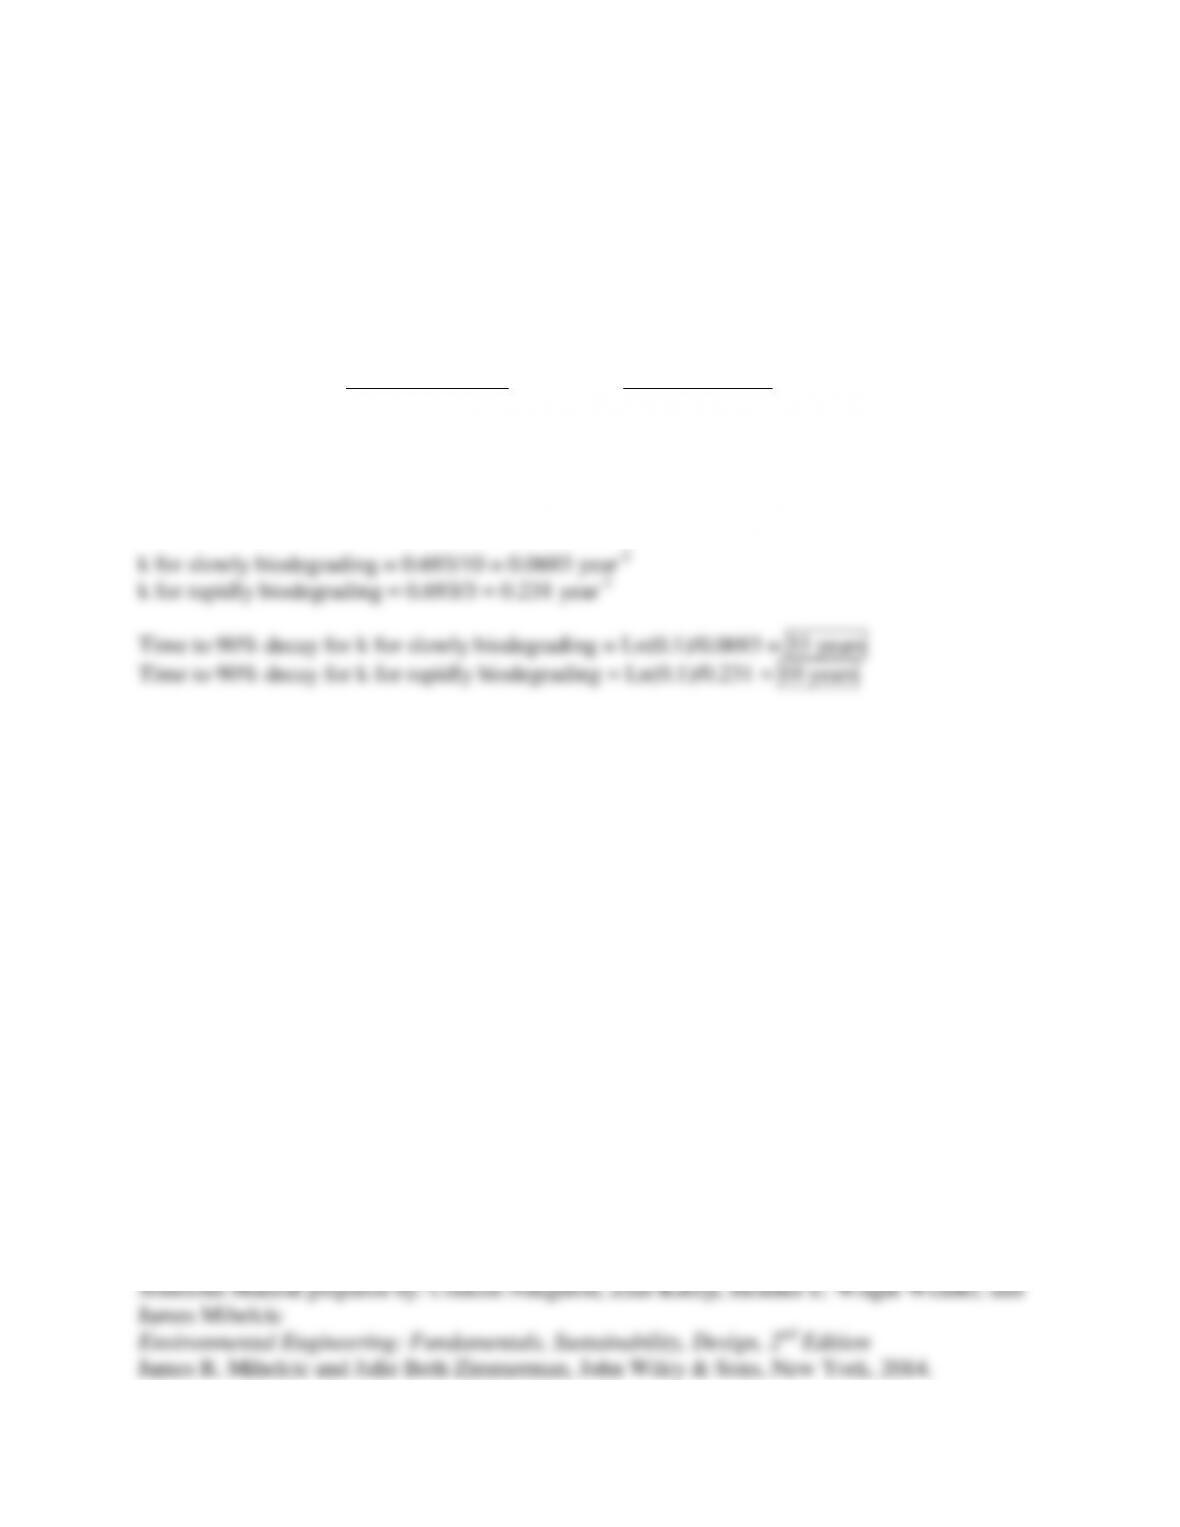
long until 90 percent of the gas will be produced in this section?
Initial Mass (Mg) Half-life (years)
Slowly biodegrading 10,000 10
Rapidly biodegrading 40,000 3
Non-biodegrading 50,000 infinite
Solution:
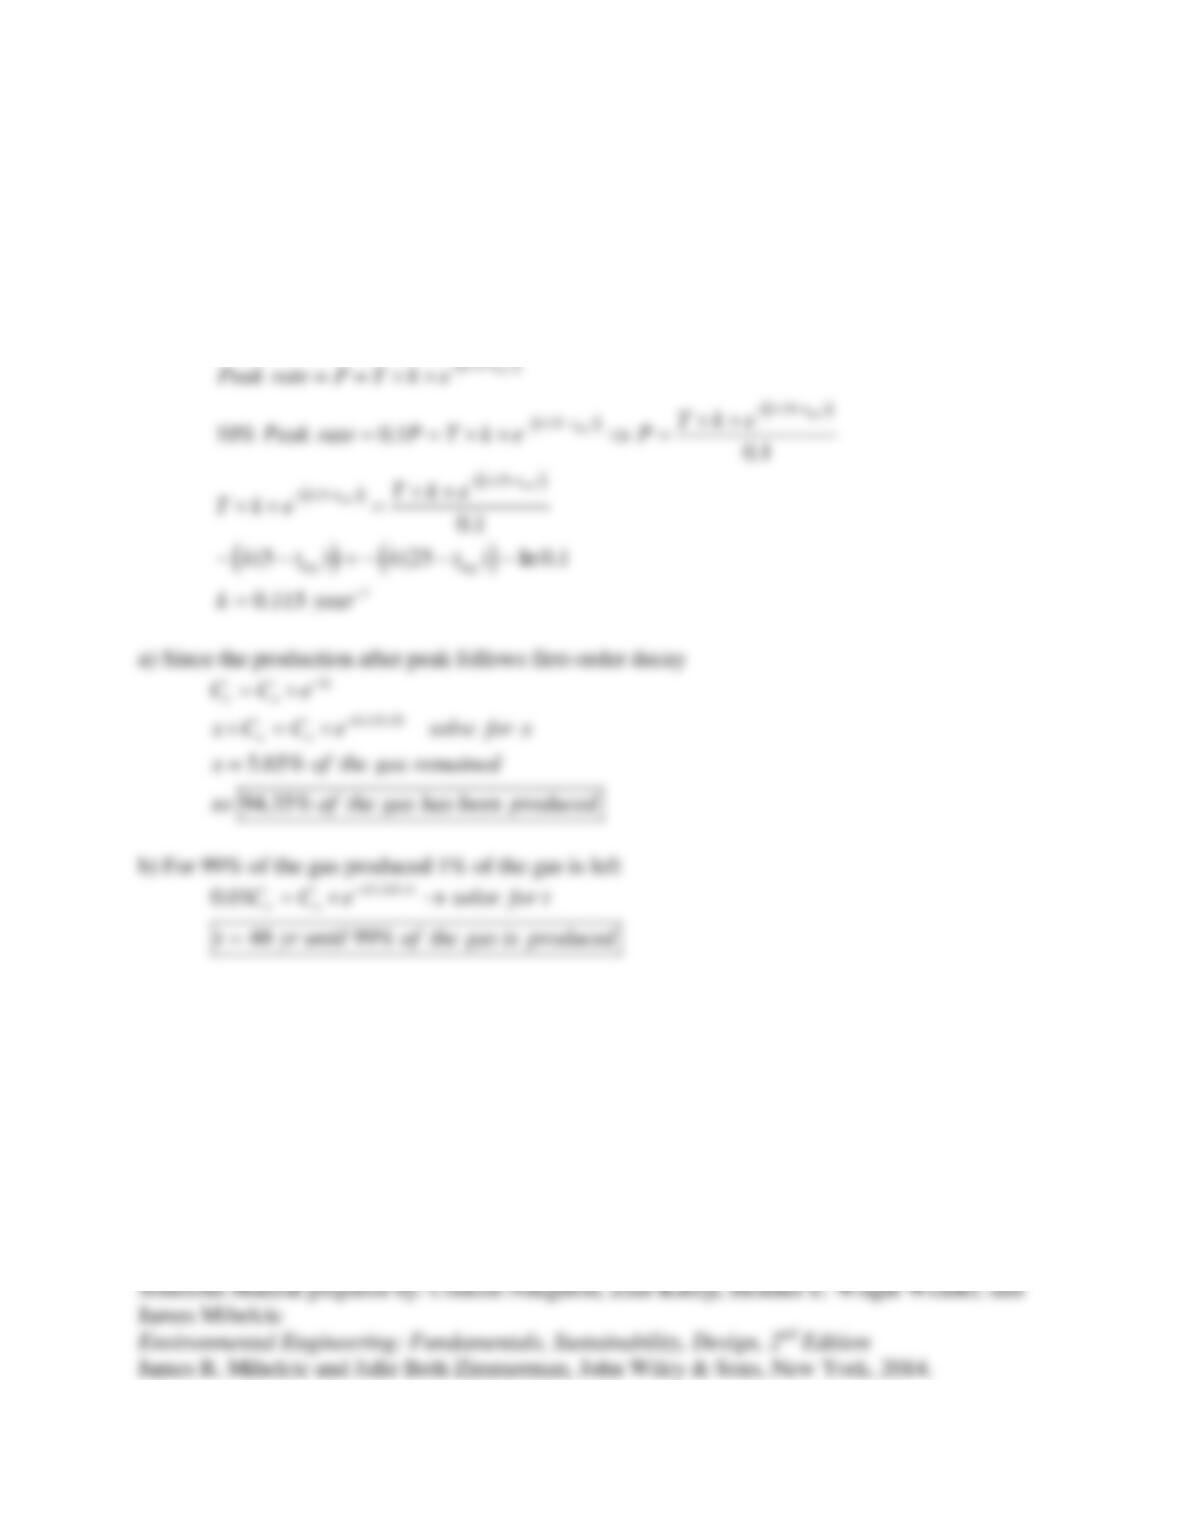
10.12 Assume all the waste in one section of a landfill was added at the same time. After 5 yr,
the gas production rate reached its peak. After 25 yr (20 yr after the peak), the production rate
had decreased to 10 percent of the peak rate. Assume first-order decay in the gas production rate
after reaching its peak. Assume no gas is produced prior to the peak of 5 years. (a) What
percentage of the total gas production do you predict has occurred after 25 yr? (b) How long do
you predict until 99 percent of the gas has been produced?
Solution:
( )
( ) ( )
( ) ( )
(5 )
(25 )
(25 )
(25 )
(5 )
10% 0.1 0.1
lag
lag
lag
lag
lag
kt
kt
kt
kt
kt
Peak rate P T k e
Tke
Peak rate P T k e P
Tke
−−
−−
−−
−−
−−
= = ××
××
= = ×× ⇒ =
××
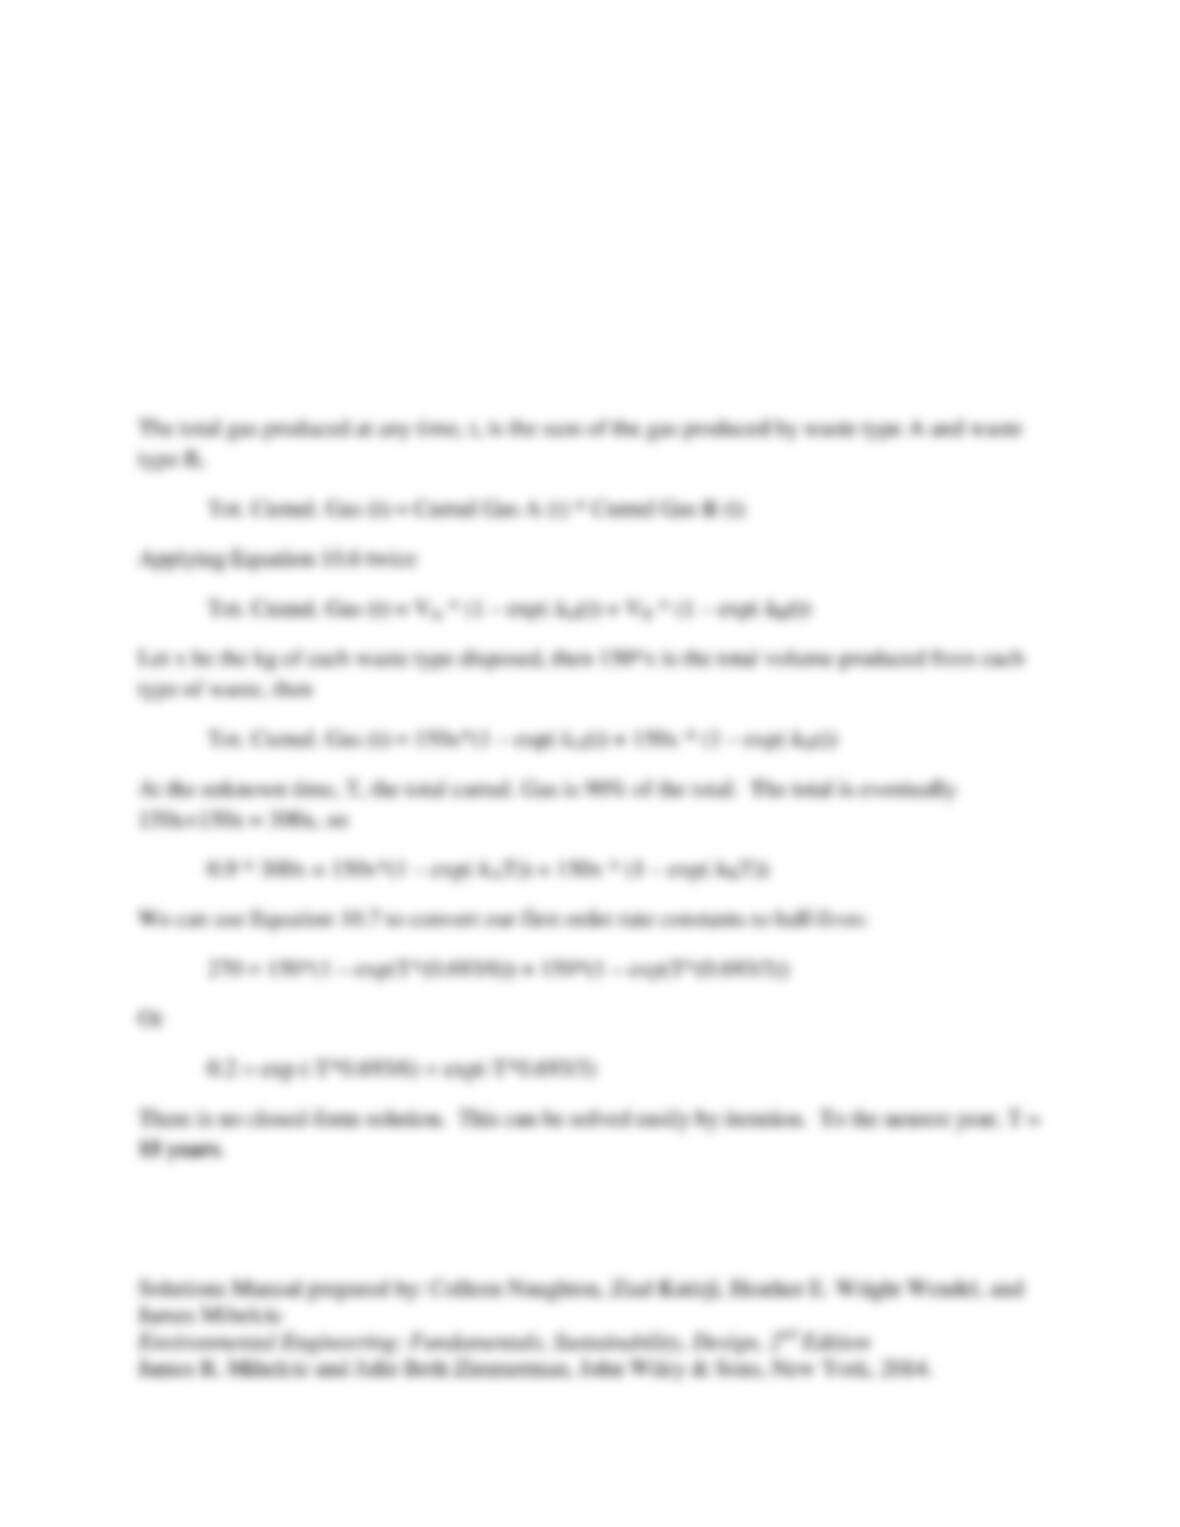
10.13 Equal amounts of two types of waste are disposed into a section of a landfill. They both
start producing gas at t=0, and so there is no lag time. Assume first-order decay for gas
production. Each type of waste can produce 150 L CH4/kg of waste. Waste type A produces gas
with a half-life of 6 years, and waste type B produces gas with a half-life of 3 years. How long
(to the nearest year) until 90% of each gas has been produced?
Solution:

10.14 Determine whether your local (or regional) landfill produces energy from methane gas. If
so, what is the mass of solid-waste disposed at the landfill on an annual basis, and what is the
amount of CH4 generated? Relate these numbers to a calculation you can perform with
appropriate assumptions.
Solution:
Students’ responses will vary.
10.15 (a) Calculate the volume of methane produced (m3/year) due to landfilling for the years
1970 and 2010. Assuming the landfilled municipal solid waste produces gas in a similar fashion
between the two years. The U.S. Census Bureau reports the U.S. population was 203,392,031
in 1970 and was 308,745,531 in 2010. Use the landfilling and composting rates provided in
Table 10.2. Assume the three waste components that produce methane did not change over time
and are food wastes (15 percent of total), mixed paper (30 percent of total), and yard wastes (15
percent of total). Assume that 60 percent of the food and paper wastes and 40 percent of the yard
trimmings will decompose if placed in a landfill. (b) Determine the energy (in MW) of landfill
gas produced in 1970 and 2010. Assume 1 MW of gas is produced for every 270 m3/hr of CH4
produced at the landfill
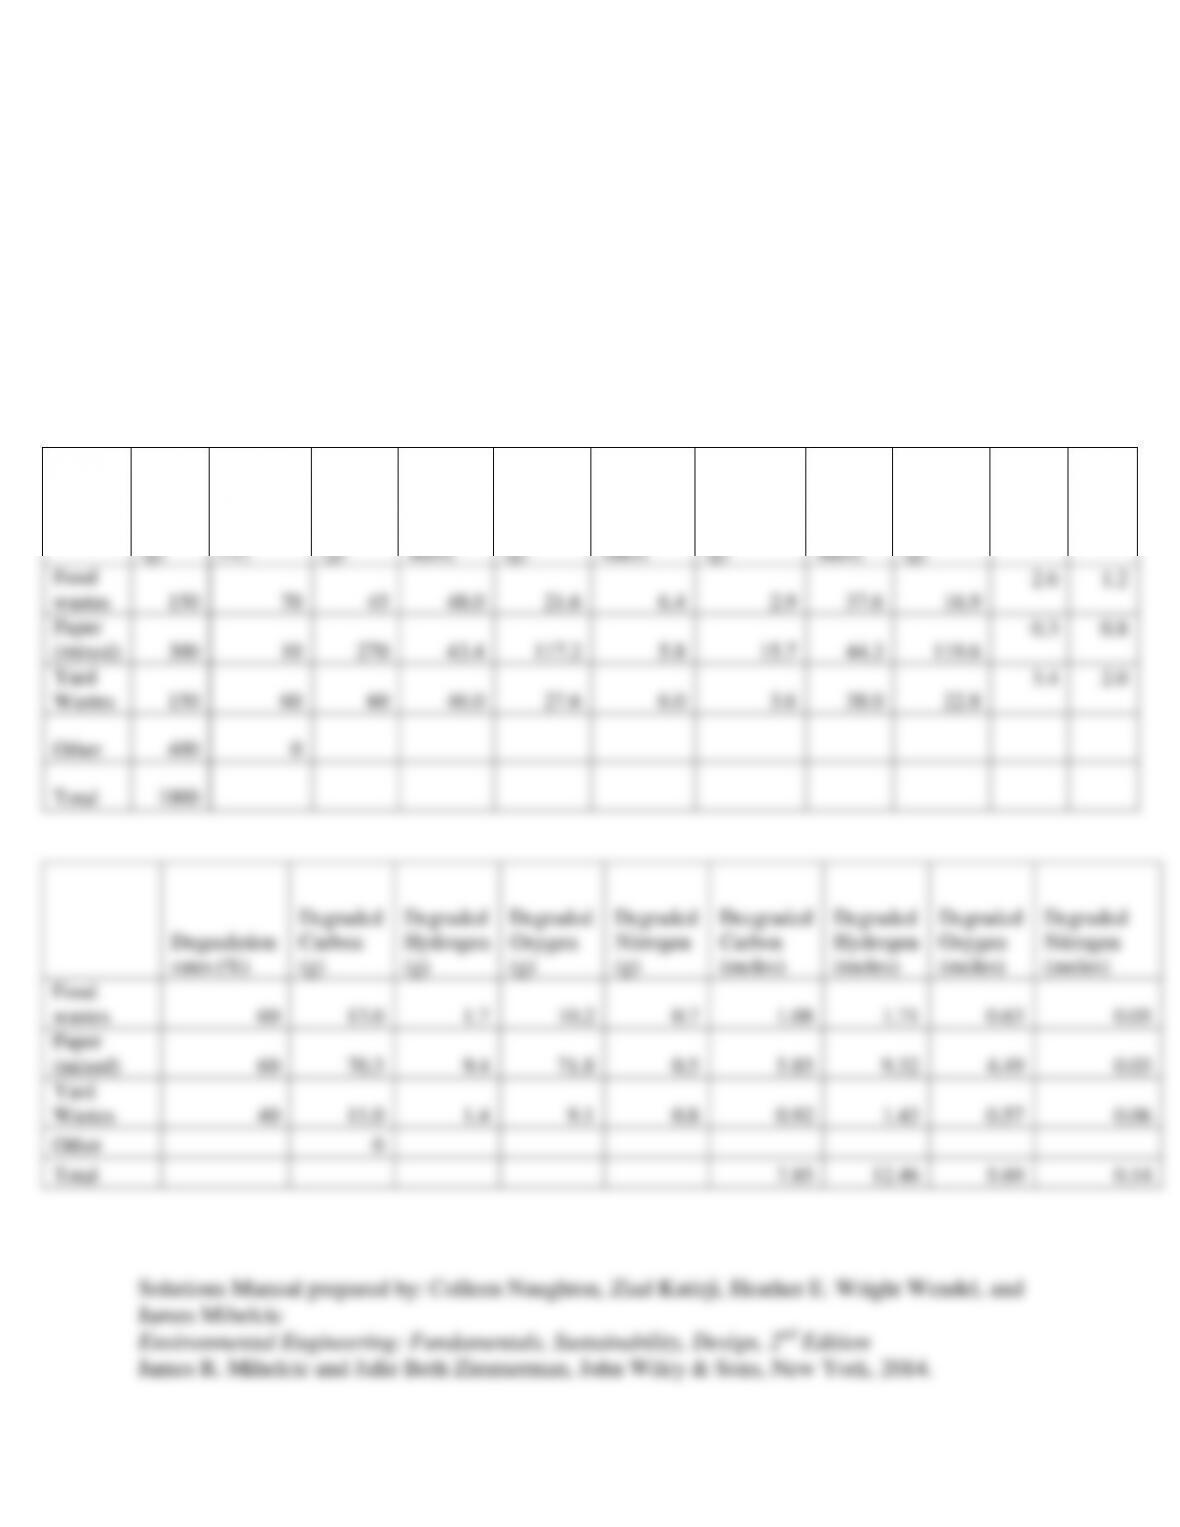
Solution: Recalculate Table 10.15 in Example 10.5 given the different waste components.
Wet
weight
(g)
Moisture
Content
(%)
Dry
Weight
(g)
Carbon
(% by
dry
mass)
Total
Carbon
(g)
Hydrogen
(% by dry
mass)
Total
Hydrogen
(g)
Oxygen
(% by
dry
mass)
Total
Oxygen
(g)
N (%
by dry
mass)
Total
N (g)
Food
wastes
150
70
45
48.0
21.6
6.4
2.9
37.6
16.9
2.6
1.2
Paper
(mixed)
300
10
270
43.4
117.2
5.8
15.7
44.3
119.6
0.3
0.8
Yard
Wastes
150
60
60
46.0
27.6
6.0
3.6
38.0
22.8
3.4
2.0
Other
400
0
Total
1000


