ANSWERS, SOLUTIONS, AND EXERCISES
PROBLEM SET
1 This statement is false (see Figure 2 in the chapter). Although the U.S. unemployment
1. This statement is false. As you can see in Figure 4 in the chapter, the U.S.
2. a. The percentage increase in real GDP (in decimal form) is the change in population
b. The percentage increase in the U.S. population was (301.4 million – 292.9 million)
c. Real GDP per capita in 2004: 12,247 billion / 292.9 million = $41,813.
3. a. Real GDP in 2007 would have been $13,382.
[Here are the calculations: If real GDP had grown by 3% per year from 2004 to
2007, then real GDP in 2005 would have been $12,247 billion x 1.03 = $12,614
b. Output per person in 2007 would have been $13,382 billion / 301.4 million =
$44,399.
4. From 2007 to 2008, the percentage change in real GDP was ($13,162 billion –
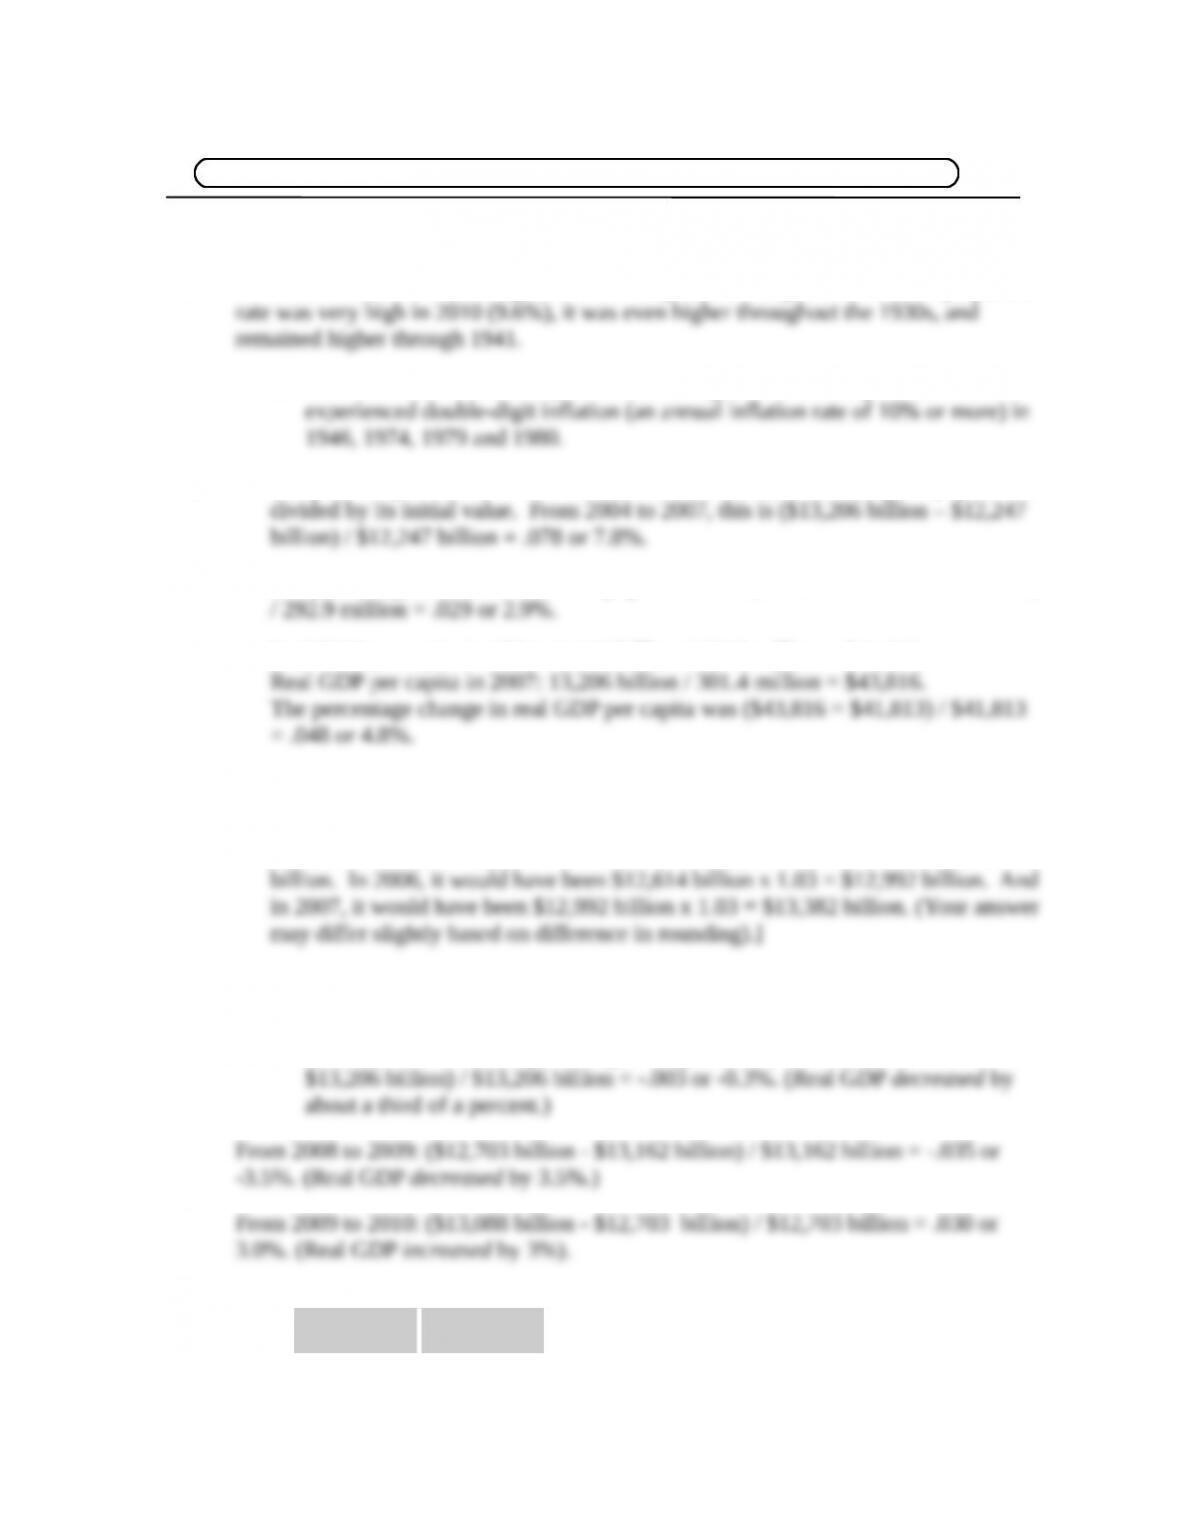
5. a.
Year Real GDP
192
193 Instructor’s Manual for Economics: Principles and Applications, 6e
(in billions)
No, the real GDP line becomes steeper over time because, as real GDP rises
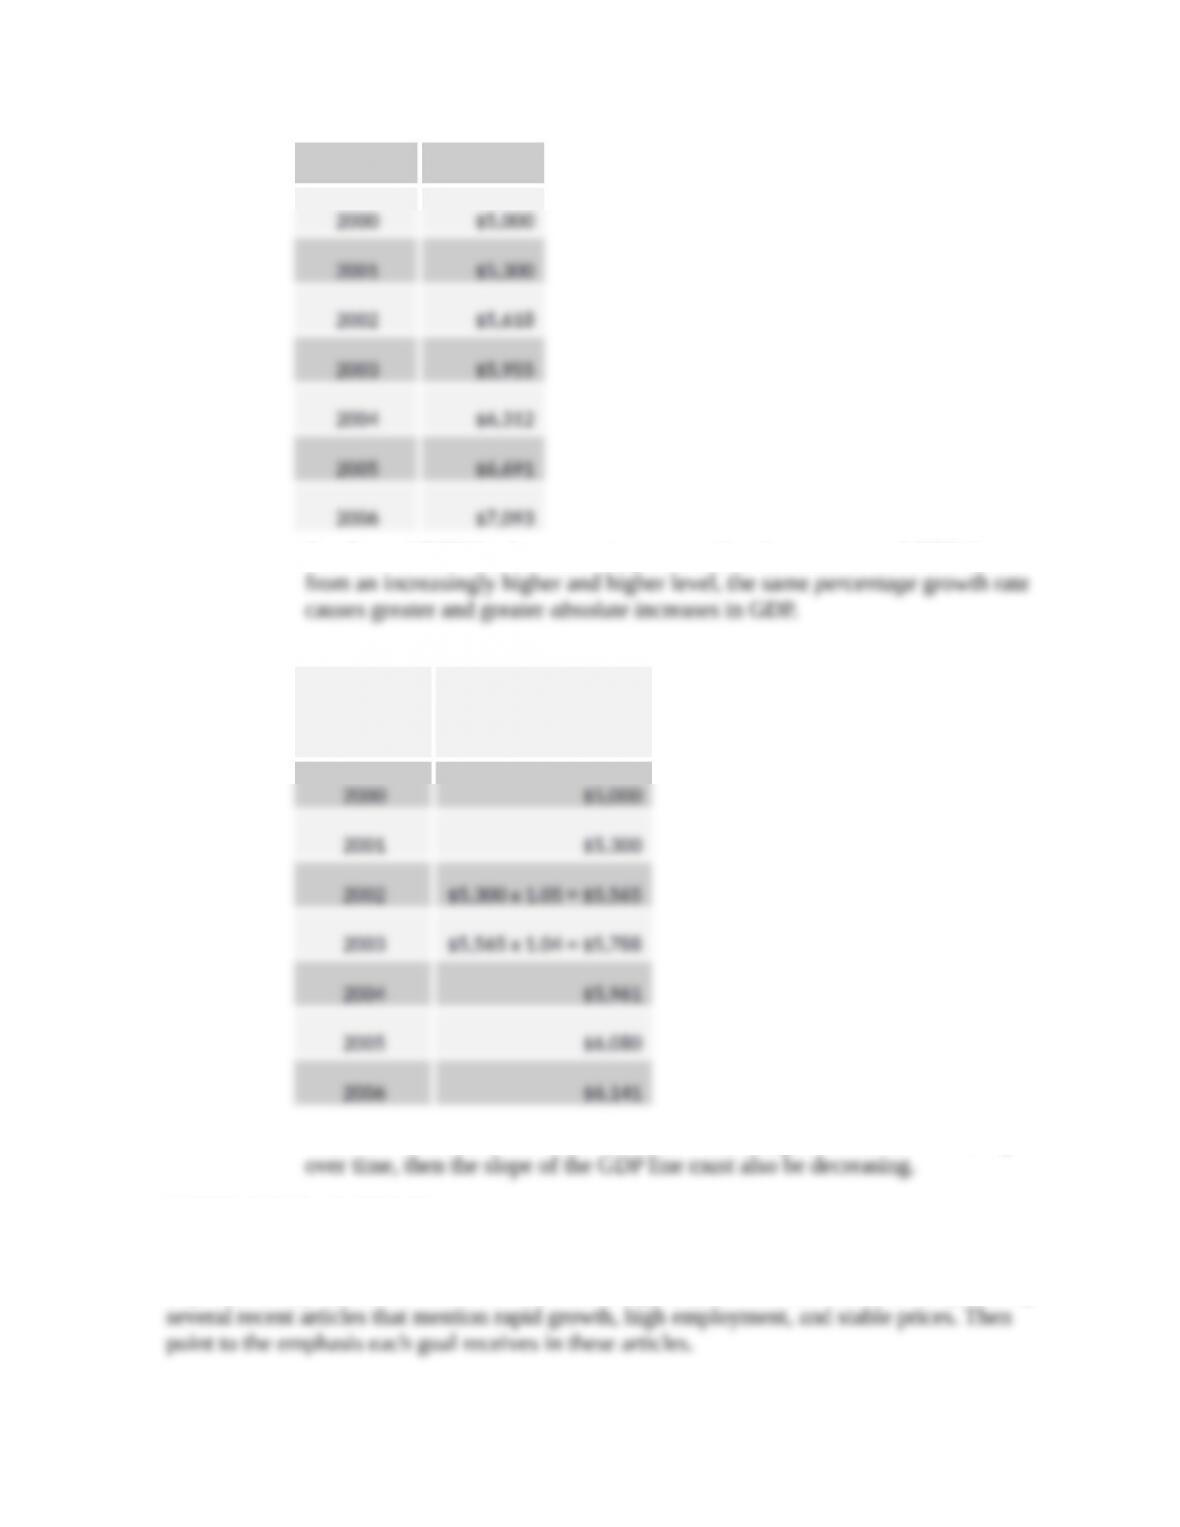
b.
Year Real GDP
(in billions)
No, the real GDP line becomes flatter. Because the growth rate is decreasing
EXPERIENTIAL EXERCISE
Which of the three macroeconomic goals mentioned in this chapter do you think is the most
important today? Use The Wall Street Journal to support your conclusions. Do this by finding