ANSWERS, SOLUTIONS, AND EXERCISES
PROBLEM SET
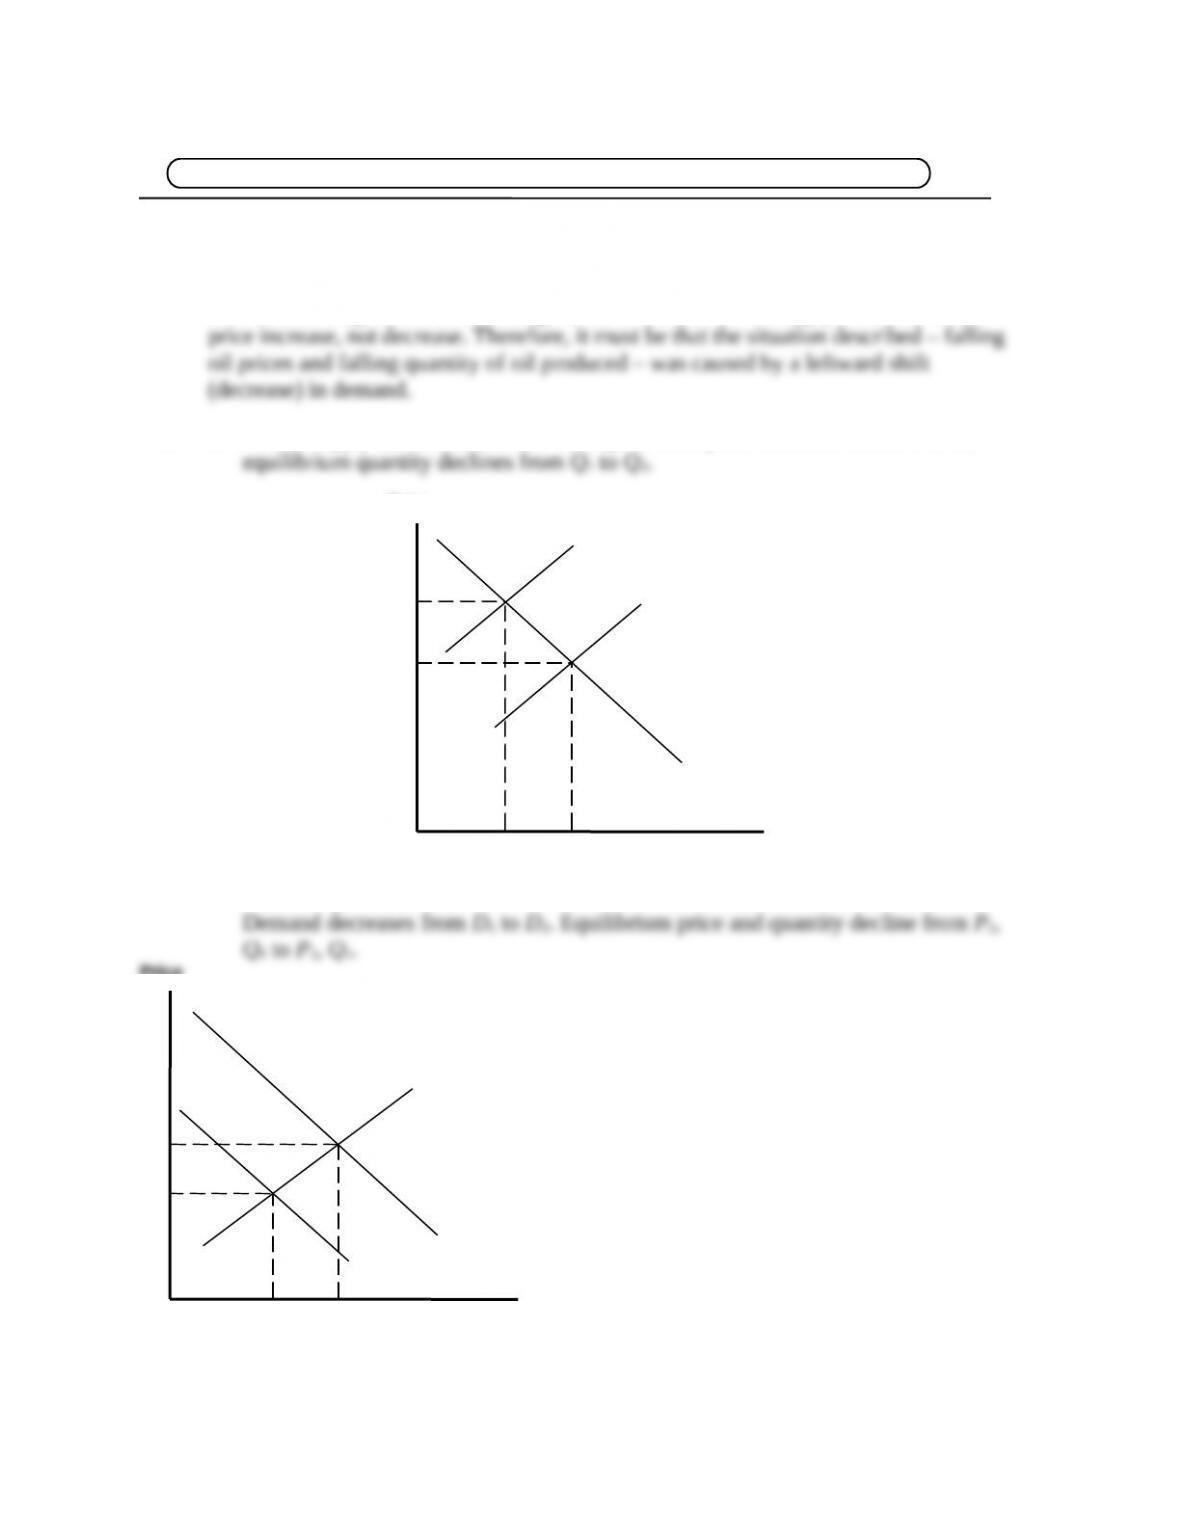
1. False. Slowing down oil production would correspond to a leftward shift of the supply
curve. Assuming demand is unchanged, this leftward shift in supply would lead to a
2. a. Coffee supply declines from S1 to S2. Equilibrium price increases from P1 to P2;
Price
Q
2
Q
1
Quantity
P
2
P
1
D
1
S
1
S
2
b. Since the price of a substitute has fallen, demand for coffee should decrease.
Price
Q
2
Q
1
Quantity
P
1
P
2
D
1
S
1
D
2
14
15 Instructor’s Manual for Economics: Principles and Applications, 6e
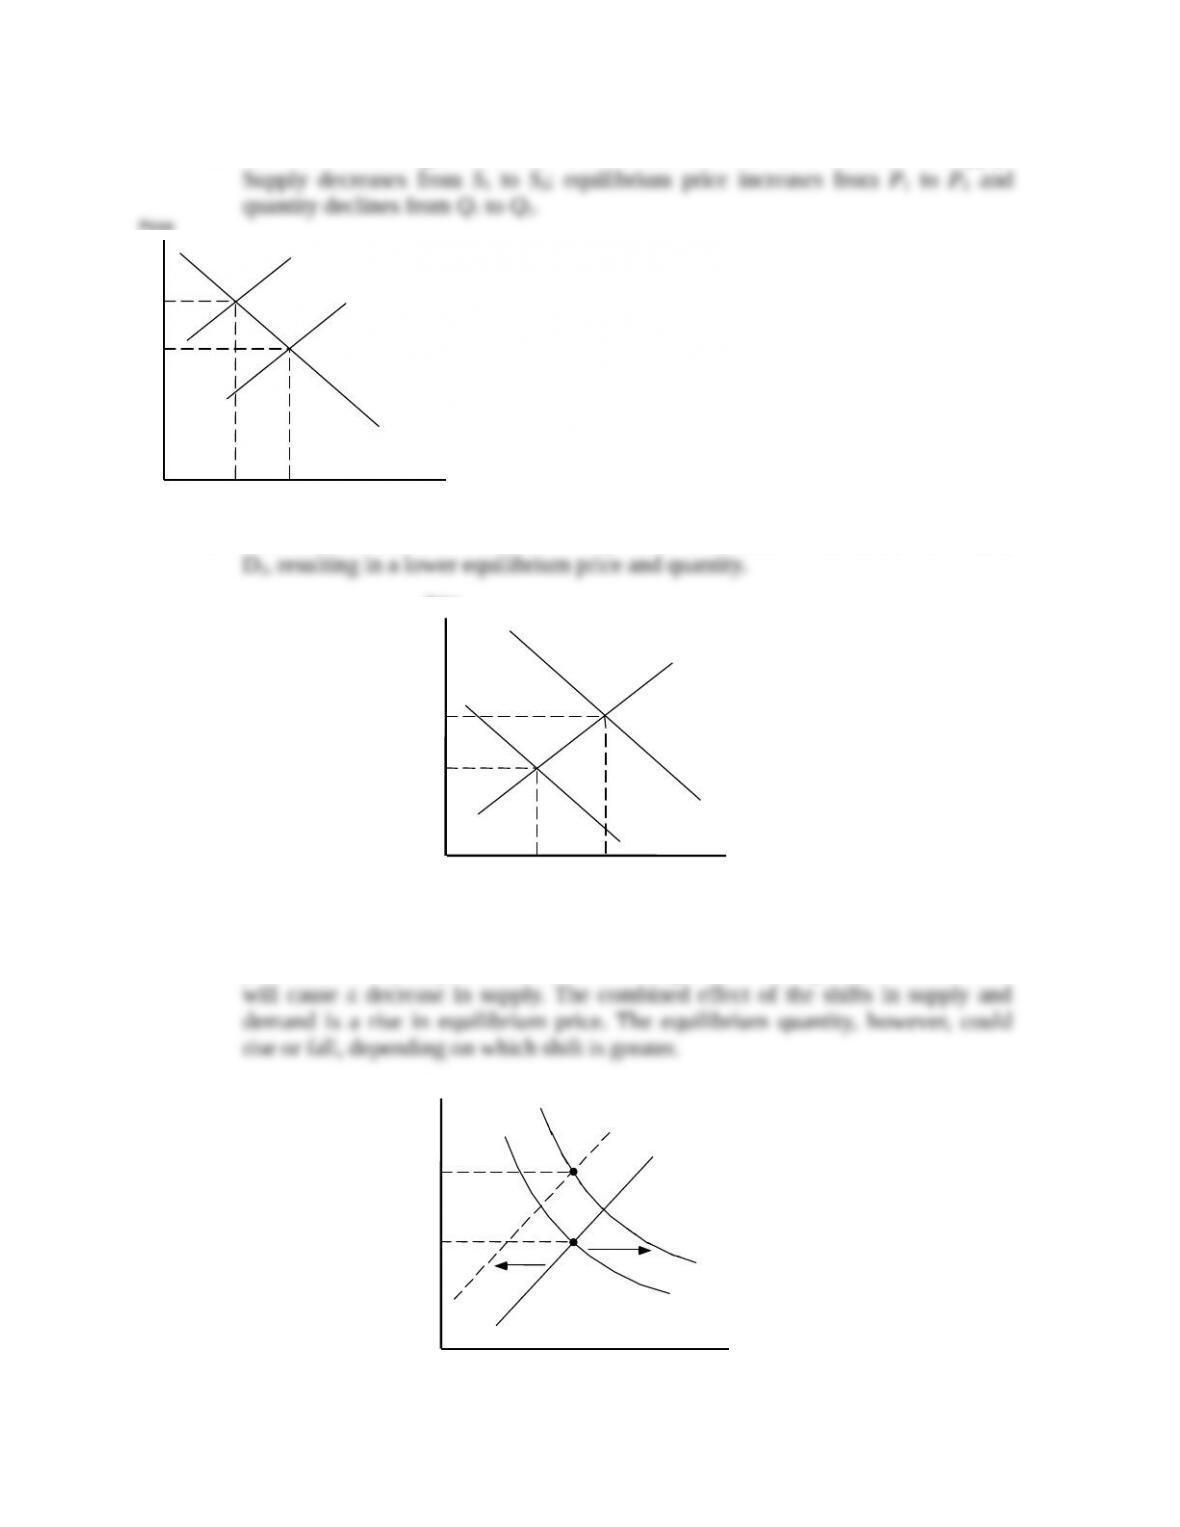
c. An increase in wages of coffee workers should result in a decrease in supply.
Price
Q
2
Q
1
Quantity
P
2
P
1
D
1
S
1
S
2
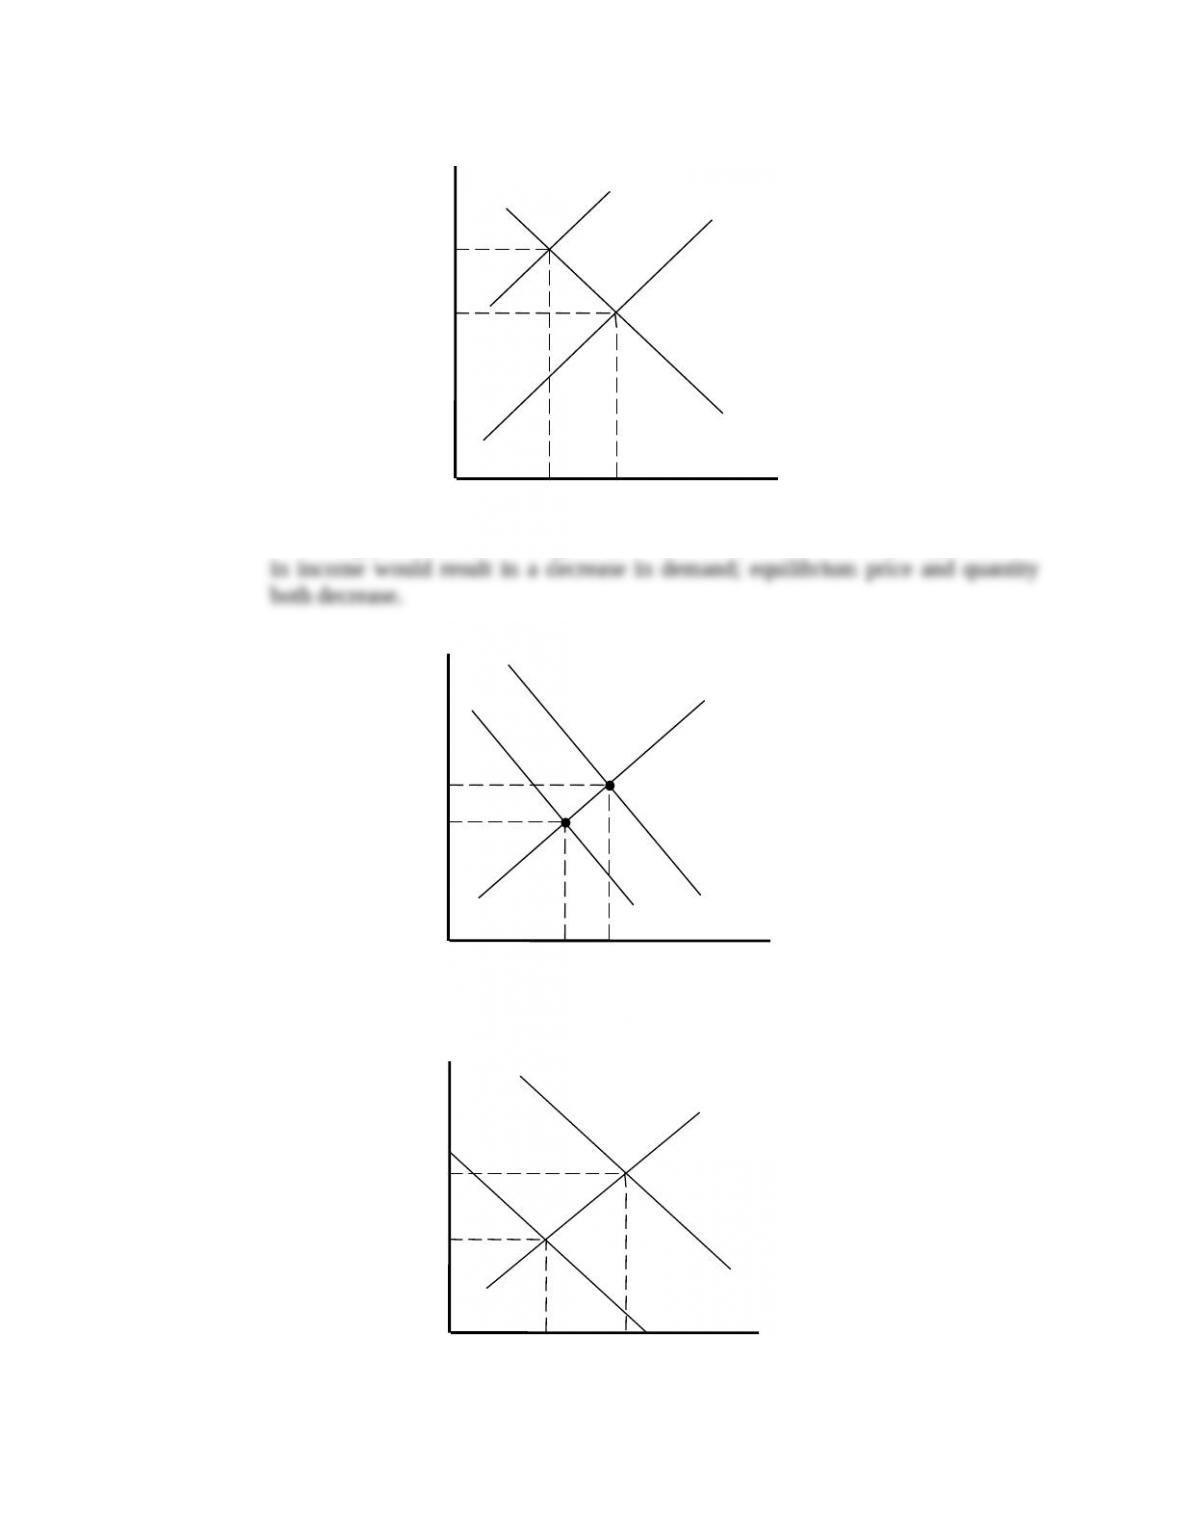
d. This announcement would undoubtedly cause a decrease in demand, from D1 to
Price
Q
2
Q
1
Quantity
P
1
P
2
D
1
S
1
D
2
e. If consumers expect higher coffee prices in the future, they would try to stock up
on coffee now, causing an increase in current demand. If producers, too, expect the
price to rise, they may withhold coffee, waiting to sell it at higher prices later. This
Price
Quantity
P
2
P
1
D
1
S
1
D
2
S
2
Chapter 3 Supply and Demand 16
3. The article discusses both a decrease in supply (leftward shift) and an increase in
demand (shift to the right). The direction of the change in equilibrium price can be
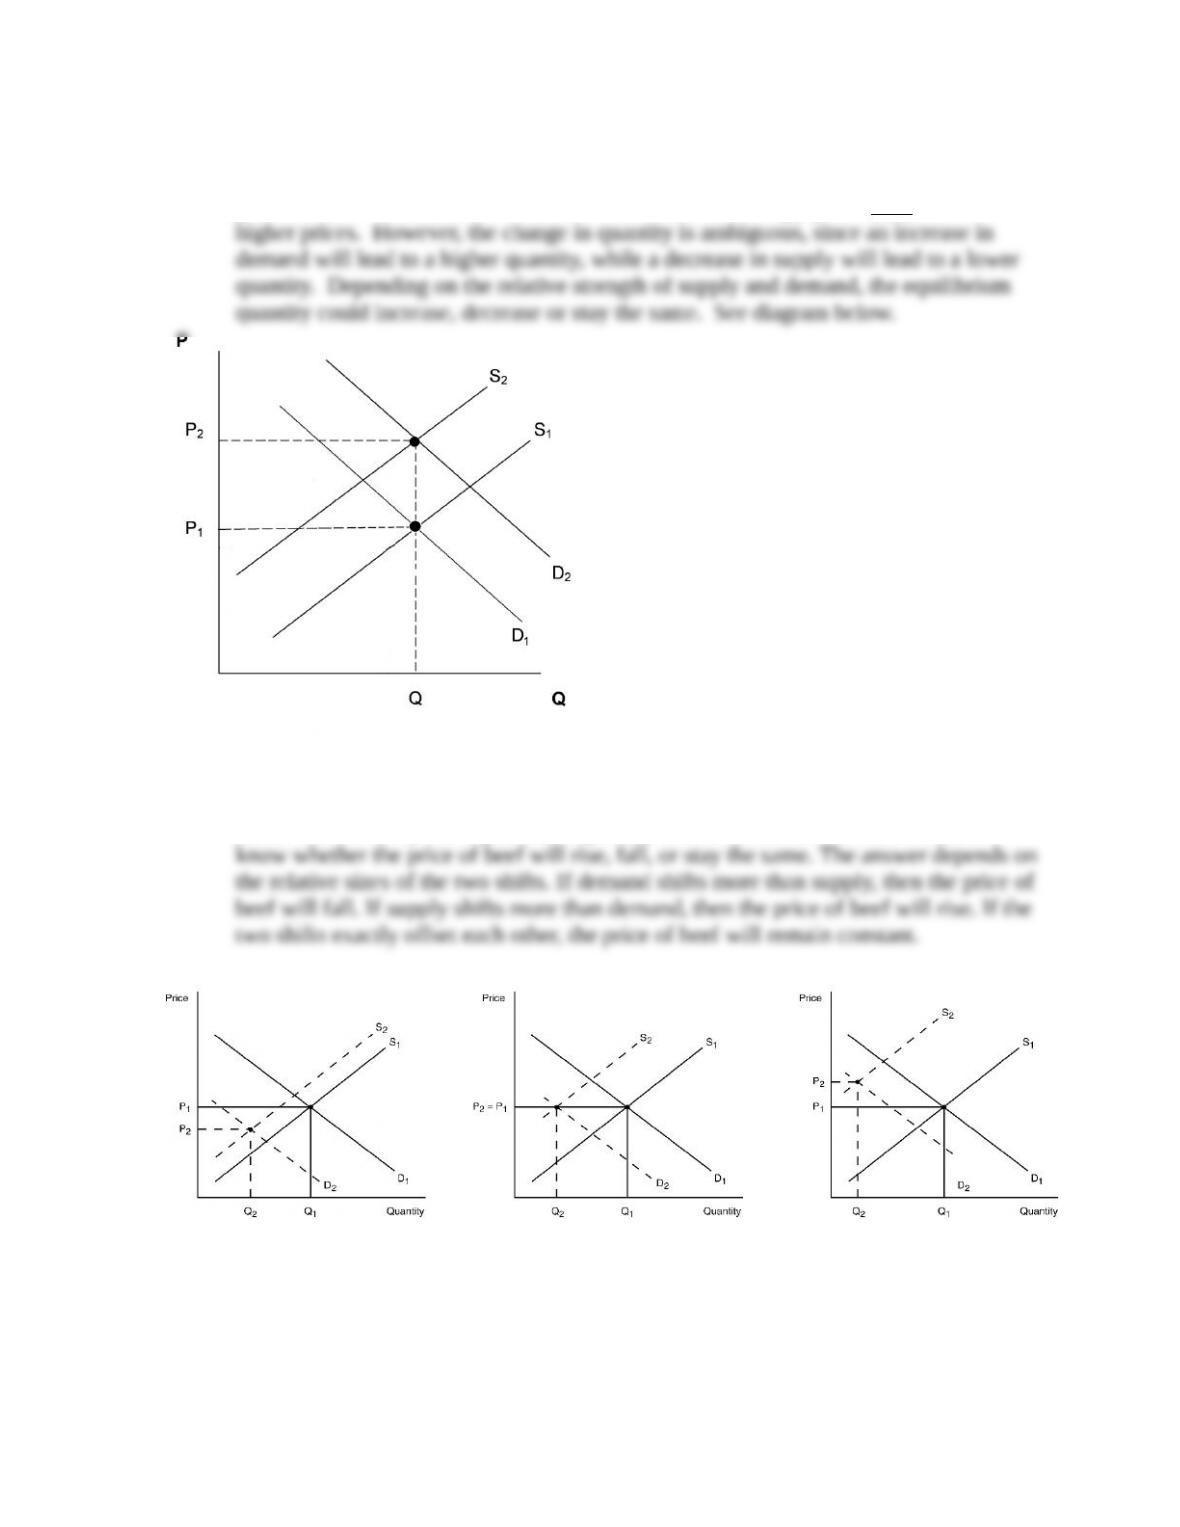
predicted, since an increase in demand and a decrease in supply will both lead to
4. The demand curve for beef shifted to the left as consumers switched to other meats. At
the same time, the supply curve for beef also shifted to the left, as farmers destroyed
their herds. Since both of these shifts lead to a lower equilibrium quantity of beef, we
know with certainty that equilibrium quantity will decrease. However, we cannot
Graphically, the three alternative outcomes are as follows:
Quantity (1,000s)
17 Instructor’s Manual for Economics: Principles and Applications, 6e
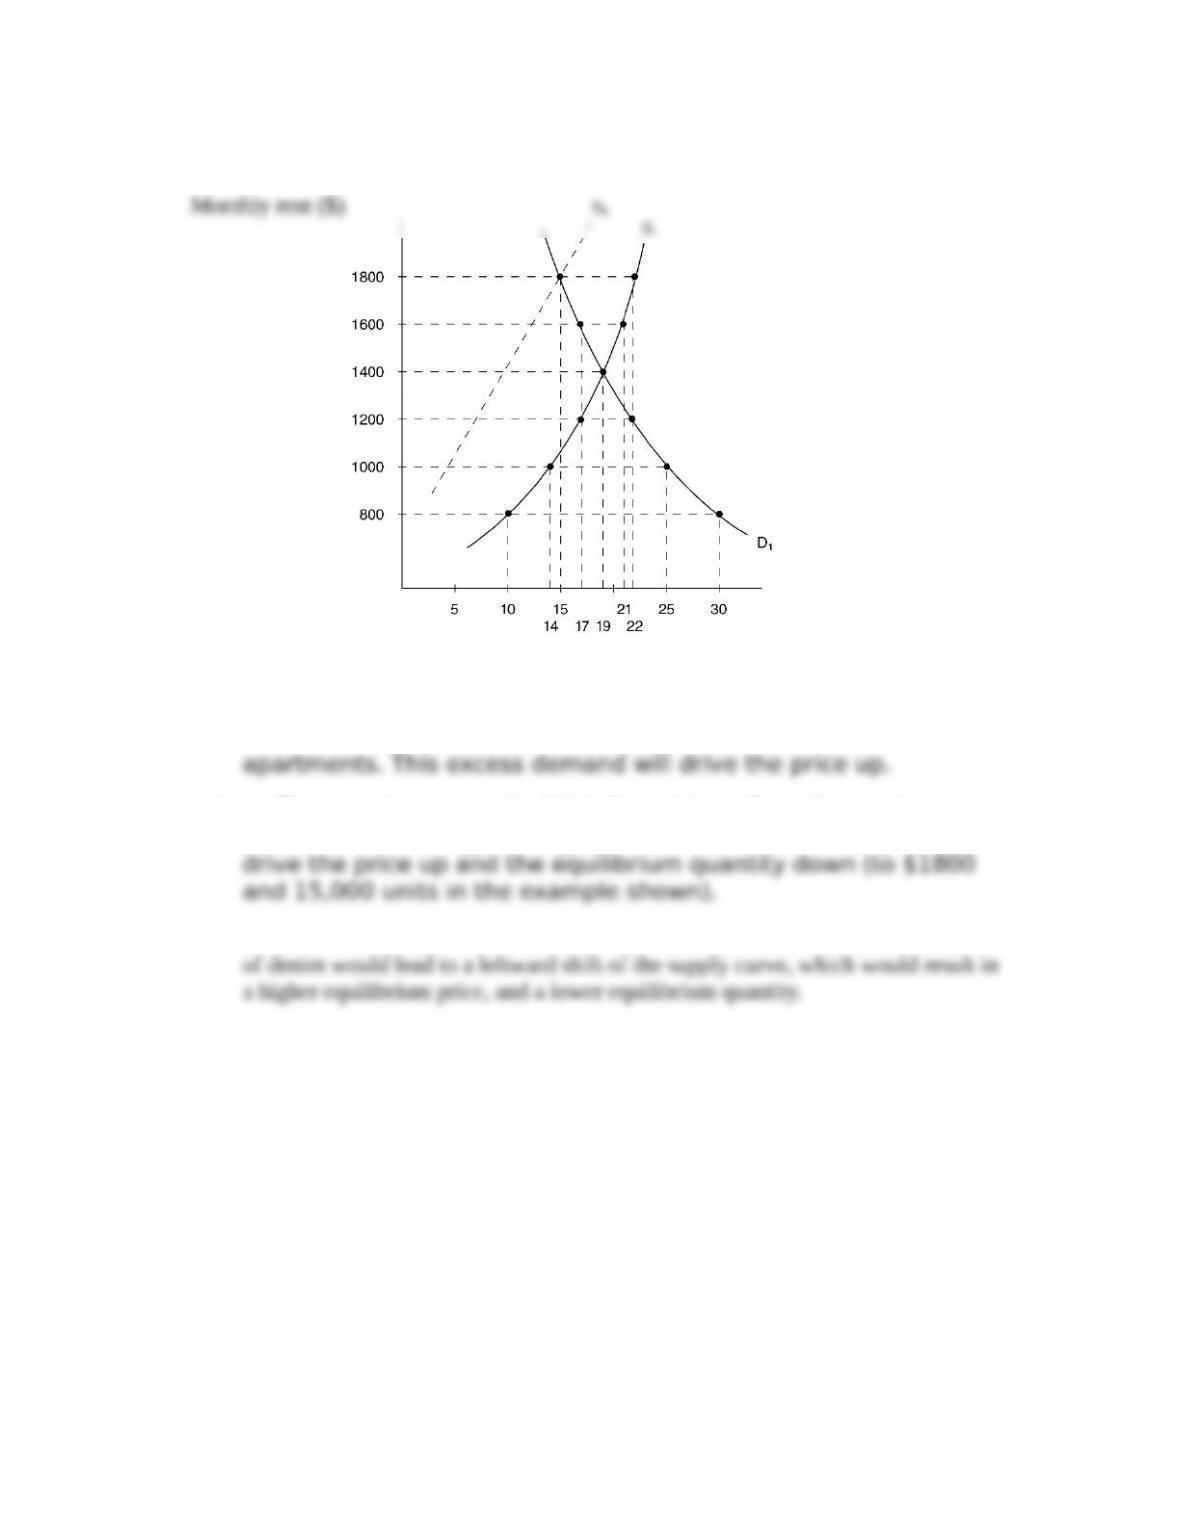
5. a
b. $1400 is the equilibrium price, and 19,000 is the equilibrium quantity.
c. At a rent of $1000, there is excess demand of 11,000
d. The supply curve will shift leftward from S1 to S2, as shown in
part a. The resulting shortage at the initial equilibrium price will
6. a. Since denim is a major input into the production of jeans, an increase in the price
Chapter 3 Supply and Demand 18
Price
Q
2
Q
1
Quantity
P
2
P
1
D
1
S
1
S
2
b. Assuming jeans are a normal good (this seems a plausible assumption), a decline
Price
Q
2
Q
1
Quantity
P
1
P
2
D
1
S
1
D
2
7. The supply and demand curves are S1 and D1, respectively.
Price
Q
2
140
Quantity
$1.40
P
2
D
1
S
1
D
2
19 Instructor’s Manual for Economics: Principles and Applications, 6e
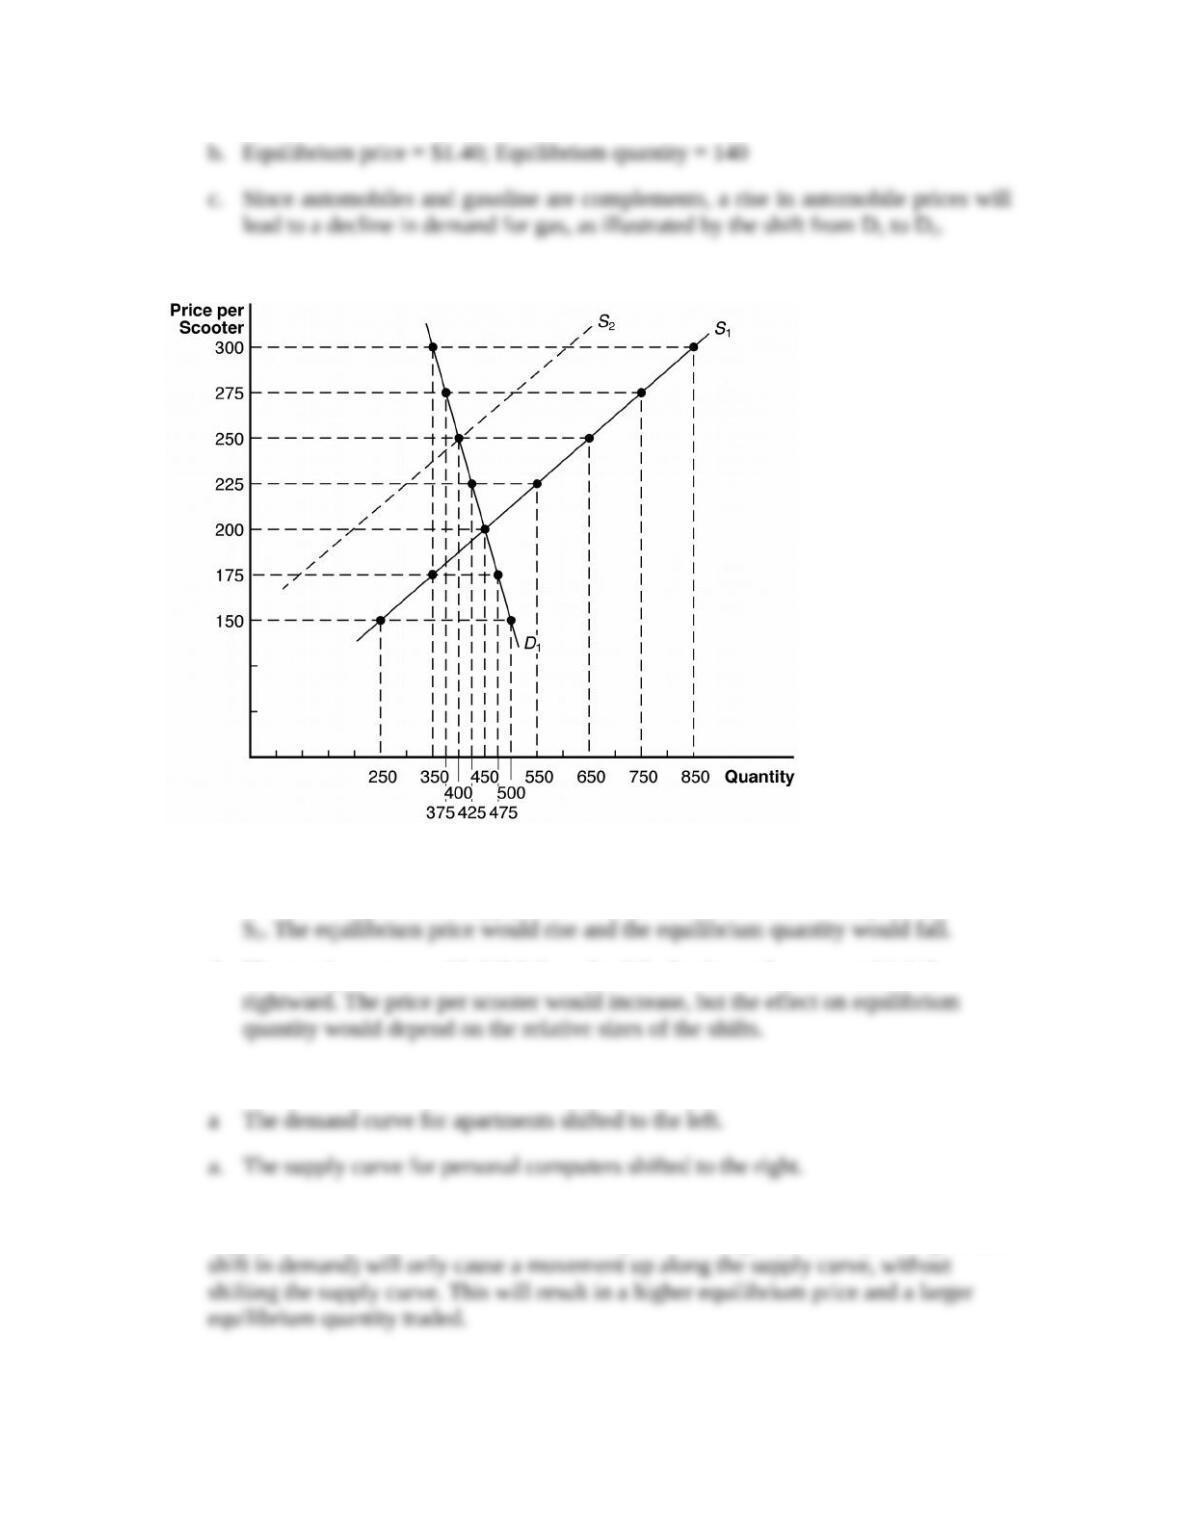
8. a.
b. The equilibrium price is $200, and the equilibrium quantity is 450 scooters.
c. As shown in part a, the supply curve would shift leftward, for example from S1 to
d. The supply curve would shift leftward, while the demand curve would shift
9. a. The supply curve for furniture shifted to the left.
10. The mistake is in the assumption that a higher price will lead to a rightward shift in
supply. Instead, we know that an increase in price of oranges (caused by the rightward
Chapter 3 Supply and Demand 20
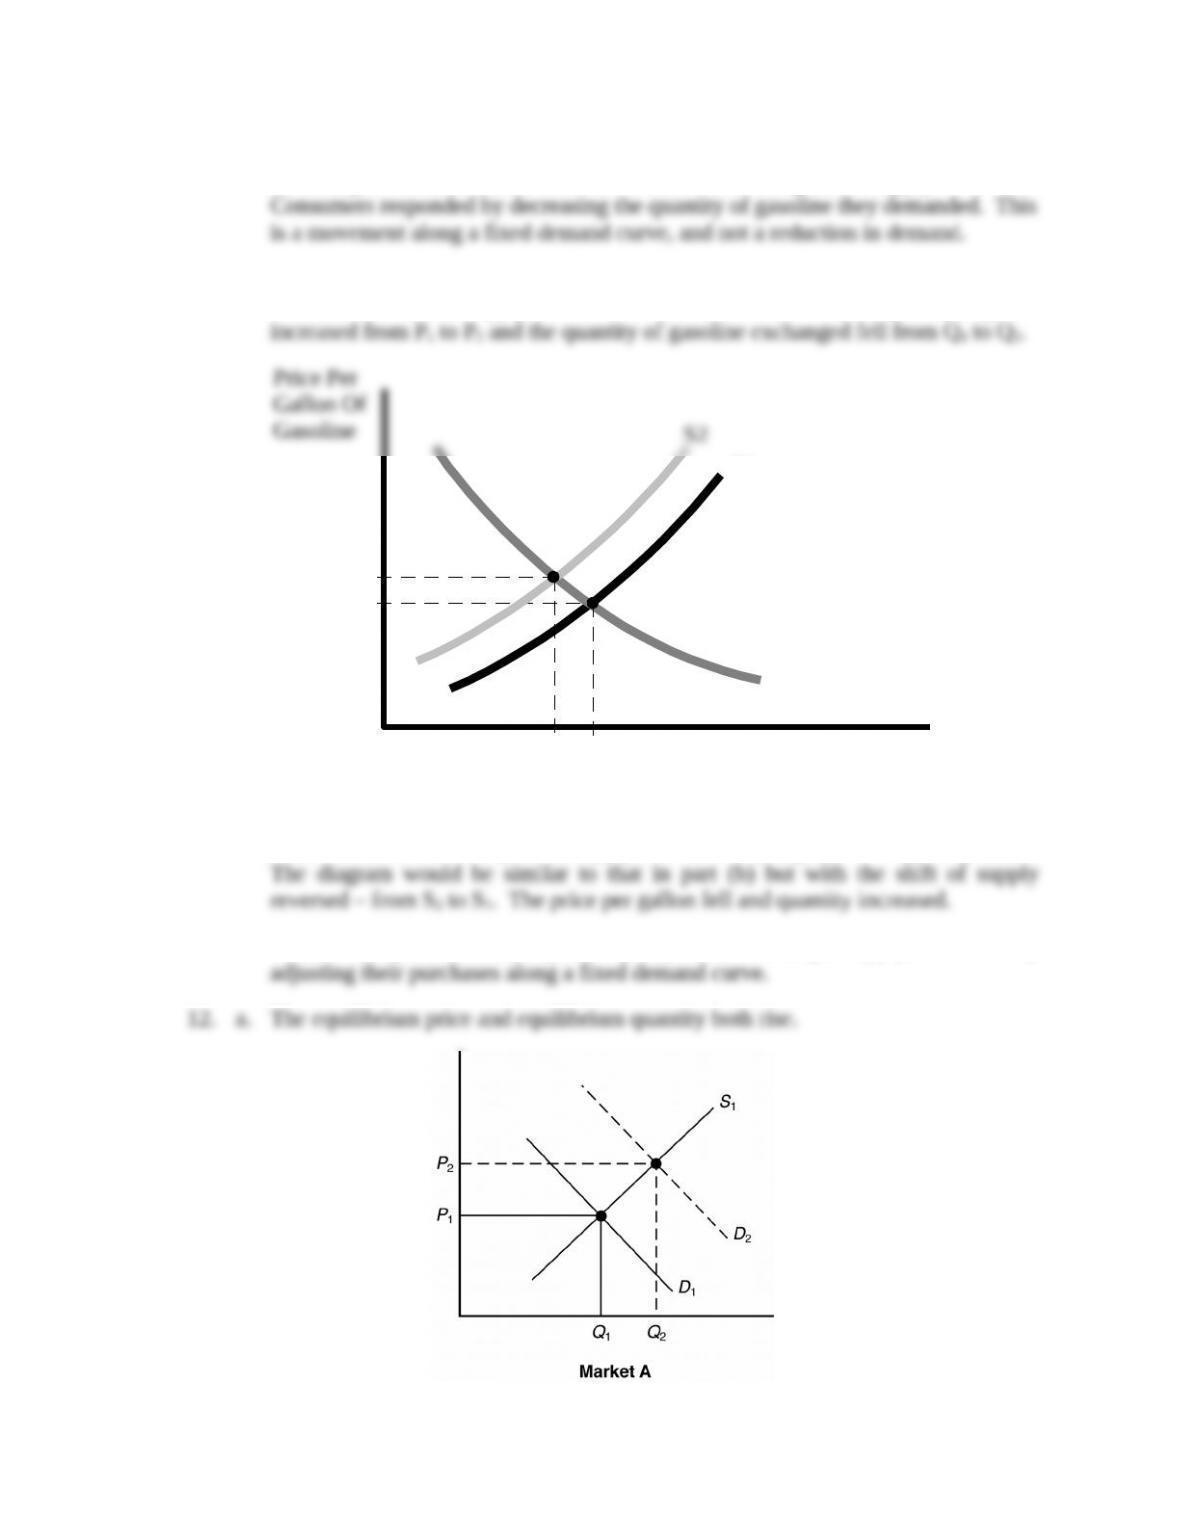
11. a. The statement confuses demand and quantity demanded. The higher prices due
following Hurricane Katrina were the result of an interruption in supply.
a The devastation following the hurricane disrupted gasoline supplies, leading to a
leftward shift of the supply curve from S1 to S2. As a result, the price per gallon
c. For the most part, consumers passively responded to changed supply conditions by
21 Instructor’s Manual for Economics: Principles and Applications, 6e
Chapter 3 Supply and Demand 22
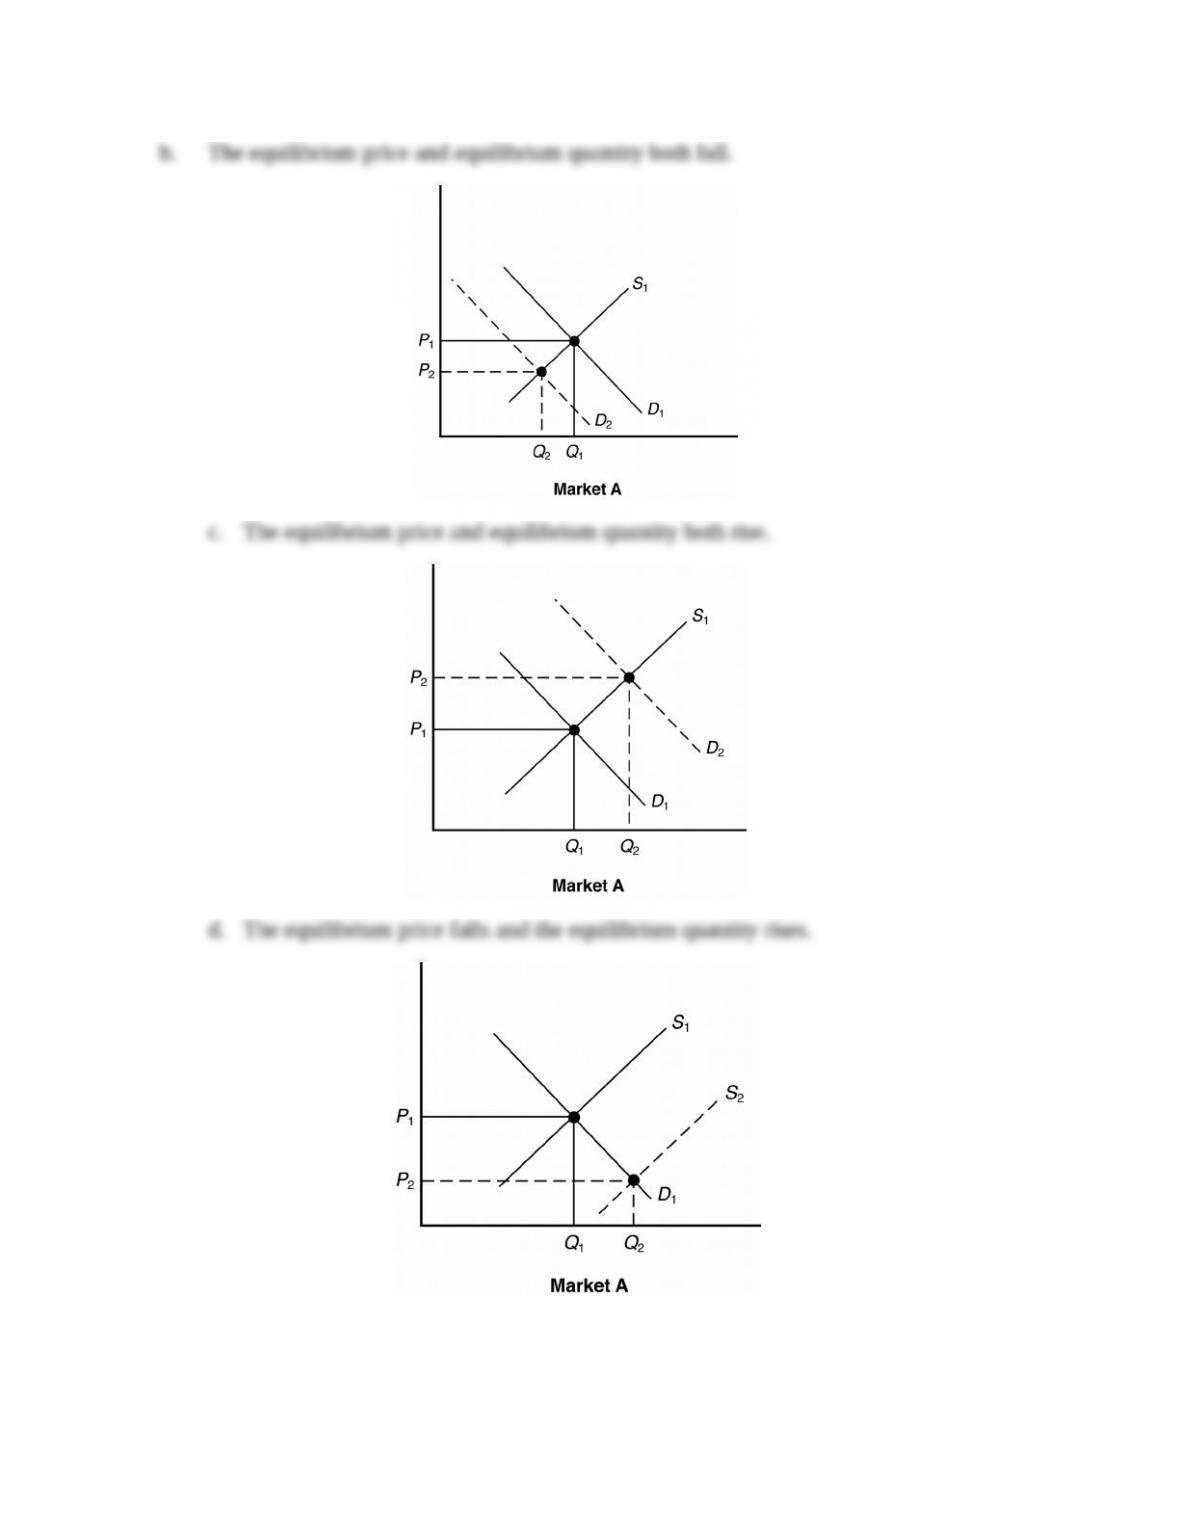
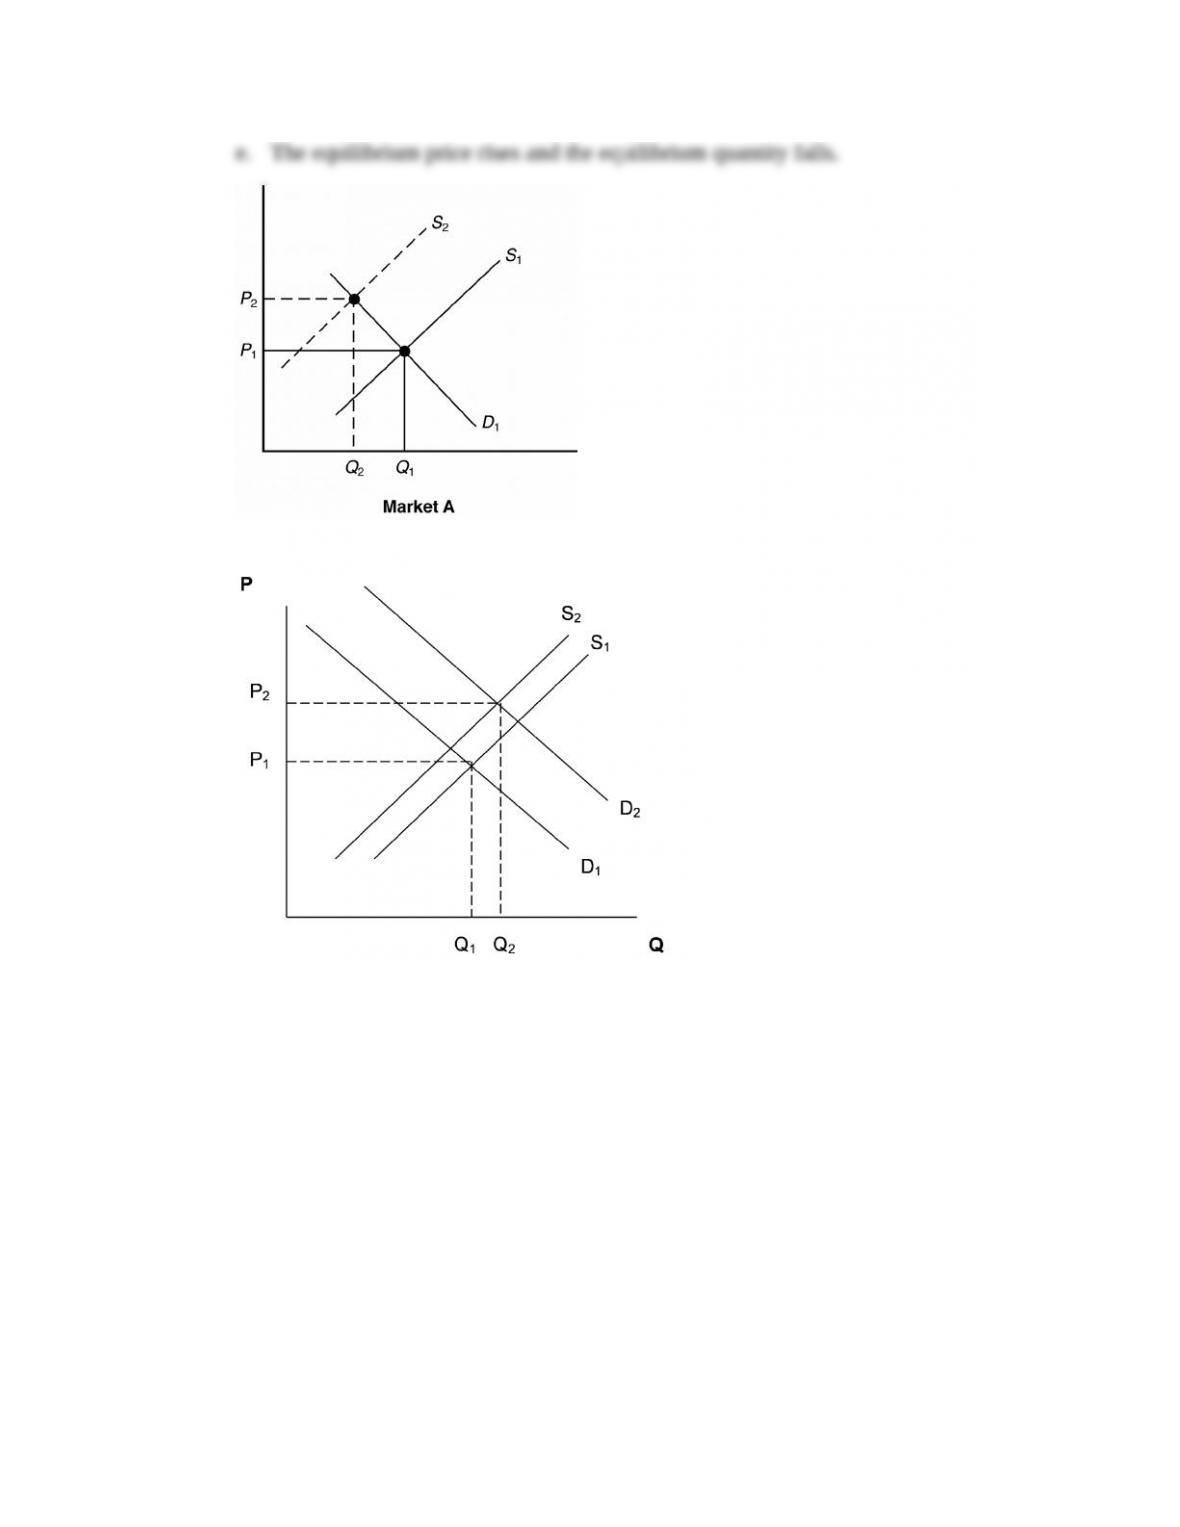
13. a.
Q1 Q2
P1
P2
S1
S2
D1
D2
P
Q
Q1 Q2
P1
P2 S1
S2
D1
D2
P
Q
c. False. It is possible that the supply curve shifted leftward, if at the same time the
Chapter 3 Supply and Demand 24
14. There was a rise in the expected price. Even thought the price of cotton was high,
cotton farmers must have expected it to go even higher, so they wanted to wait to sell.
MORE CHALLENGING
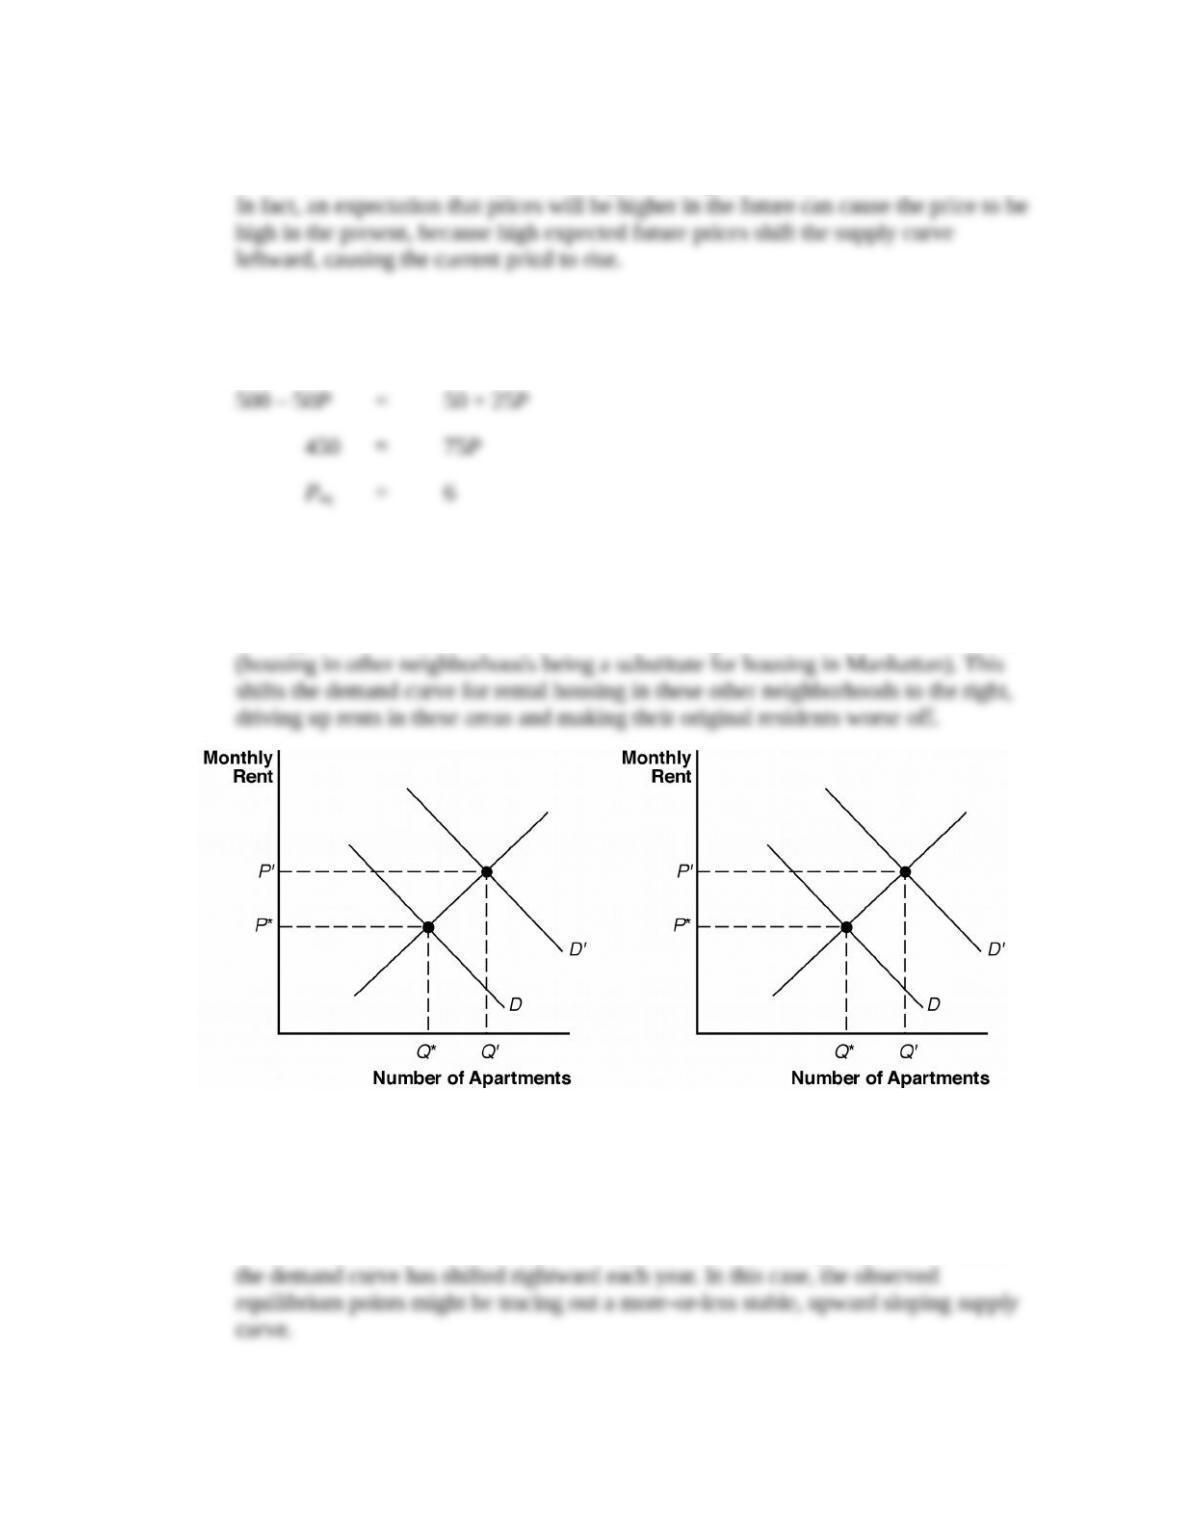
15. Set quantity demanded equal to quantity supplied:
Substitute for P in either equation to find that the equilibrium quantity is Qeq. = 200.
16. As people move to Manhattan due to its lower crime rate, the demand for rental
housing in Manhattan increases, leading to higher rents in Manhattan. People who can
no longer afford Manhattan rents move to other neighborhoods in the New York area
Apartments inManhattan Apartments in Other
Neighborhoods
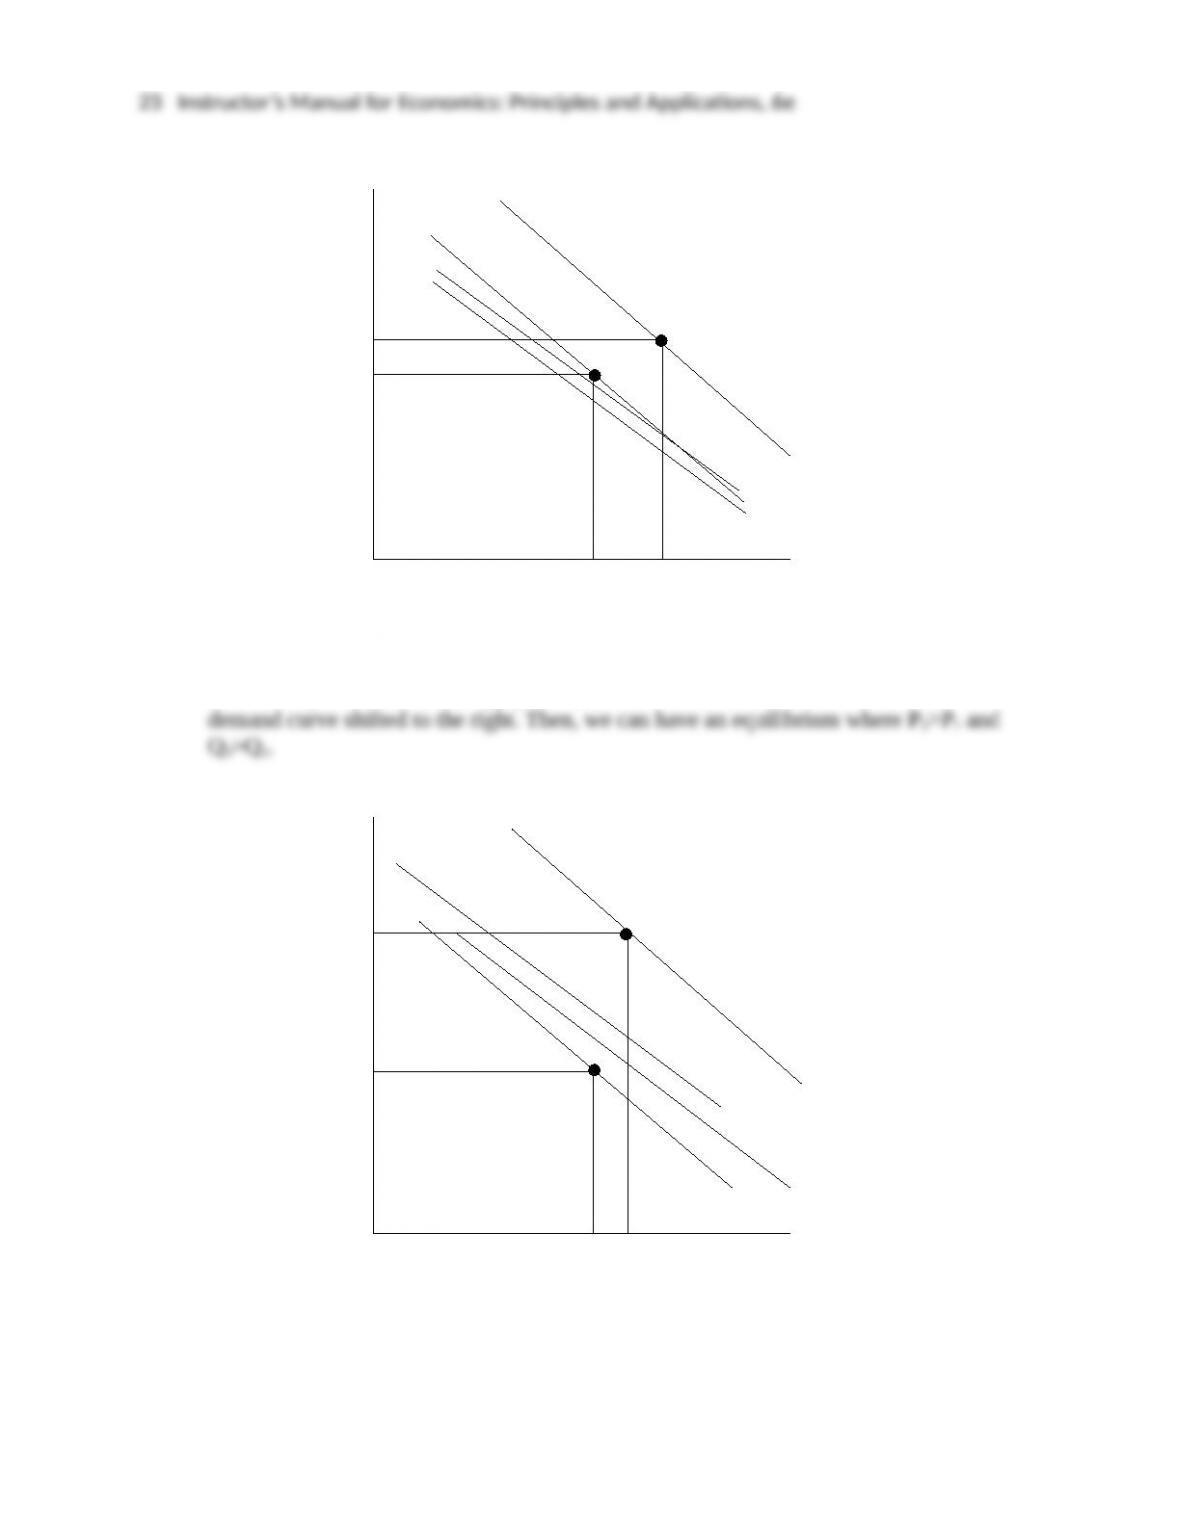
17. The key here is to realize that the analyst is observing different equilibrium points, not
necessarily points on the same demand curve. While an upward-sloping demand curve
in some markets is not a total impossibility, another, more likely, explanation is that
25 Instructor’s Manual for Economics: Principles and Applications, 6e
EXPERIENTIAL EXERCISES
1. Have students determine their market demand for gasoline. Make up a chart listing a
variety of prices per gallon of gasoline—$2.00, $2.25, $2.50, $2.75, $3.00, $3.25. Ask
a. Have each student plot their demand curve. Check to see whether their responses
are consistent with the law of demand.
2. Have students find a relevant current article in the Wall Street Journal and interpret it
using a supply and demand diagram. They should explain at least one situation in
which a curve shifts. What caused the shift, and how did it affect price and quantity?