
Solutions 8-38
8.42 (Fortune Brands; lower of cost or market; U.S. GAAP versus IFRS.)
a. No journal entry will be recorded because U.S. GAAP does not permit
firms to writeup the value of their inventory above its acquisition cost.
8-39 Solutions
8.42 continued.
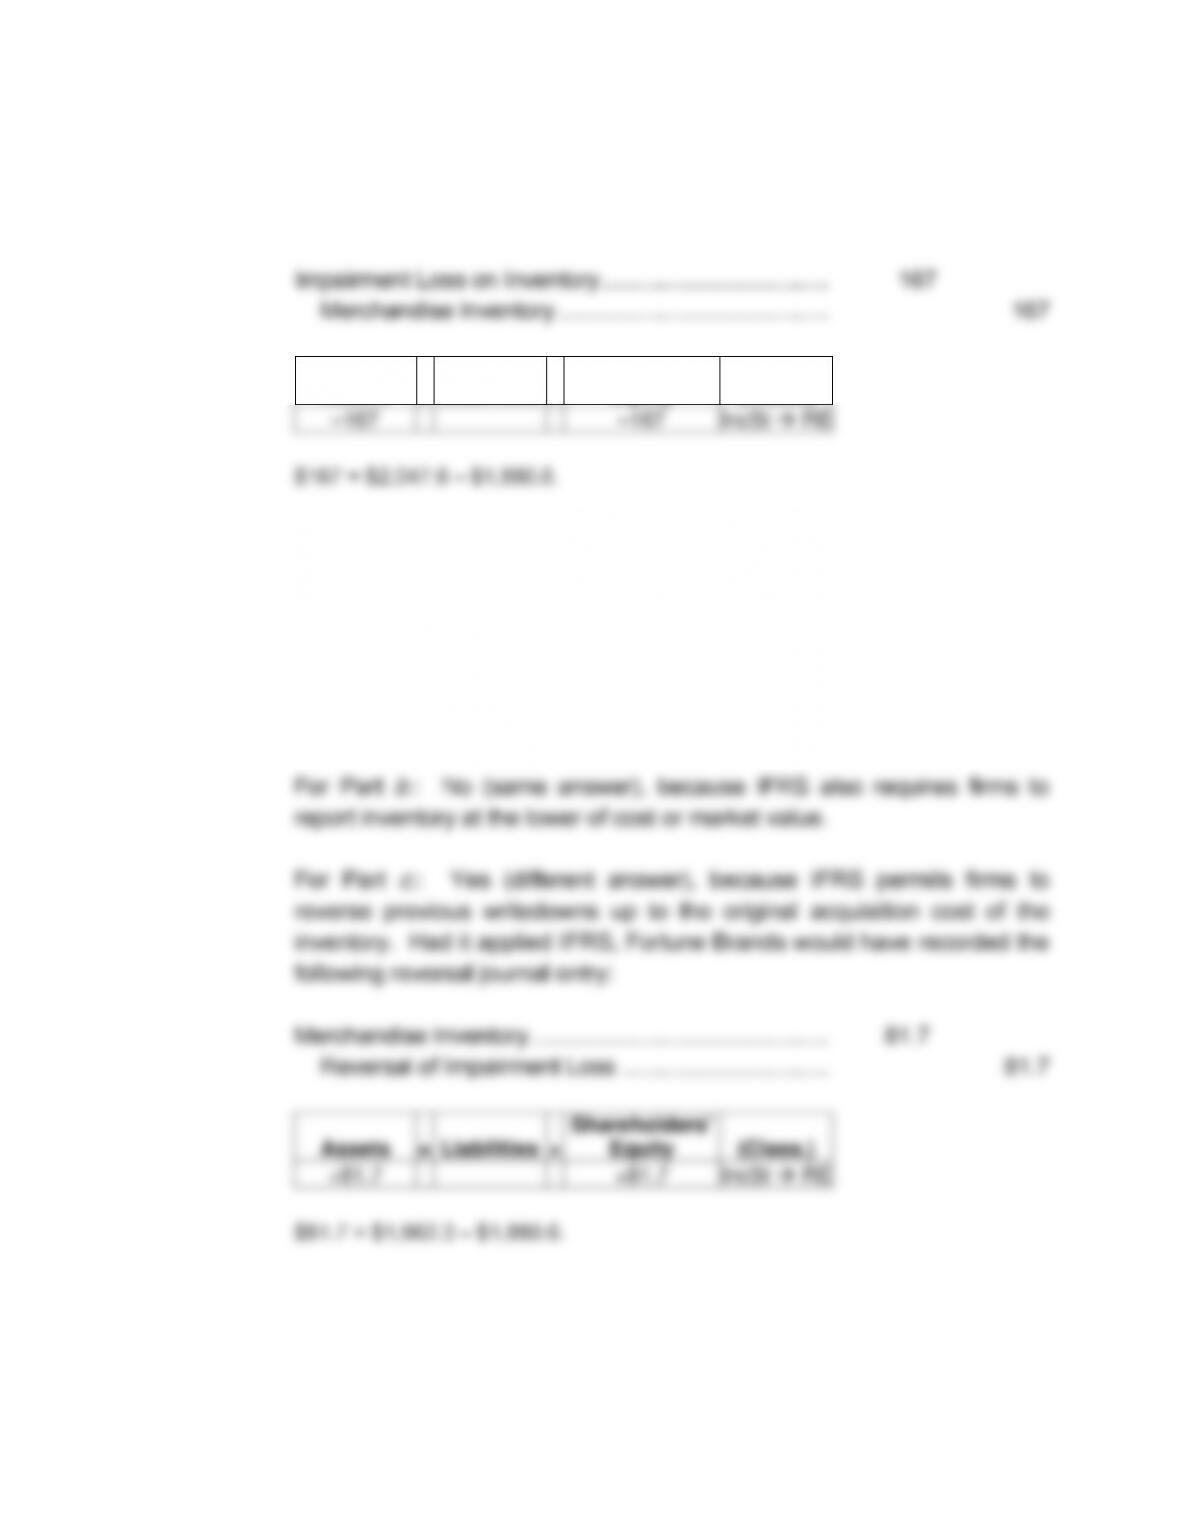
b. Journal Entry:
Assets
=
Liabilities
+
Shareholders’
Equity
(Class.)
–167
–167
IncSt → RE
$167 = $2,047.6 – $1,880.6.
c. No journal entry will be recorded because U.S. GAAP does not permit
firms to reverse previous writedowns of inventory.
d. If IFRS Were Used:
For Part
a
.: No (same answer), because IFRS does not permit firms to
writeup the value of their inventory above its acquisition cost.
Assets
=
Liabilities
+
Shareholders’
Equity
(Class.)
+81.7
+81.7
IncSt → RE
$81.7 = $1,962.3 – $1,880.6.
Solutions 8-40
8.43 (Burton Corporation; detailed comparison of various choices for inventory
accounting.)
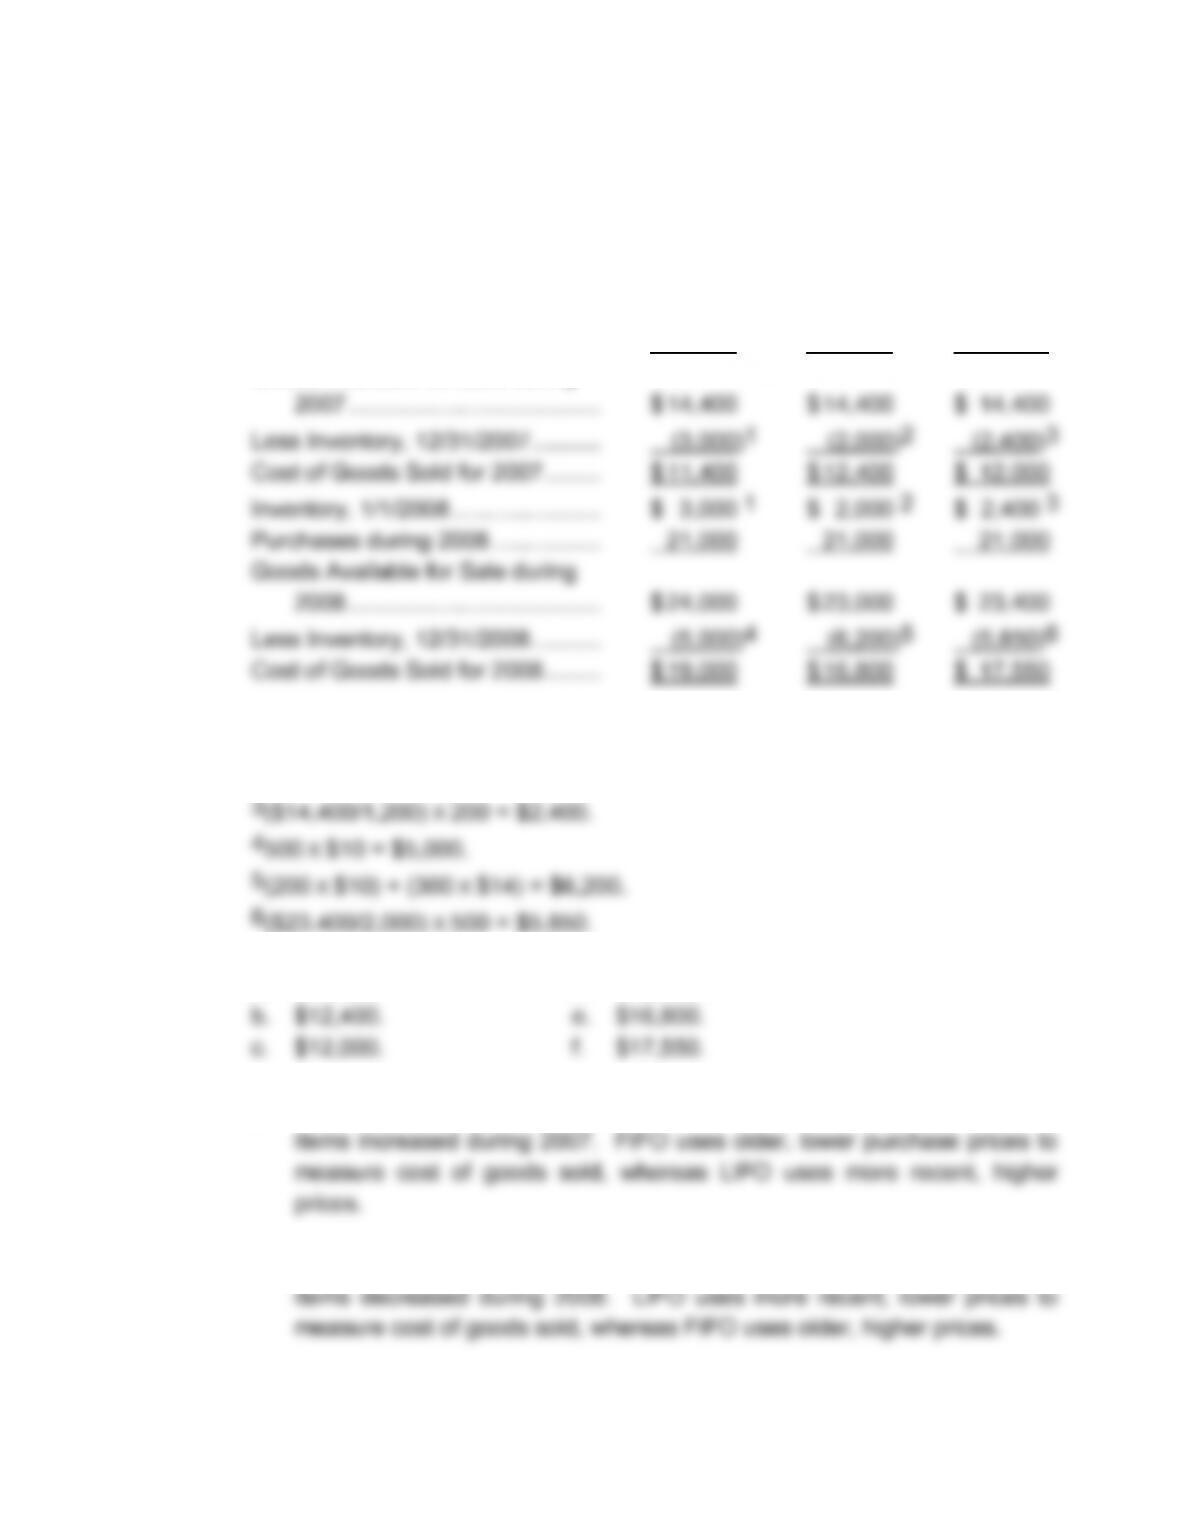
Weighted
FIFO LIFO Average
Inventory, 1/1/2007 ………………….. $ 0 $ 0 $ 0
Purchases during 2007 …………….. 14,400 14,400 14,400
Goods Available for Sale during
1200 X $15 = $3,000.
2200 X $10 = $2,000.
a. $11,400. d. $19,000.
g. FIFO results in higher net income for 2007. Purchase prices for inventory
h. LIFO results in higher net income for 2008. Purchase prices for inventory
8-41 Solutions
8.44 (Hanover Oil Products; effect of FIFO and LIFO on income statement and
balance sheet.)
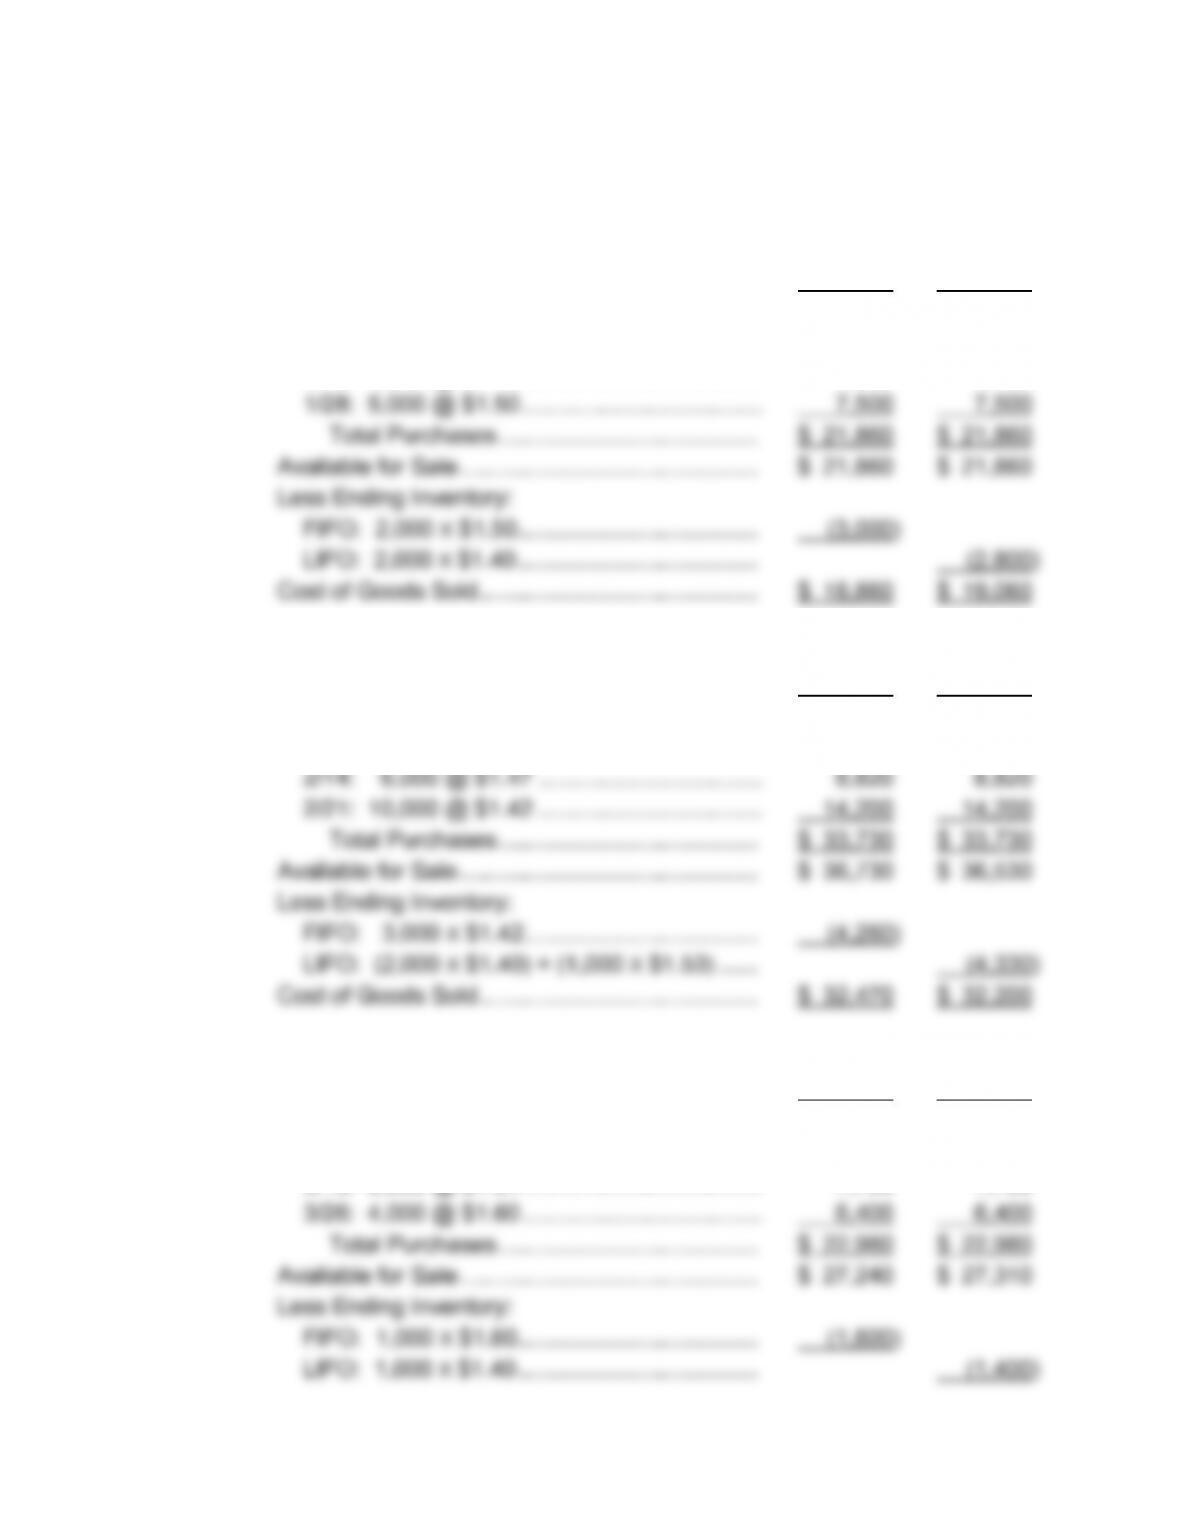
a. FIFO LIFO
Beginning Inventory …………………………………… $ 0 $ 0
Purchases:
1/1: 4,000 @ $1.40 … ……………………………. $ 5,600 $ 5,600
1/13: 6,000 @ $1.46 … ……………………………. 8,760 8,760
b. FIFO LIFO
Beginning Inventory …………………………………… $ 3,000 $ 2,800
Purchases:
2/5: 7,000 @ $1.53 . ….………………………… $ 10,710 $ 10,710
c. FIFO LIFO
Beginning Inventory …………………………………… $ 4,260 $ 4,330
Purchases:
3/2: 6,000 @ $1.48 … ……………………………. $ 8,880 $ 8,880
3/15: 5,000 @ $1.54 … ……………………………. 7,700 7,700
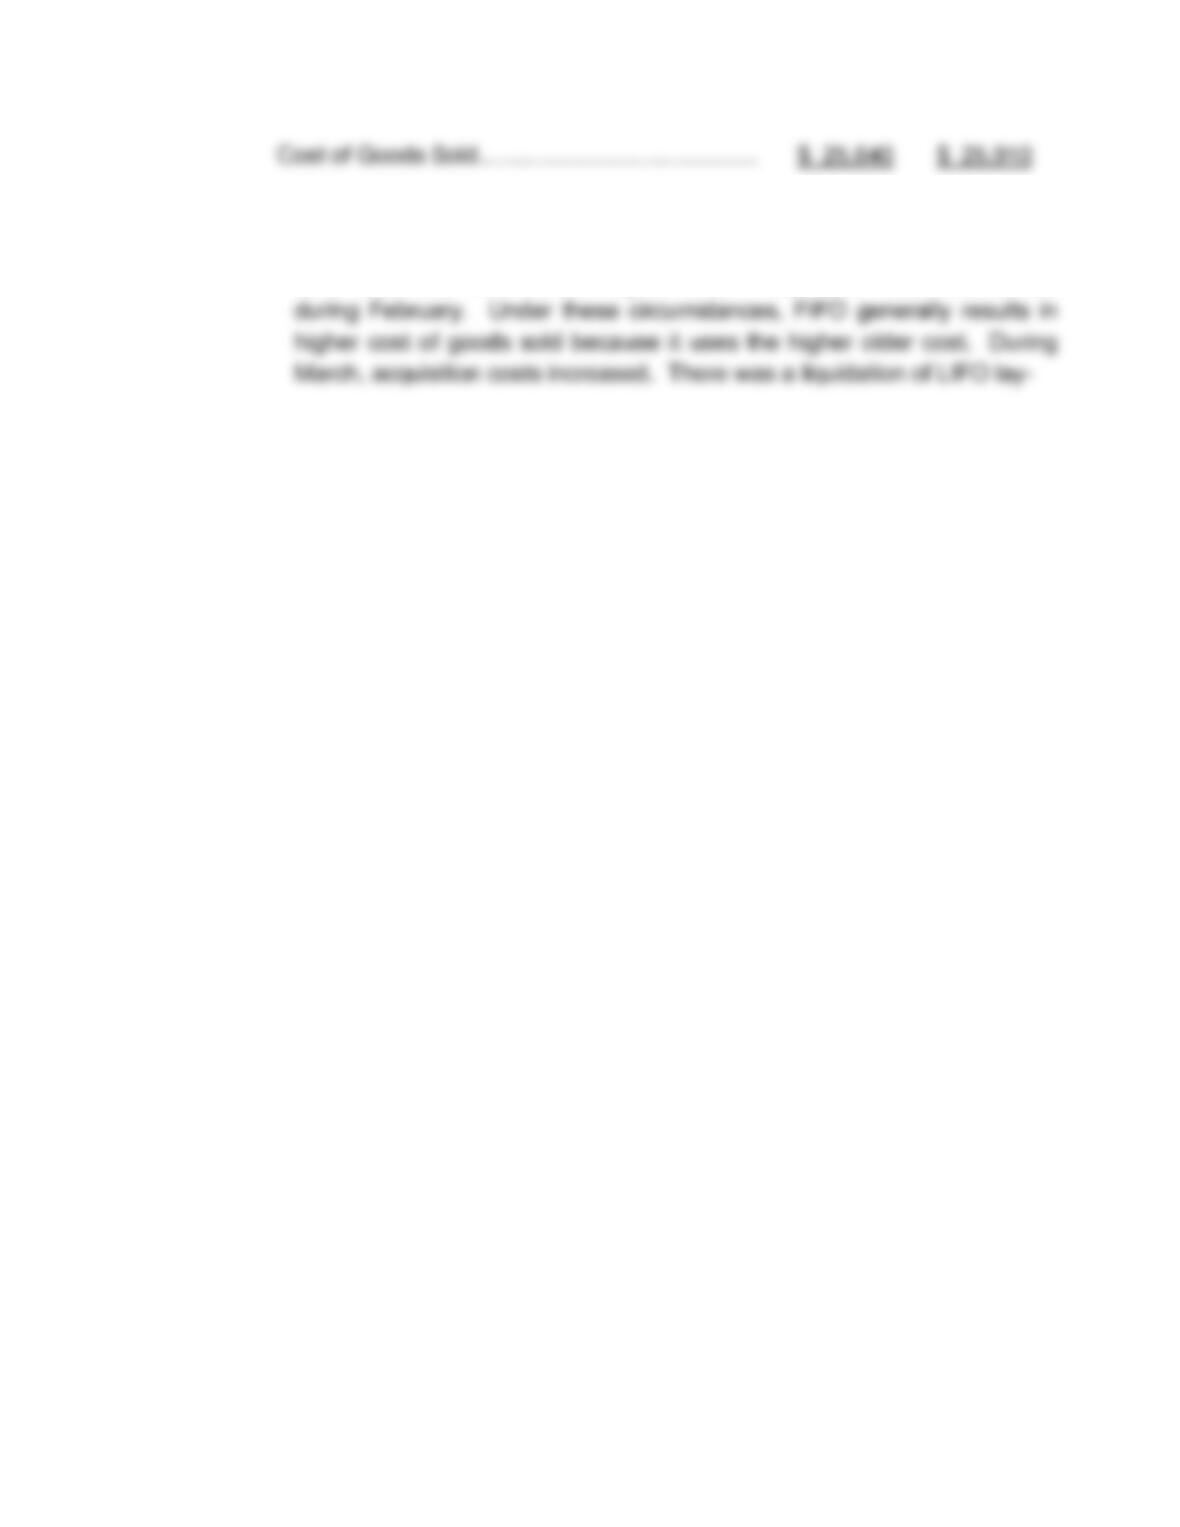
Solutions 8-42
d. Acquisition costs increased during January. During such periods, LIFO
generally provides larger cost of goods sold amounts than FIFO because
LIFO uses the most recent higher cost. Acquisition costs decreased
8-43 Solutions
8.44 d. continued.
e. January February March
FIFO LIFO FIFO LIFO FIFO LIFO
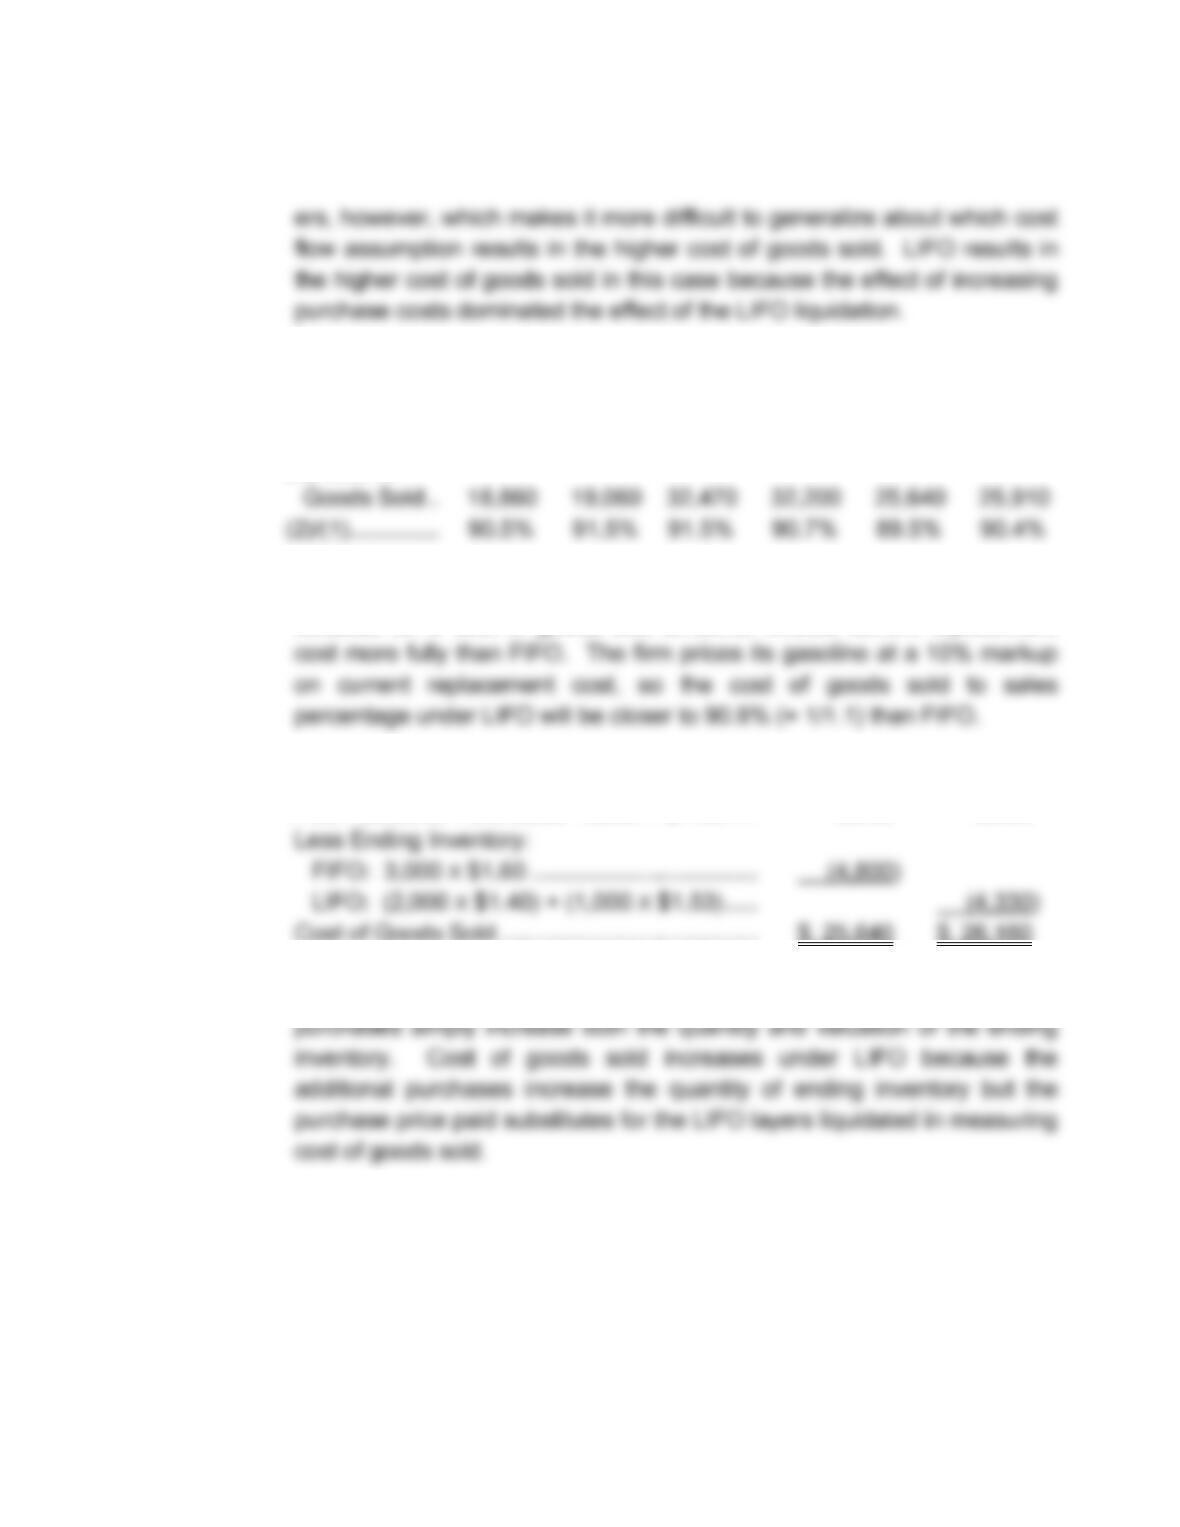
(1) Sales ……… $ 20,840 $ 20,840 $ 35,490 $ 35,490 $ 28,648 $ 28,648
(2) Cost of
f. LIFO provides the most stable cost of goods sold to sales percentage
because LIFO cost of goods sold amounts reflects current replacement
g. Available for Sale (from Part
c.
) ………………… $ 27,240 $ 27,310
Plus Additional Purchases: 2,000 X $1.60 ….. 3,200 3,200
Cost of Goods Sold …………………………………. $ 25,640 $ 26,180
Costs of goods sold will not change under FIFO because the additional
8.45 (Burch Corporation; reconstructing underlying events from ending inventory
amounts [adapted from CPA examination].)
a. Down. Notice that lower of cost or market is lower than acquisition cost
(FIFO); current market price is less than cost.
Solutions 8-44
8-45 Solutions
8.45 continued.
c. LIFO Cost. Other things being equal, the largest income results from the
method that shows the largest
increase
in inventory during the year.
d. Lower of Cost or Market. The method with the “largest increase in
e. Lower of Cost or Market. The method with the largest increase in
f. LIFO Cost. The lower income for all three years results from the method
g. FIFO lower by $2,000. Under FIFO, inventories increased $8,000 during
8.46 (Wilson Company; LIFO layers influence purchasing behavior and provide
opportunity for income manipulation.)
Cost
Solutions 8-46
Cost Cost Cost Cost Sold
per Pound Layer ($000) ($000) Pounds ($000) ($000)
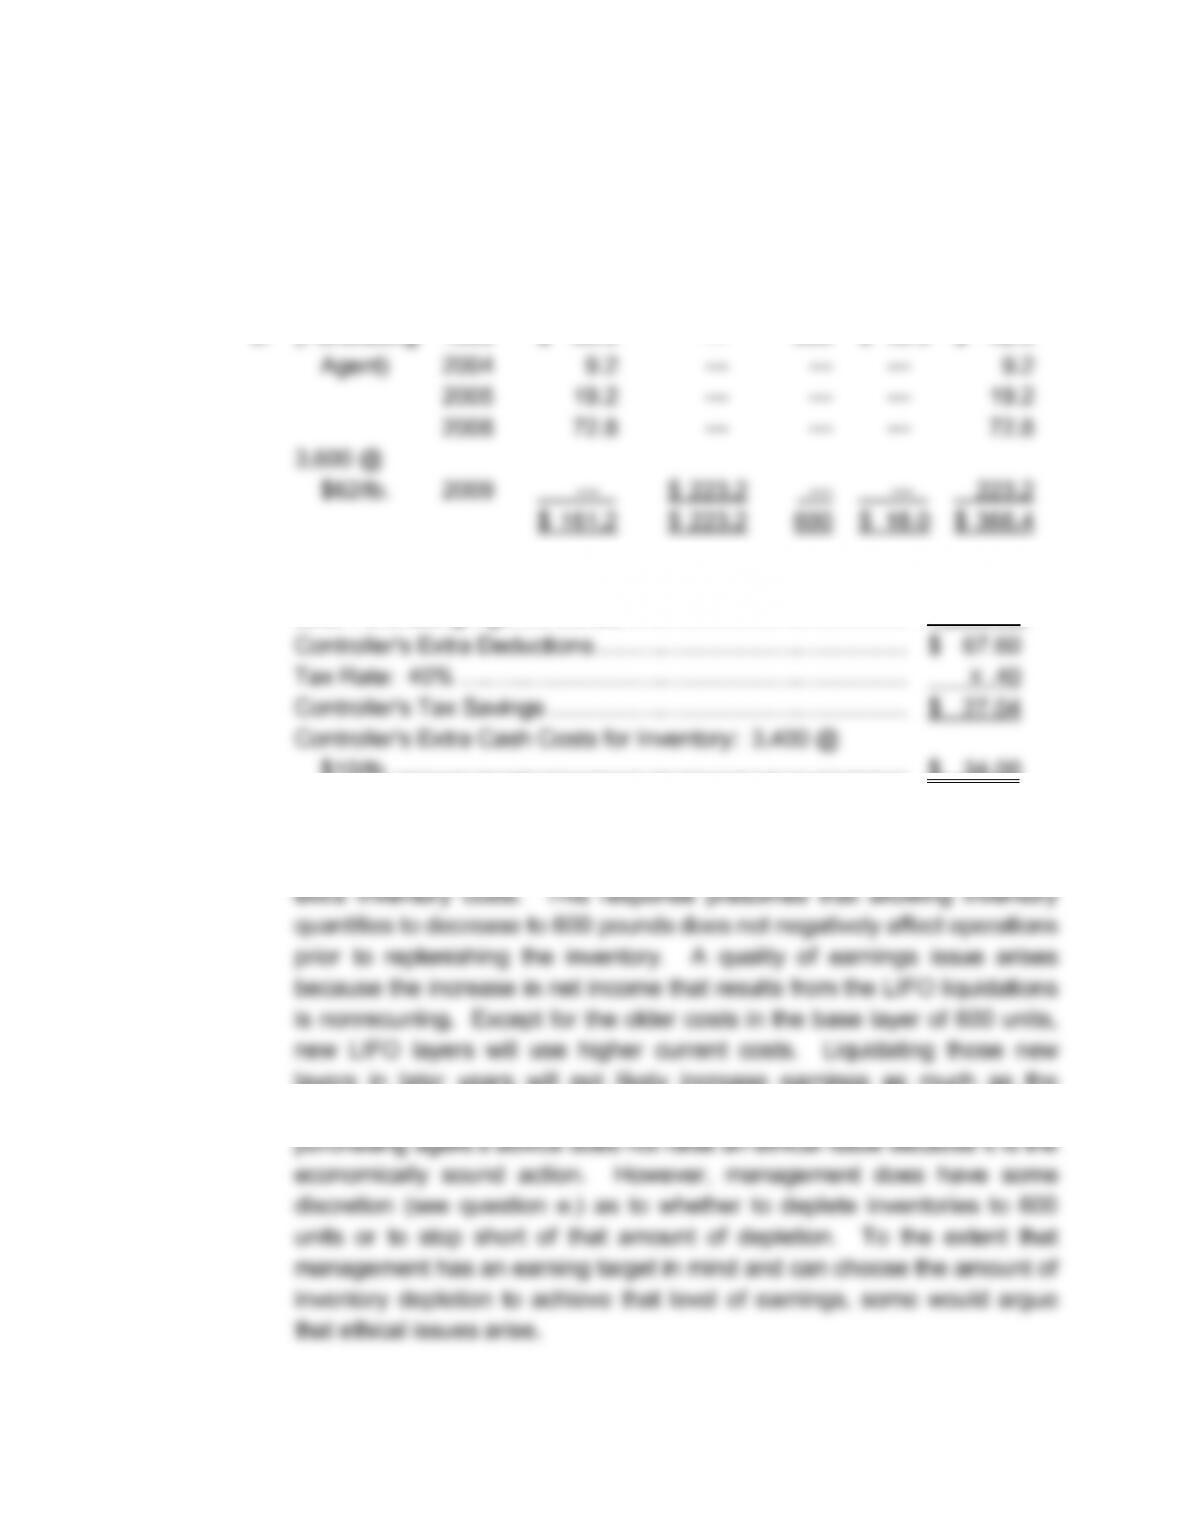
a. (Controller) 1999 $ 60.0 — 2,000 $ 60.0 —
2004 9.2 — 200 9.2 —
8-47 Solutions
8.46 continued.
Cost
Beginning of
Inventory + Purchases – Ending Inventory = Goods
Cost Cost Cost Cost Sold
per Pound Layer ($000) ($000) Pounds ($000) ($000)
b. (Purchasing 1999 $ 60.0 — 600 $ 18.0 $ 42.0
c. Controller’s Policy COGS $62/lb. …………………………………… $ 434.00
Less Purchasing Agent’s COGS ……………………………………. (366.40)
$10/lb. ……………………………………………………………………. $ 34.00
d. The economically sound action is to follow the purchasing agent’s advice.
The controller’s policy does save taxes but not as much in taxes as the
layers in later years will not likely increase earnings as much as the
current year’s liquidations produced. One might argue that following the
Solutions 8-48
8.46 continued.
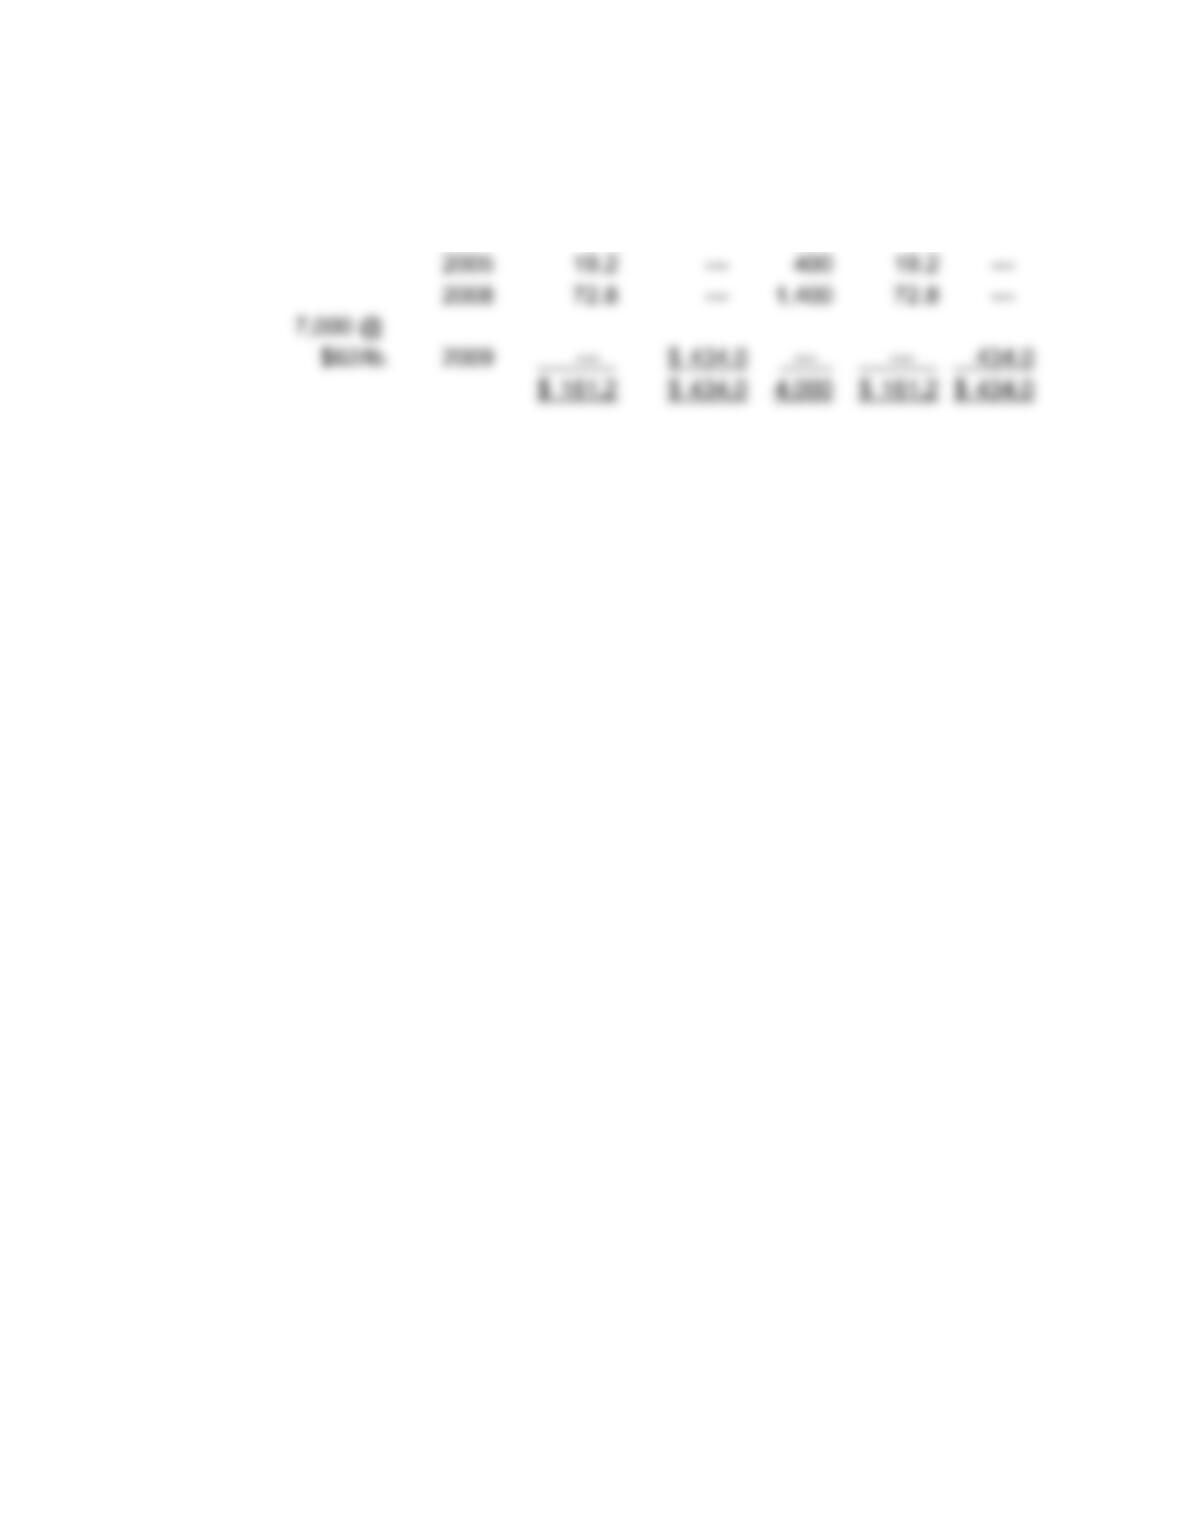
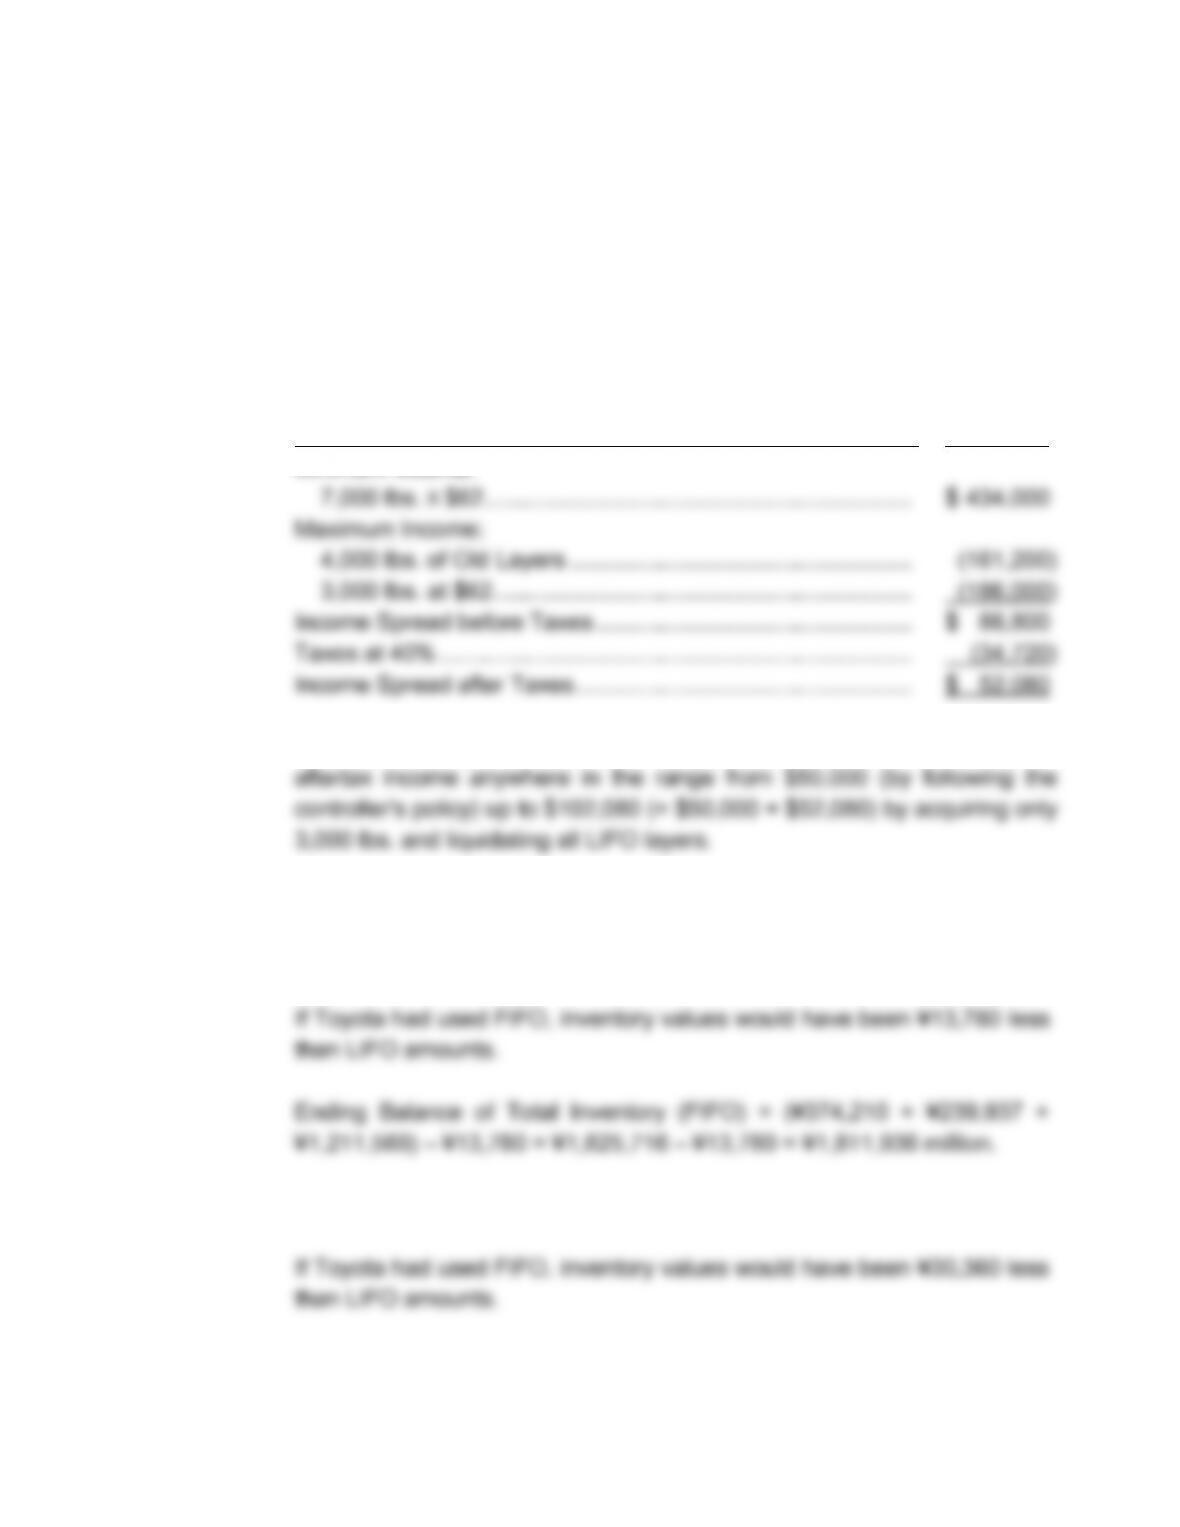
e. To maximize income for 2009, liquidate all our LIFO inventory layers,
4,000 lbs. with total cost $161,200, and purchase only 3,000 lbs. at $62
each during 2009. To minimize income, acquire 7,000 lbs. at $62 each.
Cost of
Goods
Sold for
Policy 2009
Minimum Income:
By manipulating purchases of expensium, Wilson Company reports
8.47 (Toyota; interpreting inventory disclosures.)
a. March 31, 2008:
March 31, 2007:

8-49 Solutions
Solutions 8-50
8.47 continued.
b. Beginning Balance in Finished Goods (FIFO) + Cost of Units Completed
= Cost of Products Sold (FIFO) + Ending Balance in Finished Goods
(FIFO).
Also, could calculate as follows:
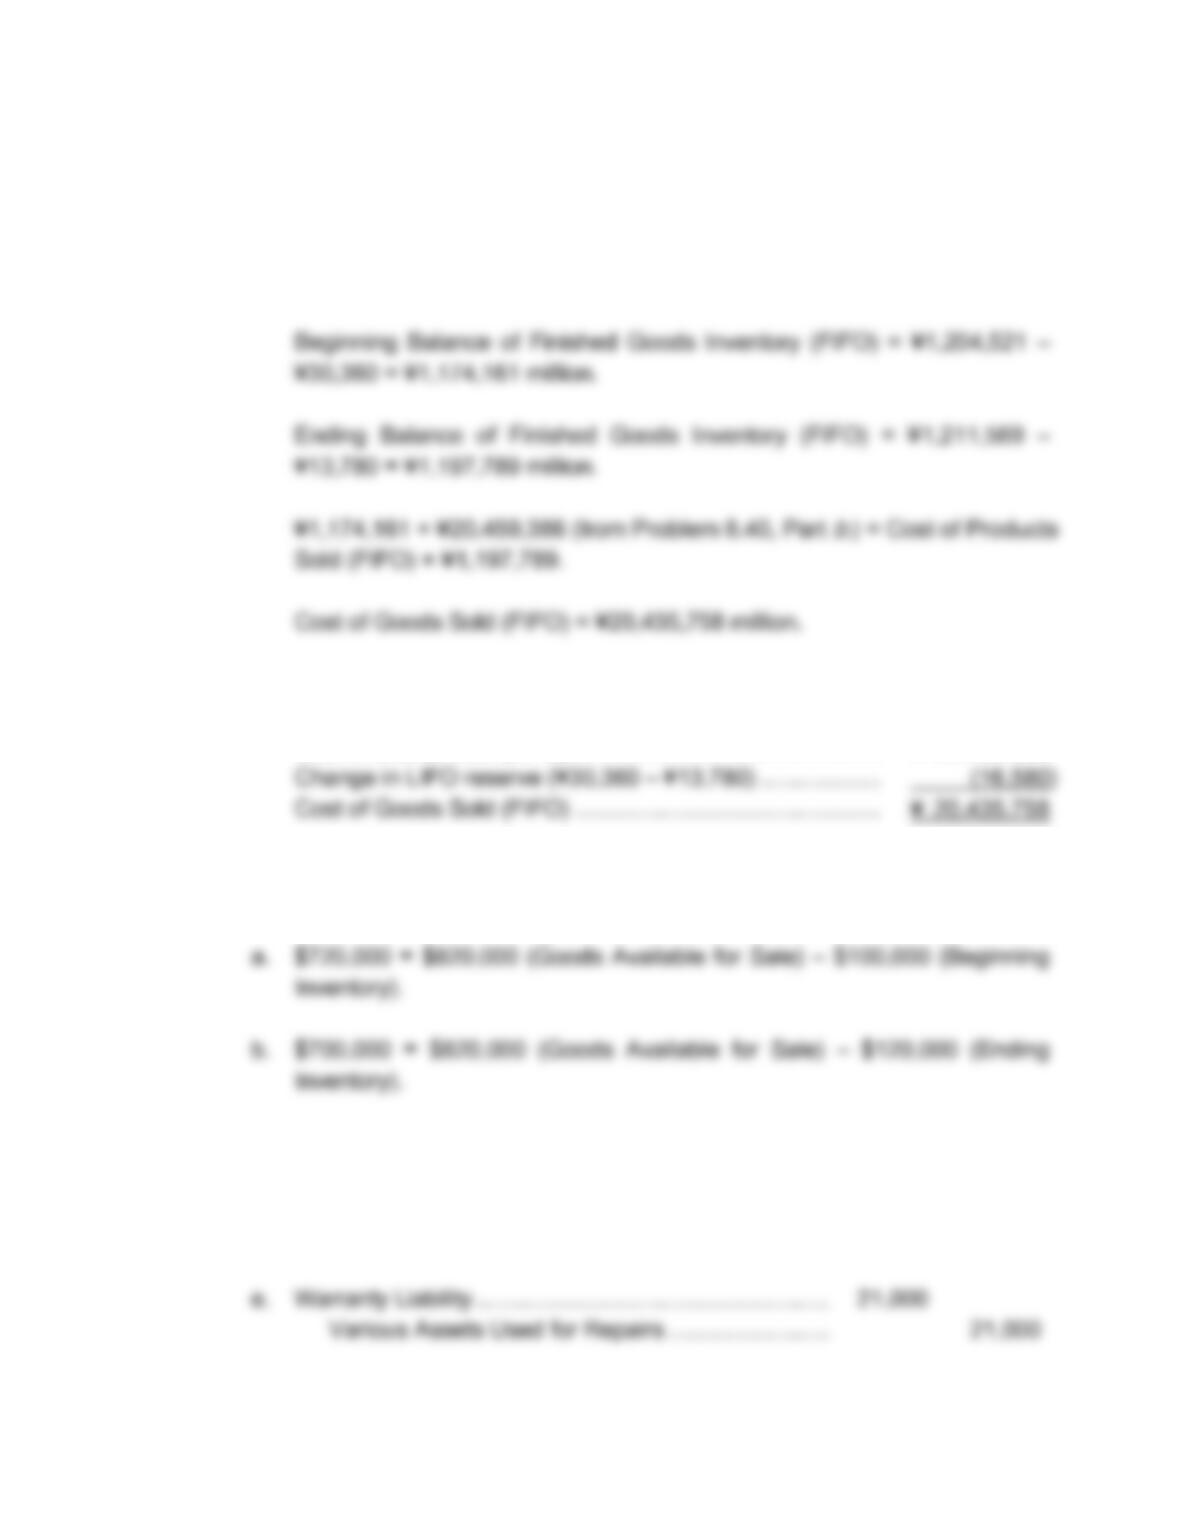
Cost of Goods Sold (LIFO) ………………………………………… ¥ 20,452,338
8.48 (Central Appliance; allowance method for warranties; reconstructing
transactions.)
c. $21,000 = $6,000 (Cr. Balance) + $15,000 (Dr. Balance).
d. $20,000 = $5,000 (Required Cr. Balance) + $15,000 (Existing Dr.
Balance).
8-51 Solutions
Assets
=
Liabilities
+
Shareholders’
Equity
(Class.)
–21,000
–21,000
Repairs made during 2008.
Solutions 8-52
8.48 e. continued.
Warranty Expense …………………………………………….. 20,000
Warranty Liability …………………………………………. 20,000
Assets
=
Liabilities
+
Shareholders’
Equity
(Class.)
+20,000
–20,000
IncSt → RE
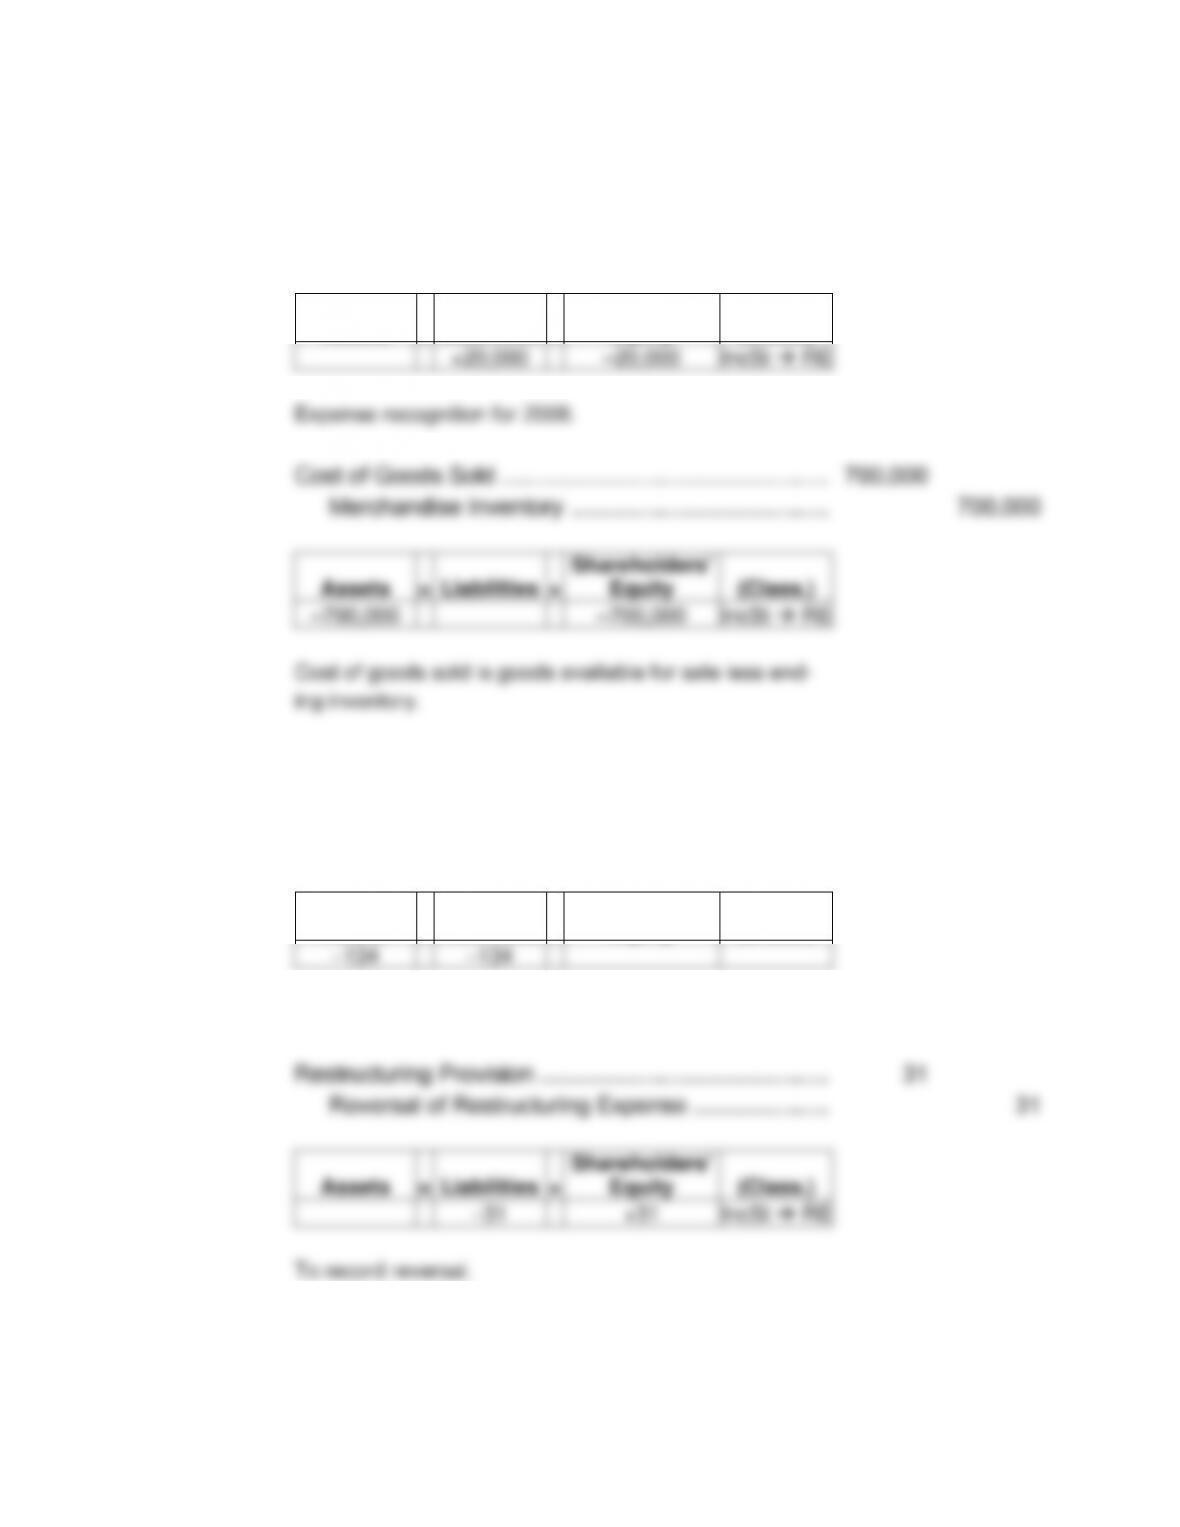
Assets
=
Liabilities
+
Shareholders’
Equity
(Class.)
–700,000
–700,000
IncSt → RE
Cost of goods sold is goods available for sale less end-
ing inventory.
8.49 (Bayer Group; interpreting restructuring disclosures.)
a. Restructuring Provision ……………………………………… 134
Cash ………………………………………………………….. 134
Assets
=
Liabilities
+
Shareholders’
Equity
(Class.)
–134
–134
To record utilizations.
Assets
=
Liabilities
+
Shareholders’
Equity
(Class.)
–31
+31
IncSt → RE
To record reversal.
8-53 Solutions
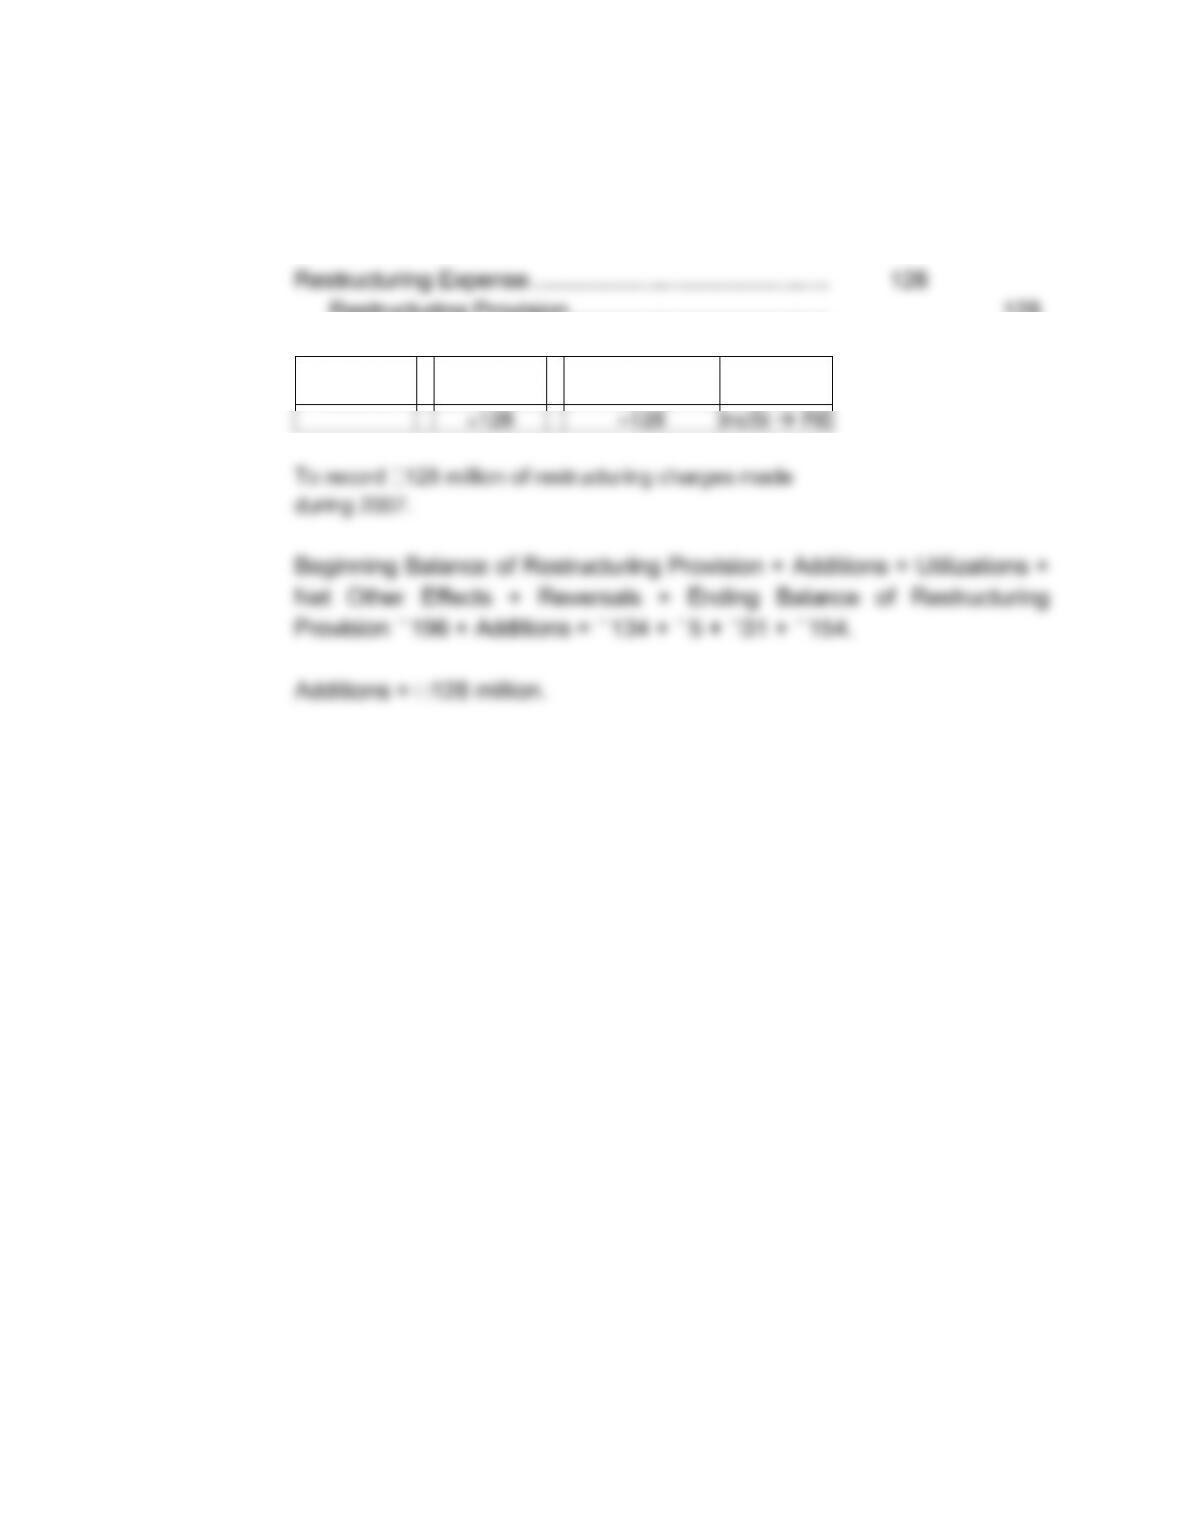
8.49 continued.
b. Journal entry to record additions to Restructuring Provision during 2007:
Restructuring Provision …………………………………. 128
Assets
=
Liabilities
+
Shareholders’
Equity
(Class.)
+128
–128
IncSt → RE