6-41 Solutions
Solutions 6-42
6.28 continued.
d. Carrefour is the most risky, with Target Corporation and Wal-Mart
showing low levels of risk.
Short-term Liquidity Risk: Carrefour has the lowest current ratios
and those ratios are significantly less than 1.0. Its cash flow from
Long-term Liquidity Risk: Carrefour’s ratios are not at healthy
6.29 (The Gap and Limited Brands; calculating and interpreting profitability
and risk ratios.)
The financial statement ratios on pages 6-29, 6–30, and 6-31 form the
basis for the responses to the questions raised.
a. Limited Brands has a higher ROA in the fiscal year ended January
31, 2008, the result of a higher profit margin for ROA, offset by a
6-43 Solutions
Solutions 6-44
6.29 a. continued.
The slower total asset turnover of Limited Brands is not due to
either inventories or fixed assets, because Limited Brands has faster
b. The current and quick ratios vary considerably between fiscal 2007
c. Limited Brands has higher levels of debt than The Gap. Its cash flow
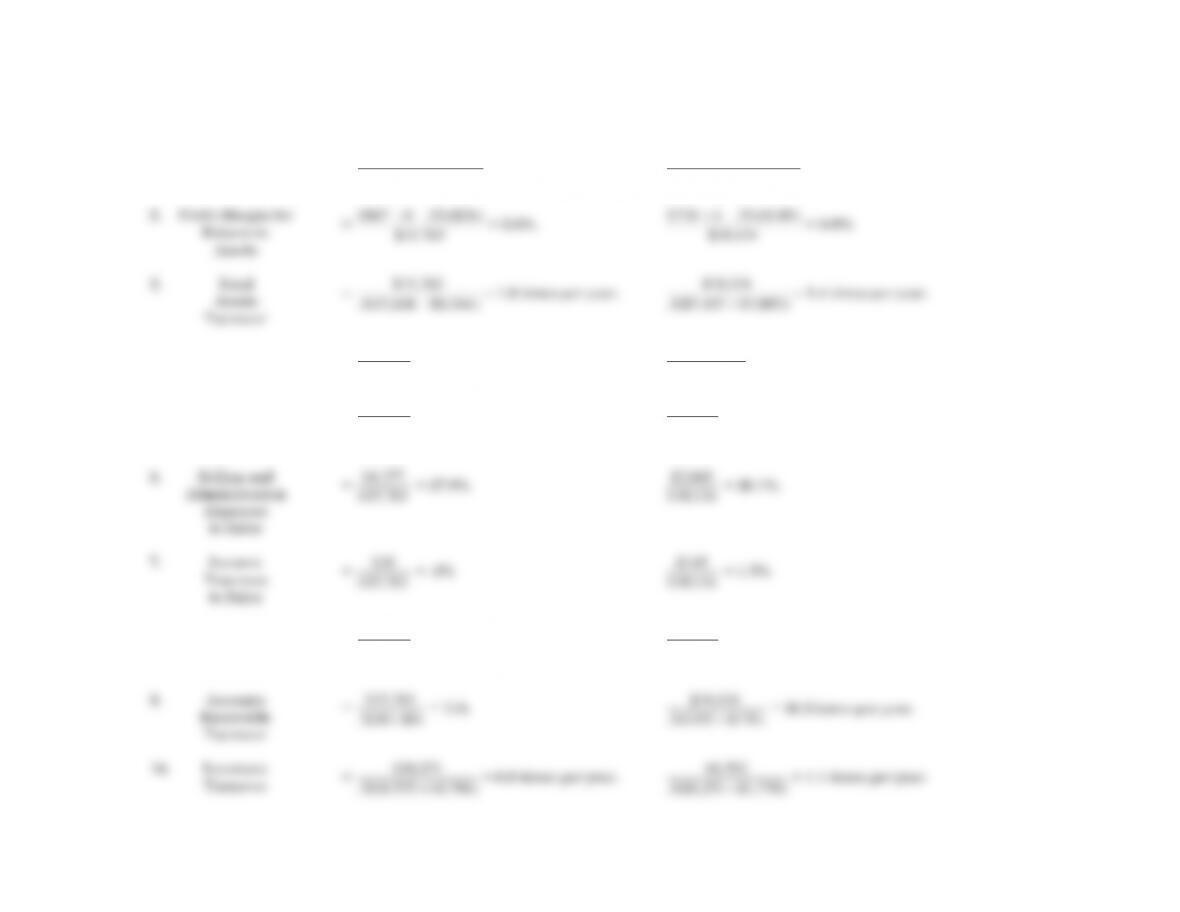
6.29 continued.
The Gap Limited Brands
1. Rate of Return
on Assets
=
$867 +(1 −.35)($26)
.5($7,838 +$8,544)
= 10.8%.
$718 +(1 −.35)($149)
.5($7,437 +$7,093)
= 11.2%.
2. Profit Margin for
Return on
Assets
=
$867 +(1 −.35)($26)
$15,763
= 5.6%.
$718 +(1 −.35)($149)
$10,134
= 8.0%.
3. Total
Assets
Turnover
=
$15,763
.5($7,838 +$8,544)
= 1.9 times per year.
$10,134
.5($7,437 +$7,093)
= 1.4 times per year.
4. Other Revenues/Sales
=
$117
$15,763
= .7%.
($146 +230)
$10,134
= 3.7%.
5. Cost of
Goods Sold
to Sales
=
$10,071
$15,763
= 63.9%.
$6,592
$10,134
= 65.0%.
6. Selling and
Administration
Expenses
to Sales
=
$4,377
$15,763
= 27.8%.
$2,640
$10,134
= 26.1%.
7. Interest
Expenses
to Sales
=
$26
$15,763
= .2%.
$149
$10,134
= 1.5%.
8. Income Tax
Expenses
to Sales
=
$539
$15,763
= 3.4%.
$411
$10,134
= 4.1%.
9. Accounts
Receivable
Turnover
=
$15,763
.5($0+$0)
= N/A.
$10,134
.5($355 +$176 )
= 38.2 times per year.
10. Inventory
Turnover
=
$10,071
.5($1,575 +$1,796 )
= 6.0 times per year.
$6,592
.5($1,251 +$1,770 )
= 4.4 times per year.
6.29 continued.
11. Fixed
Asset
Turnover
=
$15,763
.5($3,267 +$3,197)
= 4.9 times per year.
$10,134
.5($1,862 +$1,862 )
= 5.4 times per year.
12. Rate of
Return on
Common
Shareholders’
Equity
=
$867
.5($4,274 +$5,174)
= 18.4%.
$718
.5($2,219 +$2,955)
= 27.8%.
13. Profit Margin for
Return on Common
Shareholders’
Equity
=
$867
$15,763
= 5.5%.
$718
$10,134
= 7.1%.
14. Capital Structure
Leverage Ratio
=
.5($7,838 +$8,544)
.5($4,274 +$5,174 )
= 1.7.
.5($7,437 +$7,093)
.5($2,219 +$2,955)
= 2.8.
15. Current Ratio:
January 31, 2007
=
$5,029
$2,272
= 2.2.
$2,771
$1,709
= 1.6.
January 31, 2008
=
$4,086
$2,433
= 1.7.
$2,919
$1,374
= 2.1.
16. Quick Ratio:
January 31, 2007
=
$2,644
$2,272
= 1.2.
($500 +$176 )
$1,709
= .4.
January 31, 2008
=
$1,939
$2,433
= .8.
($1,018 +$355 )
$1,374
= 1.0.
17. Days Accounts
Receivable
=
365
0
= N/A.
365
38.2
= 9.6.
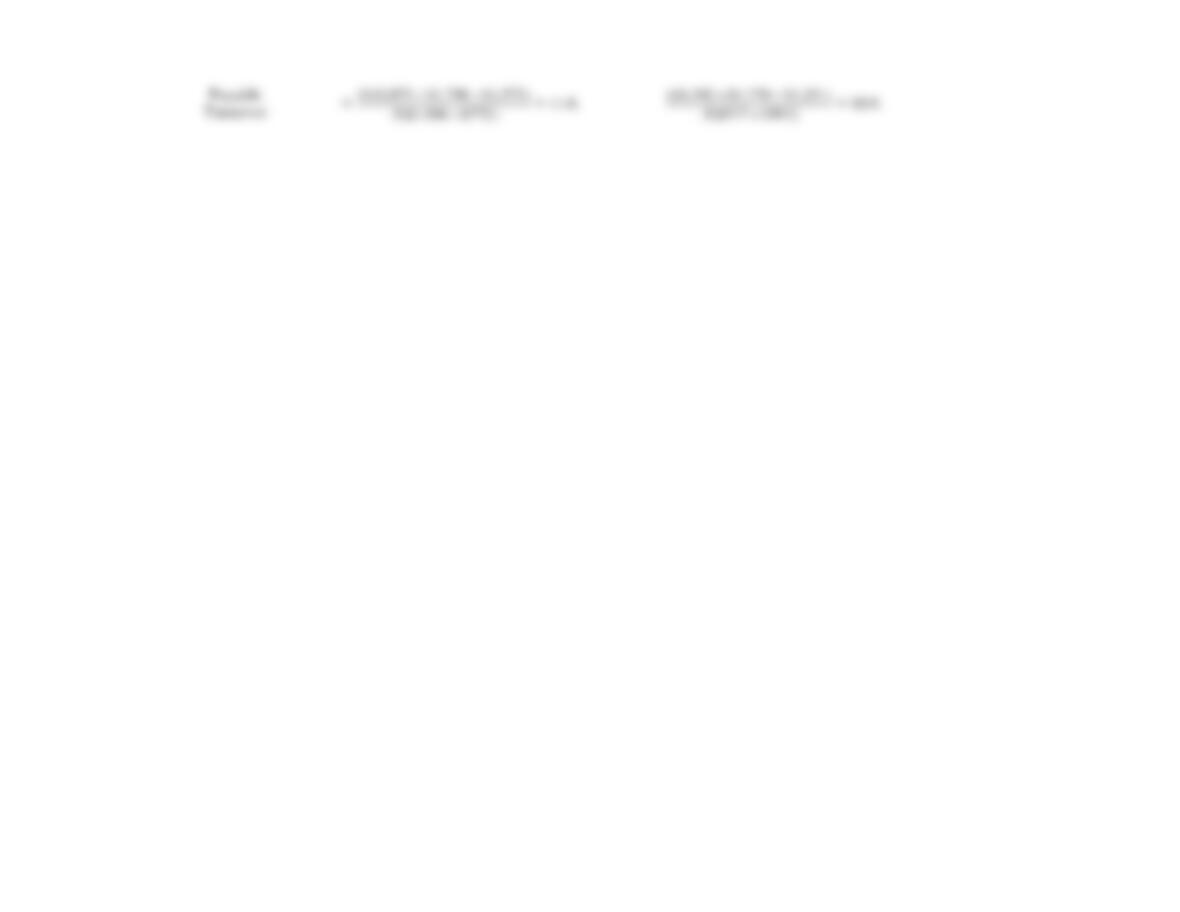
18. Days Inventory
=
365
4.1
= 89.0 .
365
4.4
= 83.0.
19. Accounts
6-47 Solutions
Payable
Turnover
=
($10,071 +$1,796 −$1,575)
.5($1,006 +$772 )
= 11.6.
($6,592 +$1,770 −$1,251)
.5($517 +$593)
= 12.8.
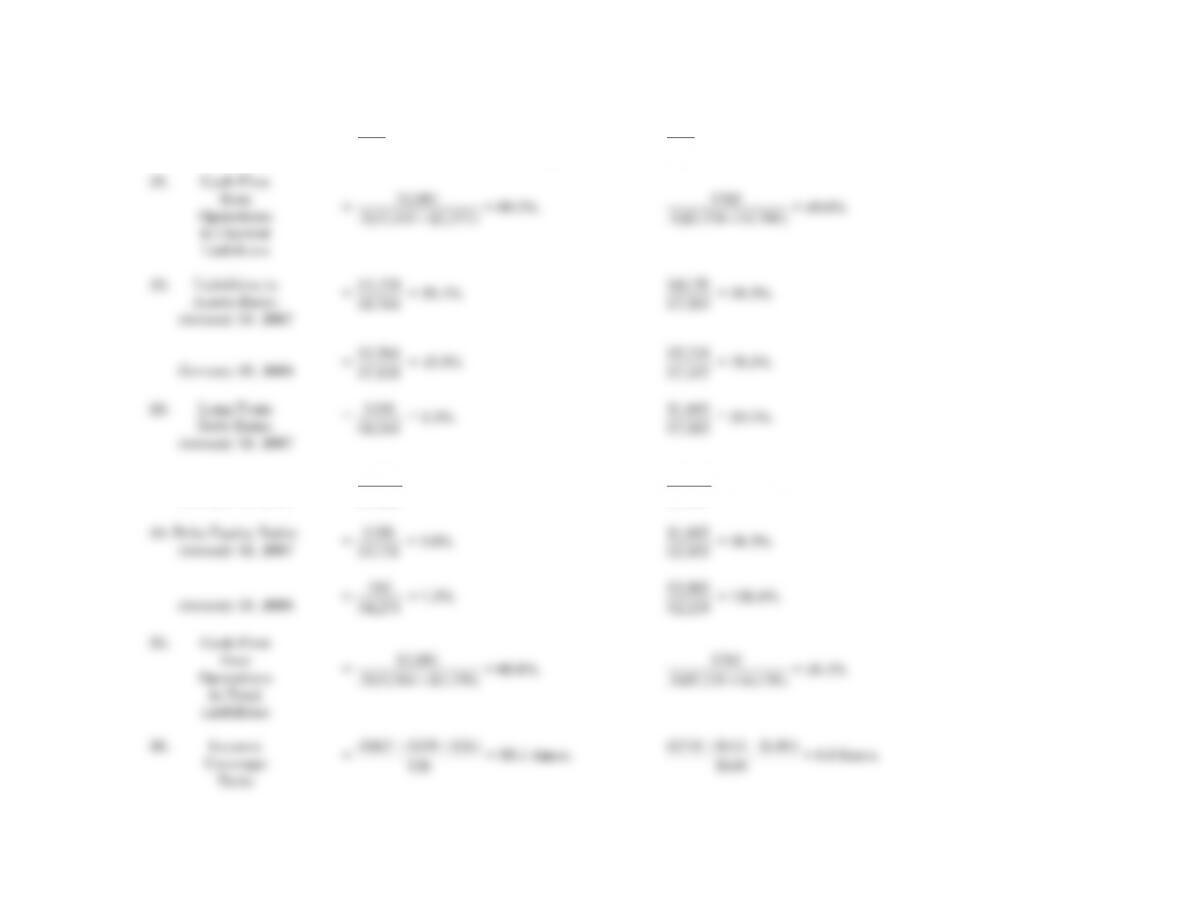
6.29 continued.
20. Days Accounts
Payable
=
365
11.6
= 31.5.
365
12.8
= 28.5.
21. Cash Flow
from
Operations
to Current
Liabilities
=
$2,081
.5($2,433 +$2,272)
= 88.5%.
$765
.5($1,374 +$1,709 )
= 49.6%.
22. Liabilities to
Assets Ratio:
January 31, 2007
=
$3,370
$8.544
= 39.4%.
$4,138
$7,093
= 58.3%.
January 31, 2008
=
$3,564
$7,838
= 45.5%.
$5,218
$7,437
= 70.2%.
23. Long-Term
Debt Ratio:
January 31, 2007
=
$188
$8,544
= 2.2%.
$1,665
$7,093
= 23.5%.
January 31, 2008
=
$50
$7,838
= .6%.
$2,905
$7,437
= 39.1%.
24. Debt-Equity Ratio:
January 31, 2007
=
$188
$5,174
= 3.6%.
$1,665
$2,955
= 56.3%.
January 31, 2008
=
$50
$4,274
= 1.2%.
$2,905
$2,219
= 130.9%.
25. Cash Flow
from
Operations
to Total
Liabilities
=
$2,081
.5($3,564 +$3,370)
= 60.0%.
$765
.5($5,218 +$4,138)
= 16.4%.
26. Interest
Coverage
Ratio
=
($867 +$539 +$26)
$26
= 55.1 times.
($718 +$411 +$149)
$149
= 8.6 times.
6-49 Solutions
Solutions 6-50
6.30 (GlaxoSmithKline plc; interpreting profitability and risk ratios.)
a. The increasing profit margin for ROA results from an increase in the
investment income to sales percentage and to a decrease in the selling
b. The decreased total assets turnover in 2007 results from declines in
the accounts receivable, inventory, and fixed asset turnovers. Sales
c. Financial leverage works to the advantage of the common
shareholders whenever the rate of return on assets exceeds the after–
tax cost of borrowing. Because ROCE exceeds ROA, ROA must exceed
d. The slower accounts receivable and inventory turnovers should have
led to an increase in these current assets. A decline in the current
e. The two cash flow ratios declined between 2005 and 2006 and
increased between 2006 and 2007. The debt ratios indicate that both
total debt and long–term debt decreased between 2005 and 2006 and
6-51 Solutions
Solutions 6-52
6.31 (Scania; interpreting profitability and risk ratios.)
a. The increase in the profit margin for ROA results from decreases in
the cost of goods sold to sales percentage and the selling and
administrative expense to sales percentage. Both of these expenses
b. Economies of scale (see the discussion in Part a. above) explains the
decreased cost of goods sold to sales percentage but not the increasing
inventory turnover. Any benefits from economies of scale affect both
the numerator and denominator of the inventory turnover ratio. One
c. The growth rate in sales in 2007 was higher than in 2005 and 2006.
Perhaps Scania had geared its productive capacity for 2007 for sales
d. Scania must have experienced increases in cash, investments, or other
e. Cash flow from operations likely increased as a result of the increase
in the accounts receivable and inventory turnovers and the decrease
6-53 Solutions
6.31 continued.
f. The increase in the accounts receivable and inventory turnovers
moderated the increase in current assets for these two items, thereby
affecting the numerator of these ratios. The firm might have sold
g. Financial leverage works to the advantage of the common
shareholders whenever the rate of return on assets exceeds the after-
6.32 (Detective analysis; identify company.)
There are various approaches to this exercise. One approach begins with
a particular company, identifies unique financial characteristics (for
teaching note employs both approaches.
6.32 continued.
Firm (12)—The high proportions of cash, marketable securities, and
receivables for Firm (12) suggest that it is Fortis, the Dutch insurance and
banking company. Insurance companies receive cash from premiums each
earnings.
Firms (2), (3), (5), and (9)—There are four firms with research and
combination.
Roche Holding and Sun Microsystems are more technology oriented
and therefore likely to have a higher percentage of R&D to sales. This
suggests that they are Firms (2) and (9) in some combination. The
6-55 Solutions