
6-21 Solutions
Solutions 6-22
6.22 b. continued.
Accounts Receivable Turnover Ratio
Accounts Receivable
Year Numerator Denominator Turnover Ratio
Inventory Turnover Ratio
Inventory
Year Numerator Denominator Turnover Ratio
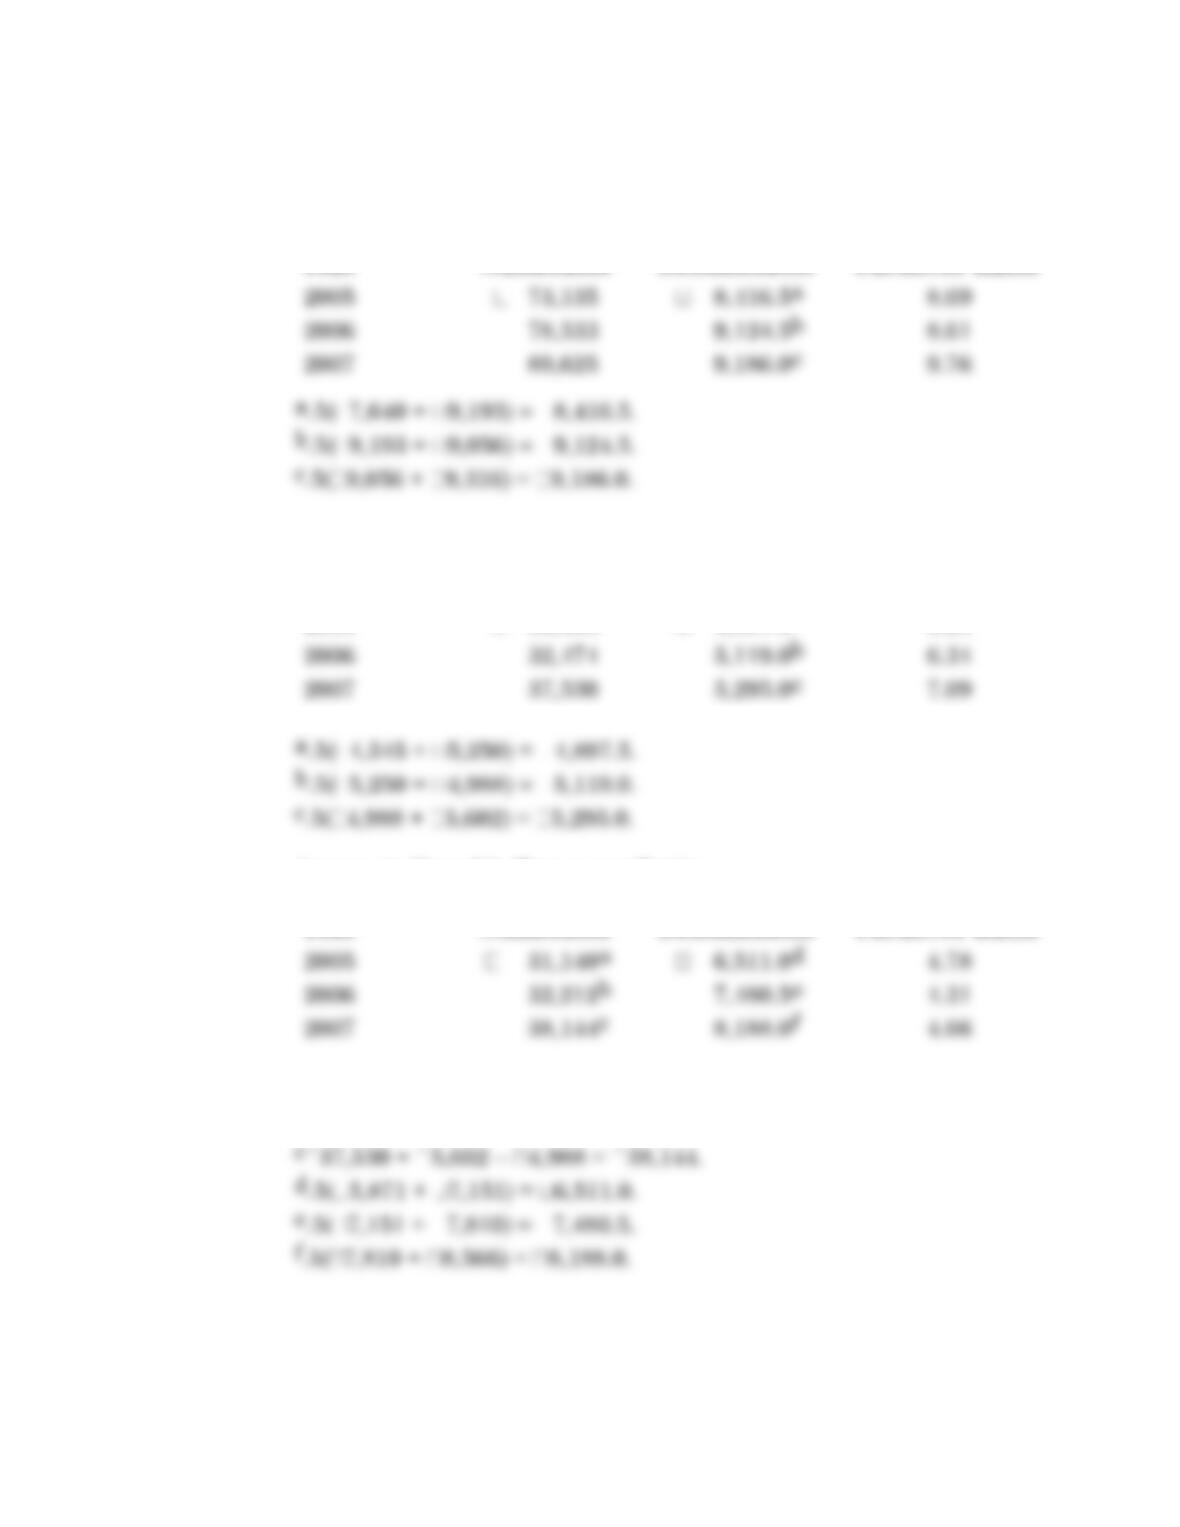
2005 30,435 4,897.5a 6.21
Accounts Payable Turnover Ratio
Accounts Payable
Year Numerator Denominator Turnover Ratio
a30,435 + 5,250 – 4,545 = 31,140.
b32,474 + 4,988 – 5,250 = 32,212.
6-23 Solutions
6.22 continued.
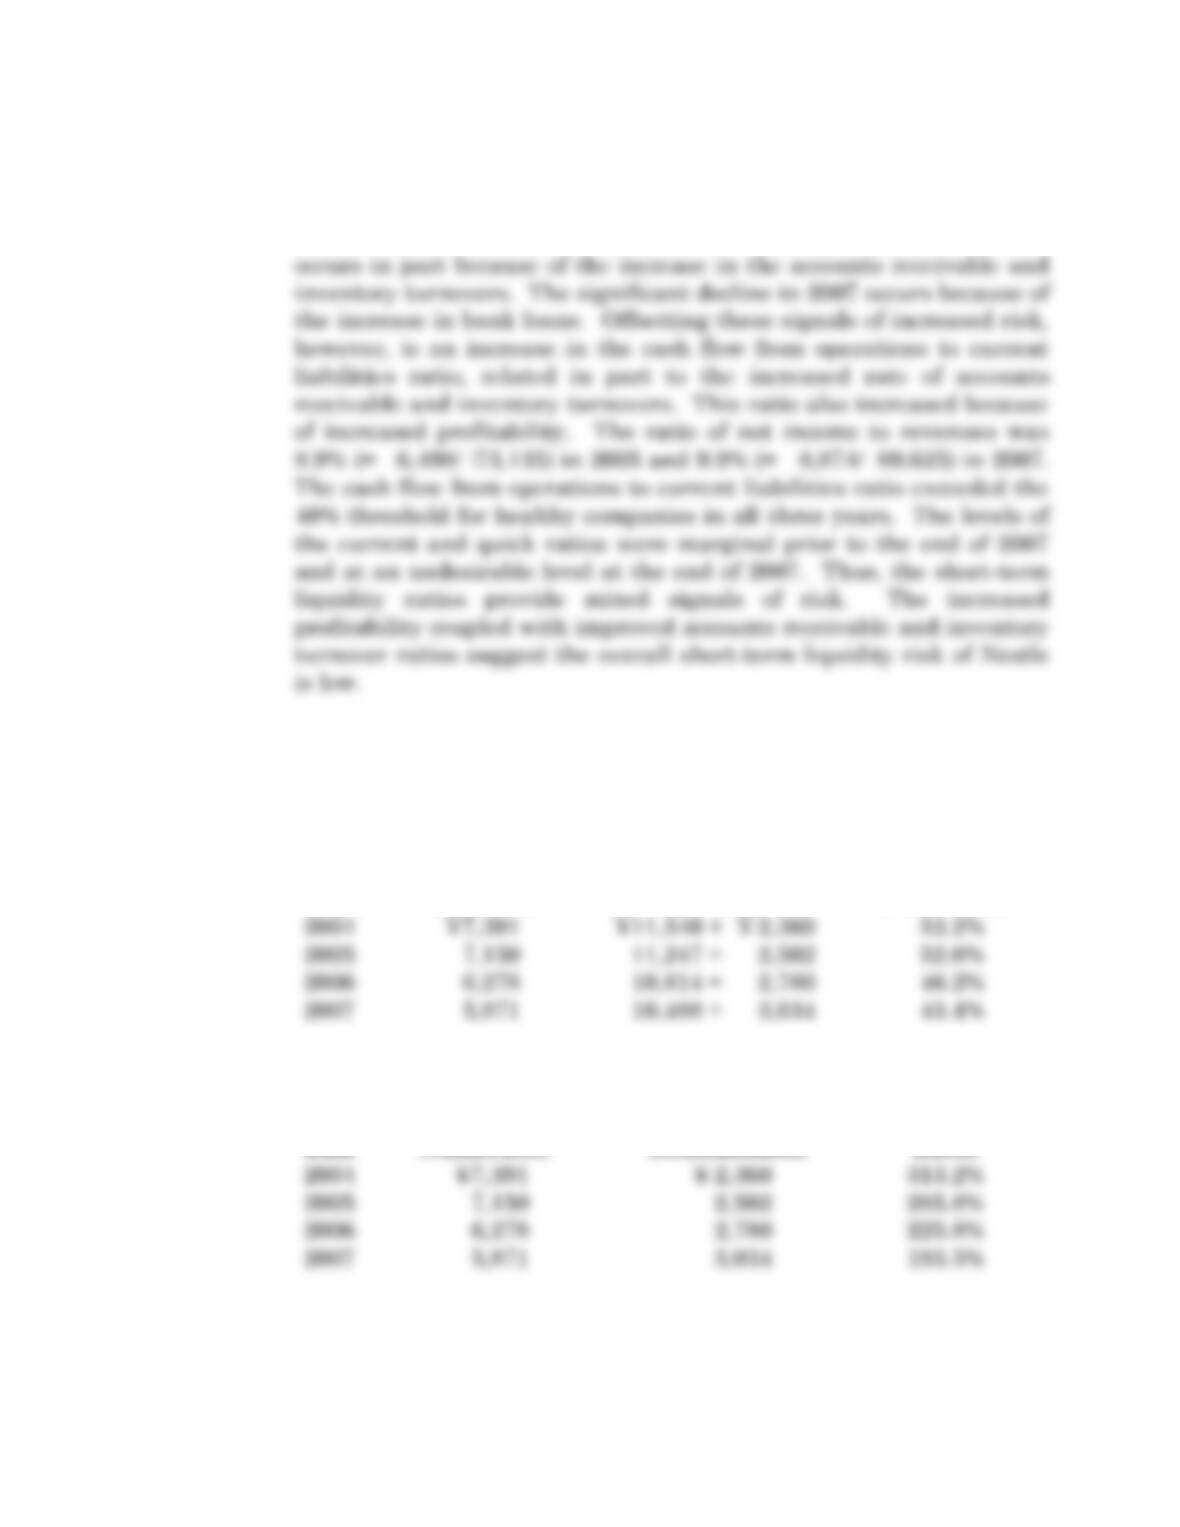
c. The current and quick ratios both declined during the last four years,
with a significant decline in 2007. The gradual decline over time
6.23 (Tokyo Electric; calculating and interpreting long–term liquidity ratios.)
(Amounts in Billions of Japanese Yen)
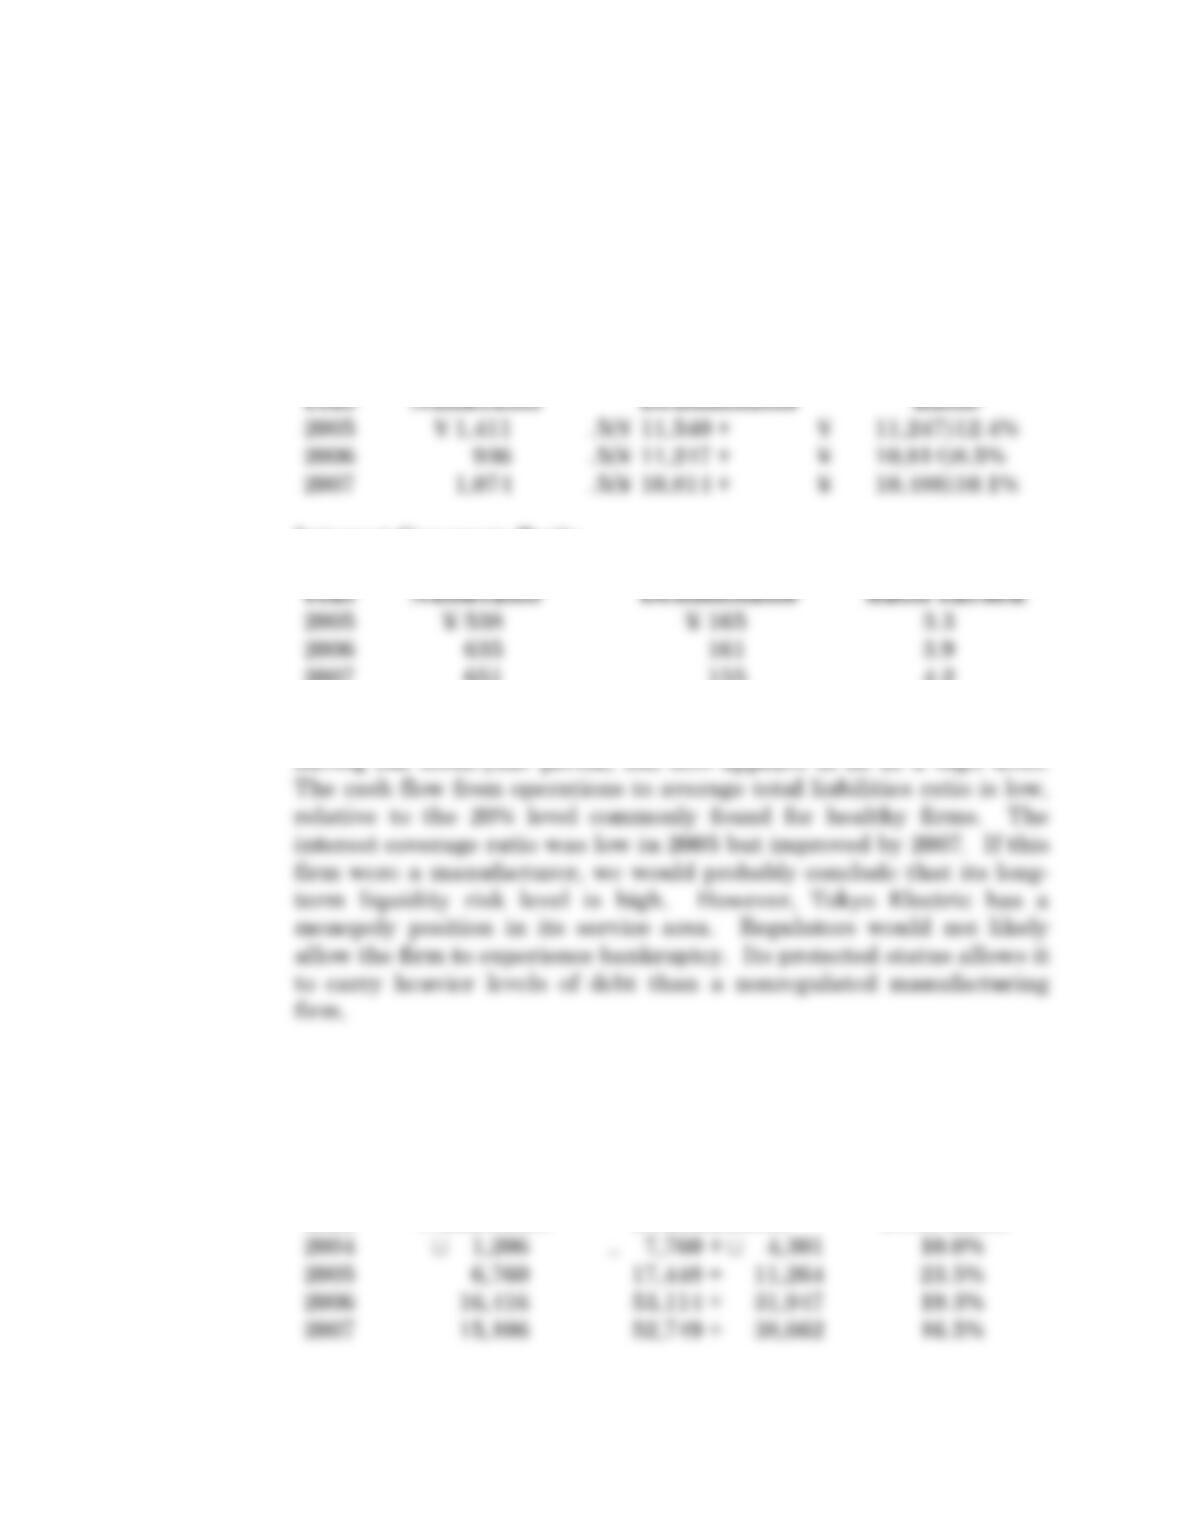
a. Long-Term Debt Ratio
Year Long-Term
End Numerator Denominator Debt Ratio
Debt-Equity Ratio
Year Debt-Equity
End Numerator Denominator Ratio
Solutions 6-24
6.23 continued.
b. Cash Flow from Operations to Total Liabilities Ratio
Cash Flow
from
Operations
to Total
Liabilities
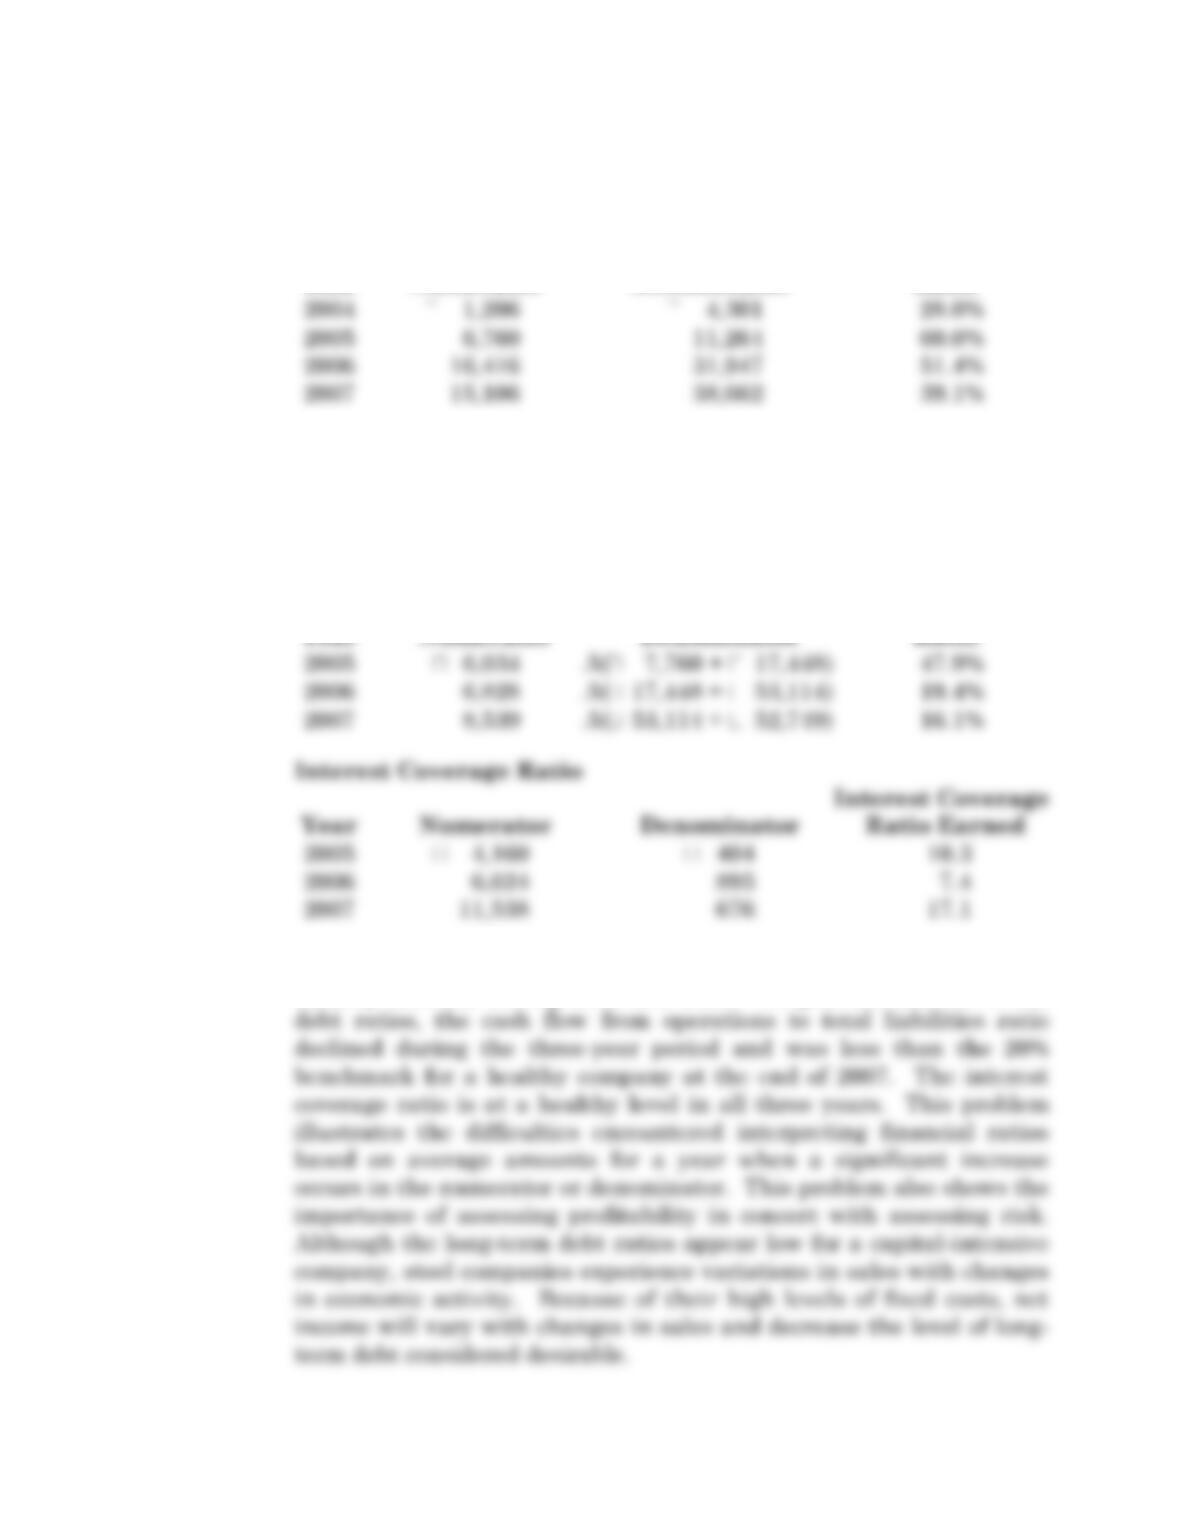
Interest Coverage Ratio
Interest Coverage
2007 651 155 4.2
c. The proportion of long-term debt in the capital structure declined
6.24 (Arcelor Mittal; calculating and interpreting long-term liquidity ratios.)
(Amounts in Millions of Euros)
a. Long-Term Debt Ratio
Year Long-Term
End Numerator Denominator Debt Ratio
6-25 Solutions
6.24 a. continued.
Debt-Equity Ratio
Year Debt-Equity
End Numerator Denominator Ratio
b. Cash Flow from Operations to Total Liabilities Ratio
Cash Flow
from
Operations
to Total
Liabilities
Year Numerator Denominator Ratio
c. The long-term debt levels increased significantly during 2005 but
steadily declined during 2006 and 2007. Despite the decline in the
Solutions 6-26
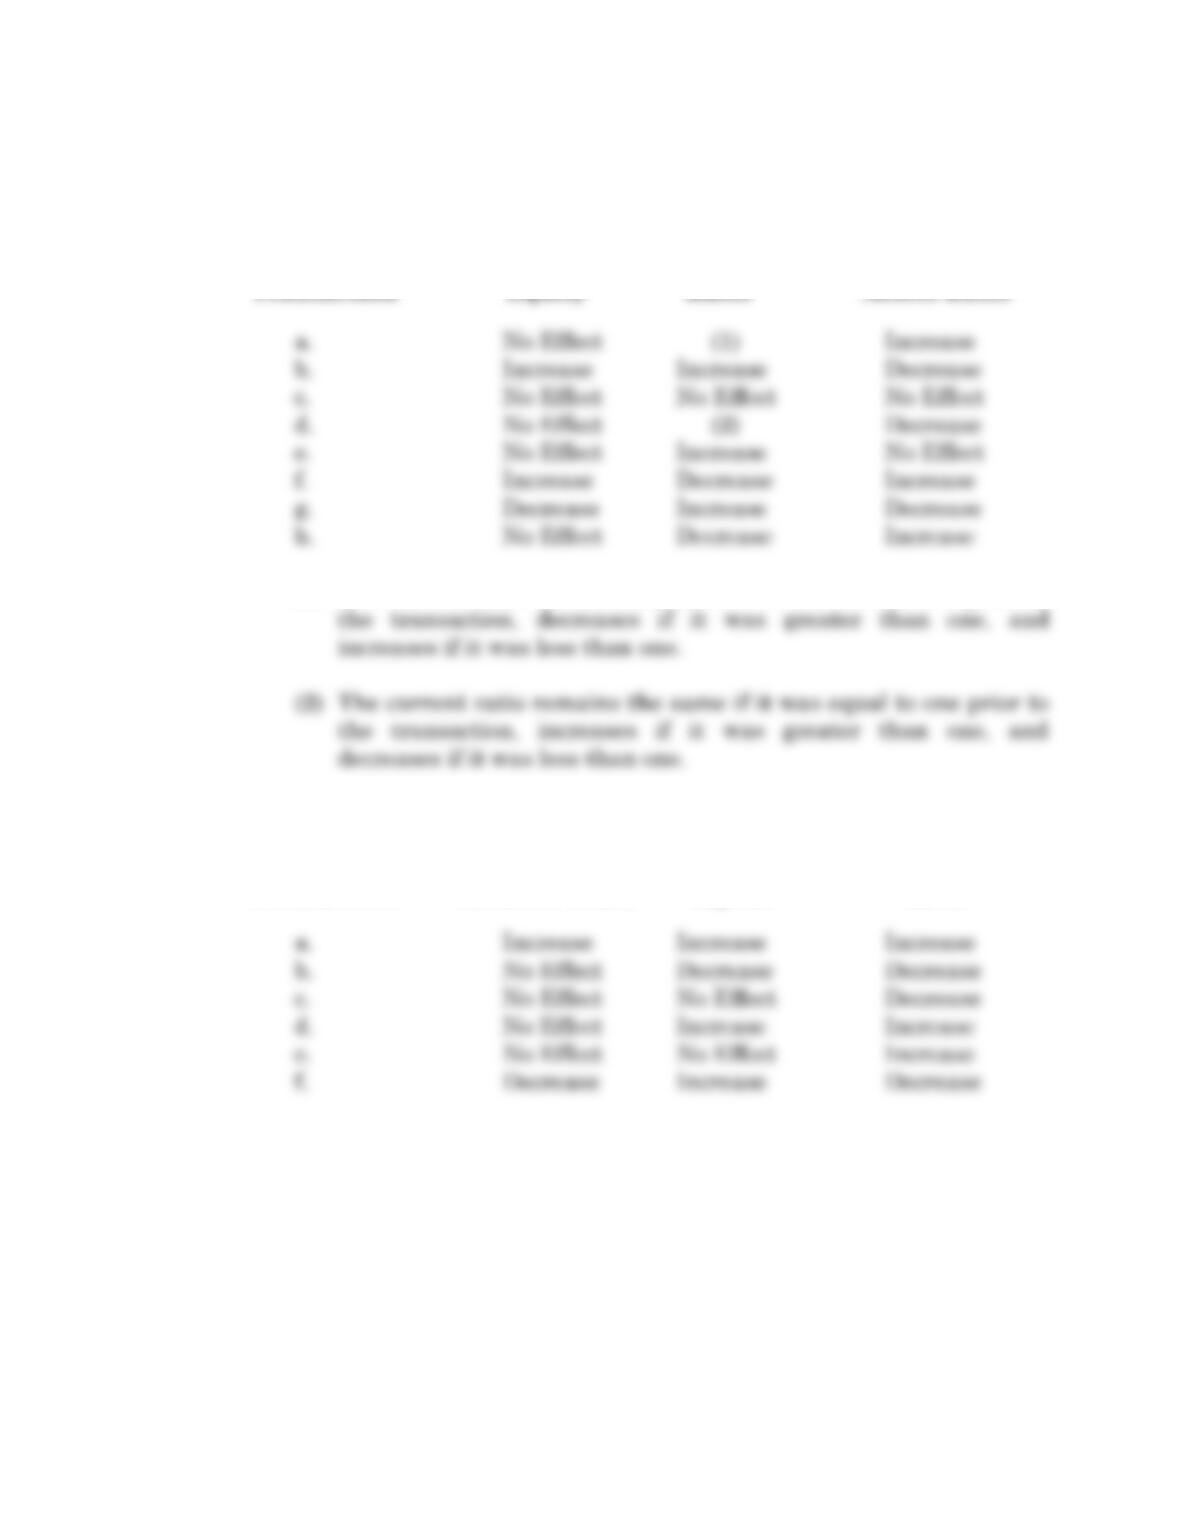
6.25 (Effect of various transactions on financial statement ratios.)
Rate of Return
on Common
Shareholders’ Current Liabilities to
Transaction Equity Ratio Assets Ratio
(1) The current ratio remains the same if it was one to one prior to
6.26 (Effect of various transactions on financial statement ratios.)
Earnings per Working Quick
Transaction Common Share Capital Ratio
6.27 (Target Corporation; calculating and interpreting profitability and risk
ratios in a time series setting.) (Amounts in Millions)
a. 1. Rate of Return
on Assets
=
$2,849 +(1 −.35)($669)
.5($38,599 +$46,373 )
= 7.7%.
2. Profit Margin
for Rate of
Return on
Assets
=
$2,849 +(1 −.35)($669)
$61,471
= 5.3%.
3. Total Assets
Turnover
=
$61,471
.5($38,599 +$46,373 )
= 1.4 times.
4. Other Revenues/
Sales
=
$1,918
$61,471
= 3.1%.
5. Cost of Goods
Sold/Sales
=
$41,895
$61,471
= 68.2%.
6. Selling and
Administrative
Expense/Sales
=
$16,200
$61,471
= 26.4%.
7. Interest
Expense/Sales
=
$669
$61,471
= 1.1%.
8. Income Tax
Expense/Sales
=
$1,776
$61,471
= 2.9%.
9. Accounts
Receivable
Turnover Ratio
=
$61,471
.5($6,194 +$8,054 )
= 8.6 times.
10. Inventory
Turnover Ratio
=
$41,895
.5($6,254 +$6,780 )
= 6.4 times.
11. Fixed Asset
Turnover
=
$61,471
.5($22,681 +$25,908 )
= 2.5 times.
12. Rate of Return
on Common
Shareholders’
=
$2,849
.5($15,633 +$15,307 )
= 18.4%.
Solutions 6-28
Equity
6.27 a. continued.
13. Profit Margin
for Return
on Common
Shareholders’
Equity
=
$2,849
$61,471
= 4.6%.
14. Capital Structure
Leverage Ratio
=
.5($38,599 +$46,373 )
.5($15,633 +$15,307 )
= 2.7.
15. Current Ratio =
$18,906
$11,782
= 1.6.
16. Quick Ratio =
$2,450 +$8,054
$11,782
= .9.
17. Accounts
Payable
Turnover
Ratio
=
($41,895 +$6,780 −$6,254 )
.5($6,575 +$6,721)
= 6.4 times.
=
20. Long-Term
=
21. Debt-Equity
Ratio
=
$16,939
$15,307
Ratio

Solutions 6-30
23. Interest
Coverage Ratio
=
($2,849 +$1,776 +$669 )
$669
= 7.9 times.
6-31 Solutions
6.27 continued.
b. Rate of Return on Assets (ROA)
The ROA of Target Corporation increased between the fiscal years
Profit Margin for ROA The changes in the profit margin for ROA
Total Assets Turnover The total assets turnover declined between
c. Rate of Return on Common Shareholders’ Equity
ROCE follows the same path as ROA, increasing between 2006 and
2007 and then decreasing between 2007 and 2008. The profit margin

Solutions 6-32
6-33 Solutions
6.27 continued.
d. Short-Term Liquidity Risk
The current and quick ratios of Target Corporation vary inversely
with changes in the accounts receivable and inventory turnovers.
Increased turnovers for these assets between 2006 and 2007 resulted
e. Long-Term Solvency Risk
The debt ratios declined between 2006 and 2007 and increased
between 2007 and 2008, as Part b. discusses. The cash flow from
6.28 (Carrefour, Target, and Wal-Mart; profitability and risk analysis in a
cross section setting.)
a. Wal-Mart’s advantage over Target Corporation on ROA is a higher

Solutions 6-34
6-35 Solutions
6.28 a. continued.
• Higher Other Revenues to Sales Percentage for Target
Corporation: Target Corporation offers its own credit card, which
• Lower Cost of Goods Sold to Sales Percentage for Target
Corporation: Target sells a higher proportion of brand name and
• Higher selling and administrative expenses to sales percentage for
Target Corporation: Several factors might explain this higher
percentage. First, Target Corporation is significantly smaller than
• Higher advertising expense to sales percentage for Target
Solutions 6-36
6.28 a. continued.
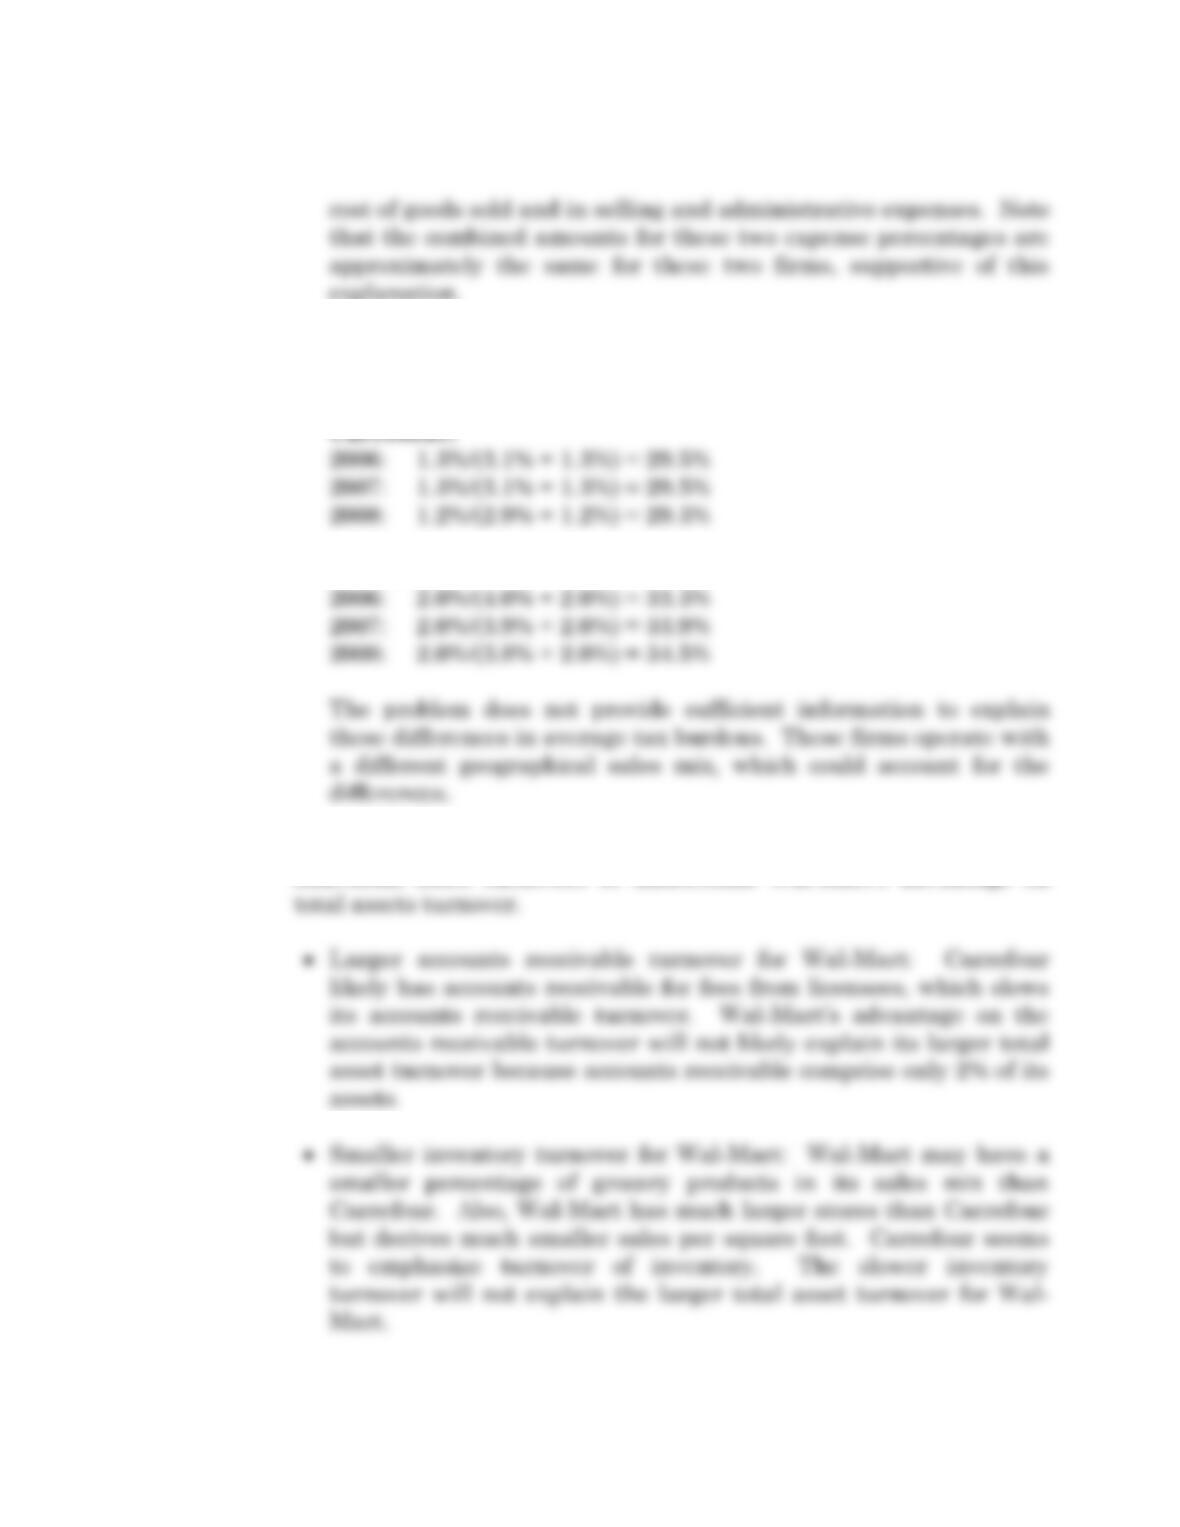
• Higher tax burden for Target Corporation: We measure tax
taxes.
Target:
2006: 3.2%/(5.3% + 3.2%) = 37.6%
Target Corporation derives all of its income from within the United
Total Assets Turnover: Wal-Mart’s advantage on total assets
• Faster accounts receivable turnover for Wal-Mart: Wal-Mart does
6-37 Solutions
6.28 continued.
b. Wal-Mart’s advantage over Carrefour on ROA is a higher profit
margin for ROA and a higher total assets turnover.
Profit Margin for ROA: Wal-Mart’s advantage on profit margin for
• Lower other revenues to sales percentage for Wal-Mart: The
problem data indicate that Carrefour derives license fees from
higher other revenues to sales percentage.
• Higher selling and administrative expenses to sales percentage for
Wal-Mart: One would expect the larger size of Wal-Mart to
provide it with economies of scale in spreading fixed
administrative costs over a larger sales base and result in a lower

Solutions 6-38
6-39 Solutions
6.28 b. continued.
explanation.
• Higher tax burden for Wal-Mart. The calculation of the tax
burdens is as follows:
Wal-Mart:
Total Assets Turnover We examine each of the companies’
individual asset turnovers to understand Wal-Mart’s advantage on
Solutions 6-40
6.28 b. continued.
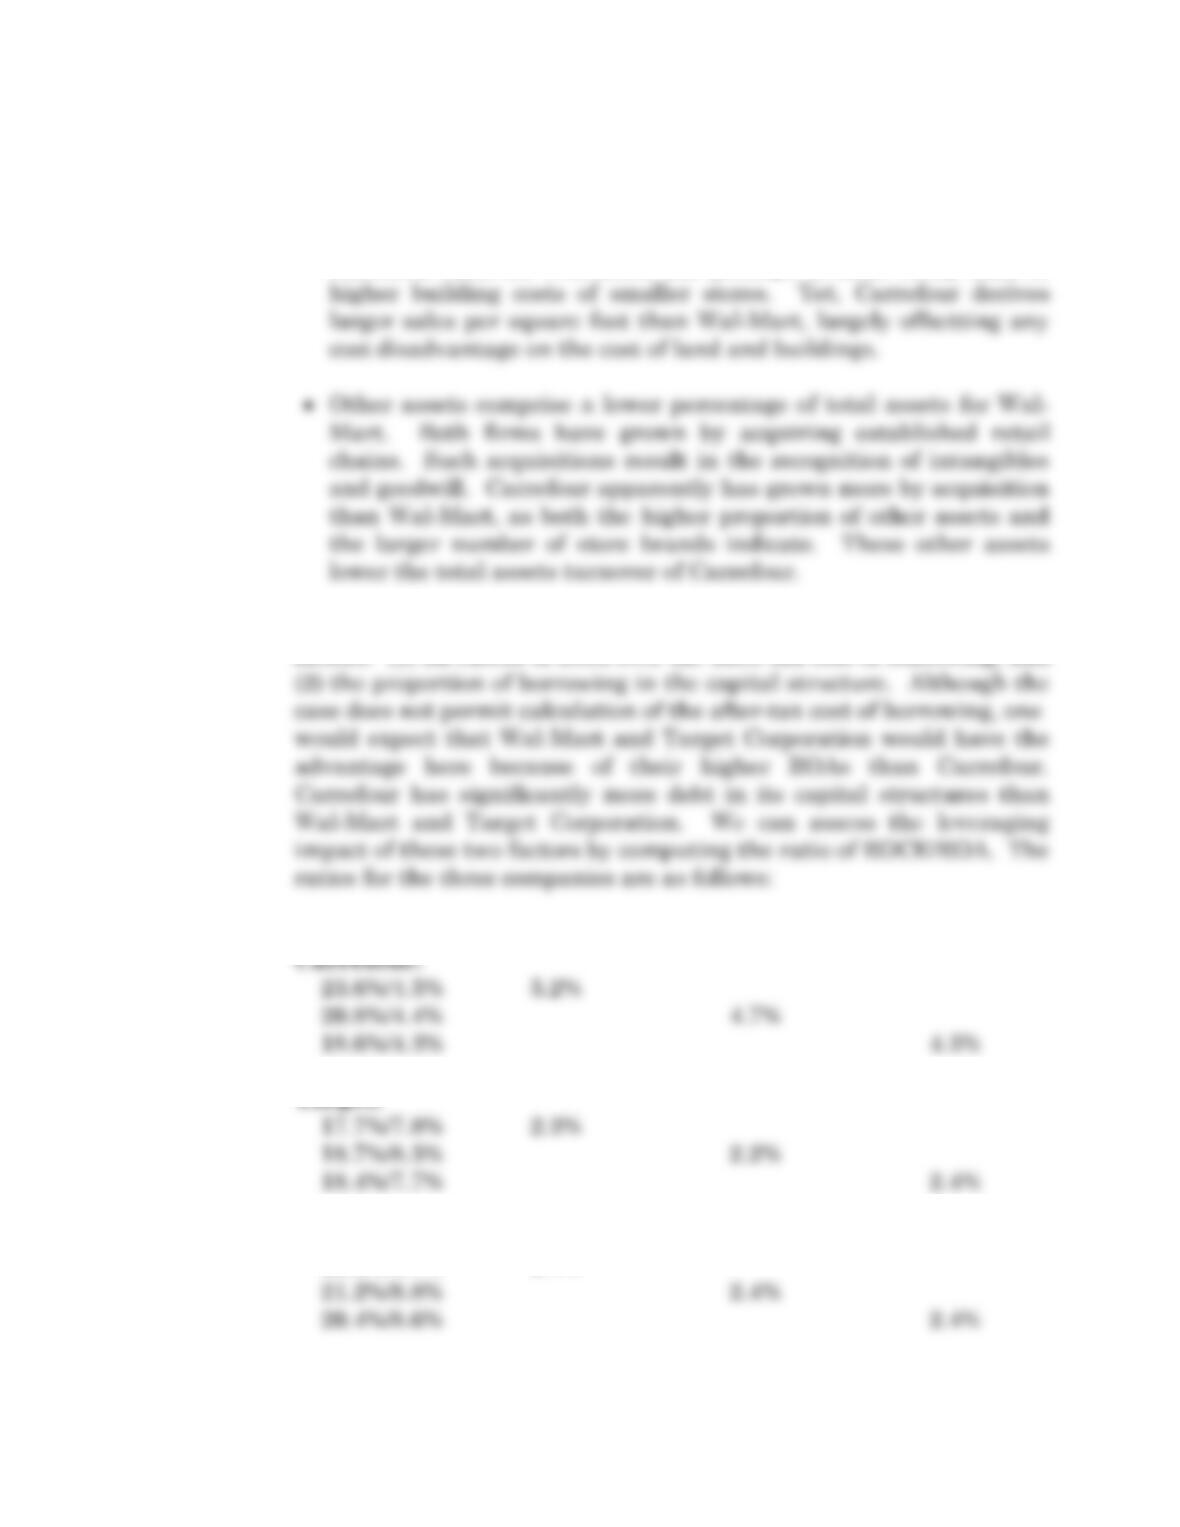
• Similar fixed asset turnovers for Wal-Mart and Carrefour. The
cost per square foot of store space is significantly larger for
Carrefour than for Wal-Mart, due perhaps to more costly land or
c. The advantage from using financial leverage stems from two principal
factors: (1) an excess of ROA over the after-tax cost of borrowing, and
2006 2007 2008
Target:
Wal-Mart:
22.2%/9.1% 2.4%