6-1 Solutions
CHAPTER 6
INTRODUCTION TO FINANCIAL STATEMENT ANALYSIS
Questions, Exercises, and Problems: Answers and Solutions
6.2 The increase in the cost of goods sold to sales percentage could result from
6.3 The adjustment in the numerator of rate of return on assets is for the
6.4 Assets other than accounts receivable, inventory, or fixed assets must
have increased at a faster rate than the increase in sales. Perhaps the
6.5 The profit margin for ROA ignores how a firm has financed its assets (that
Solutions 6-2
6.6 The first company apparently has a relatively small profit margin and
6.7 Management strives to keep its inventories at a level that is neither too
low so that it loses sales nor too high so that it incurs high storage costs.
6.8 The rate of return on common shareholders’ equity exceeds the rate of
return on assets when the latter rate exceeds the return required by
creditors and preferred shareholders (net of tax effects). In this situation,
6.9 This statement suggests that the difference between the rate of return on
assets and the after-tax cost of debt is positive but small. Increasing the
6.10 Financial leverage involves using debt capital that has a smaller after-tax
cost than the return a firm can generate from investing the capital in
6.11 (CBRL Group and McDonald’s; calculating and disaggregating rate of
return on assets.) (Amounts in Millions)
$1,473
6-3 Solutions
$2,335 +(1 −.35)($417 )
$29,183
Solutions 6-4
6.11 continued,
b. Total
Assets
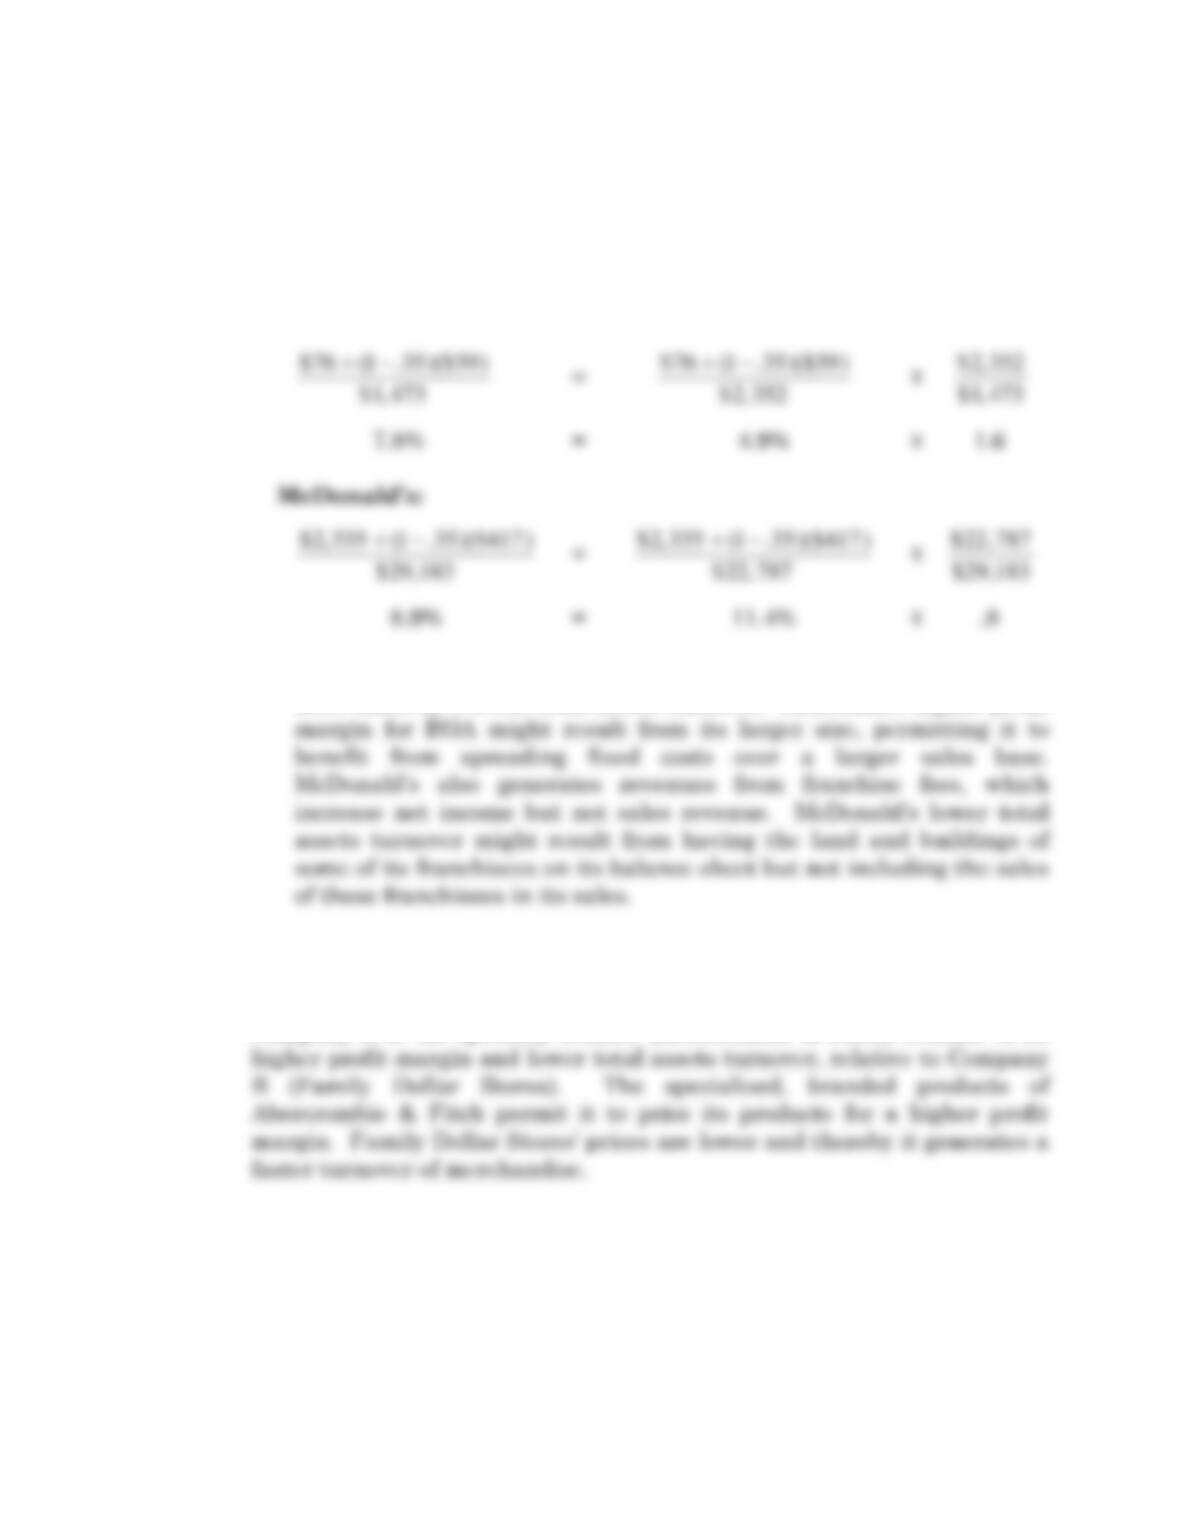
Rate of Return on Assets = Profit Margin for ROA X Turnover
Ratio
CBRL Group:
$29,183
$22,787
$29,183
8.9% = 11.4% X .8
c. McDonald’s has a higher ROA, the result of a higher profit margin for
ROA offset by a lower total assets turnover. McDonald’s higher profit
6.12 (Abercrombie & Fitch and Family Dollar Stores; profitability analysis for
two types of retailers.) (Amounts in Millions)
Company A is the specialty retailer (Abercrombie & Fitch) because of its
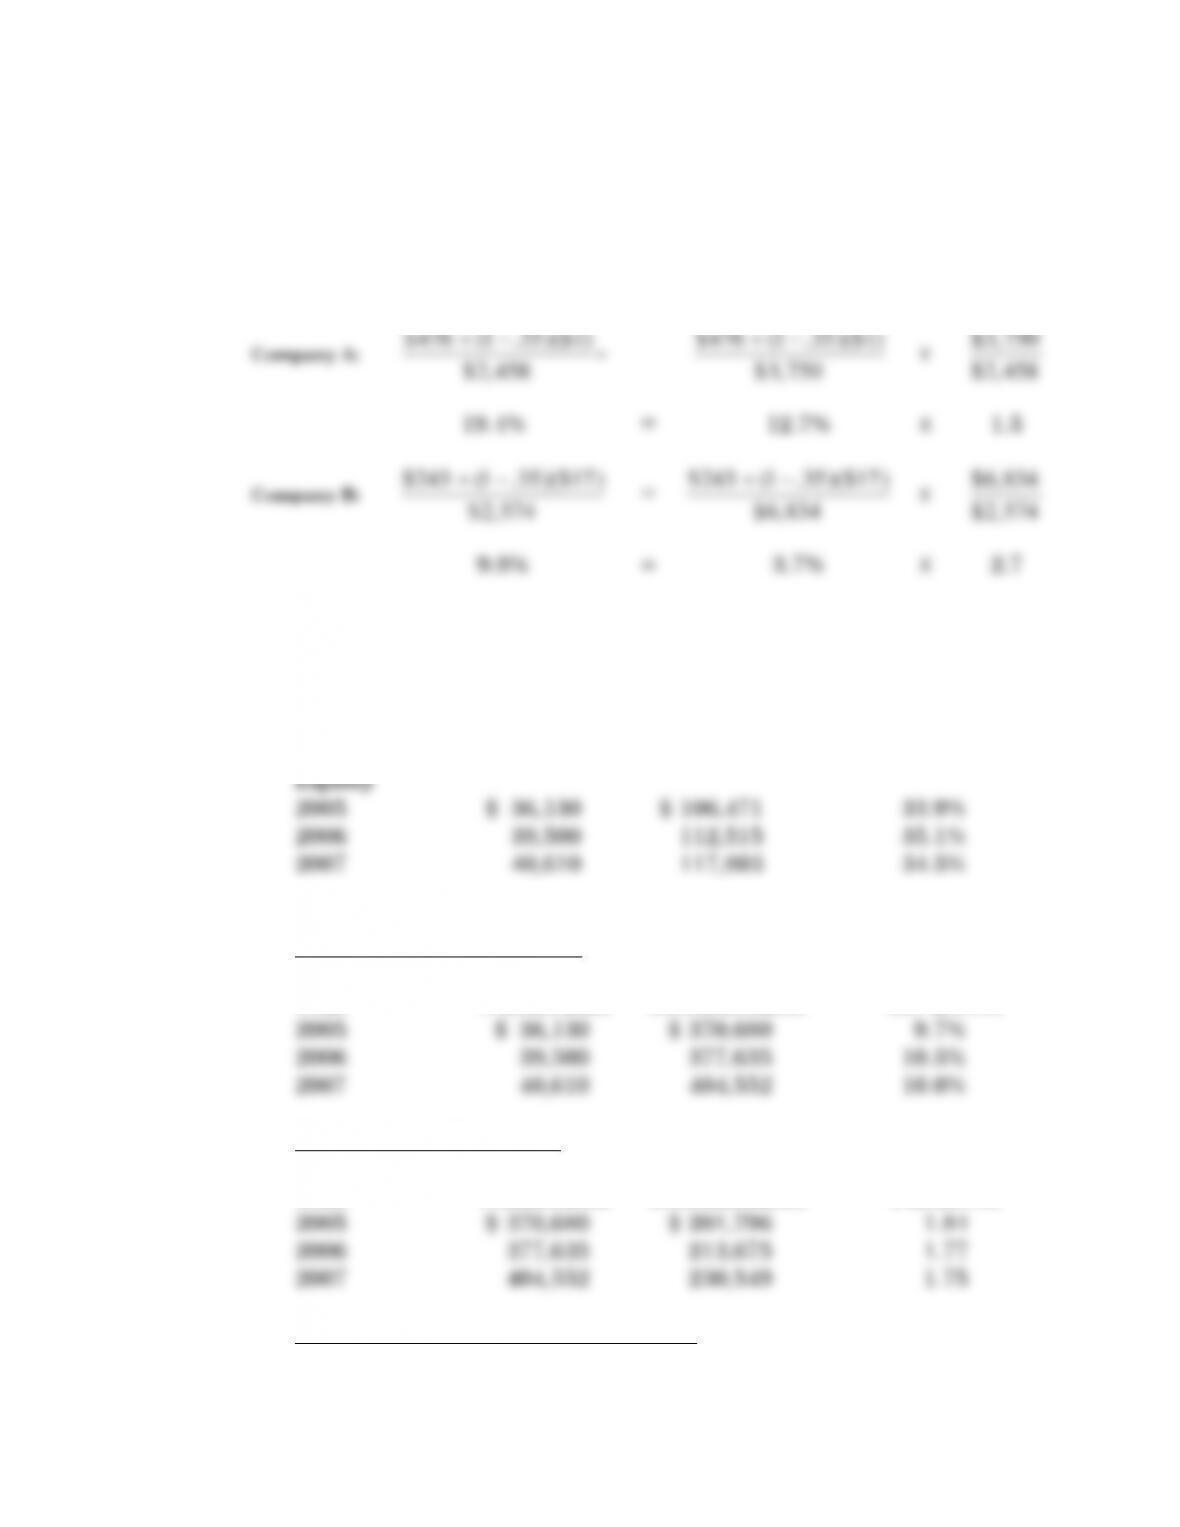
6-5 Solutions
6.12 continued.
Total
Rate of Profit Assets
Return = Margin X Turnover
On Assets for ROA Ratio
$476 +(1 −.35)($1)
$2,458
$476 +(1 −.35)($1)
$3,750
$3,750
$2,458
19.4% = 12.7% X 1.5
Company B:
$243 +(1 −.35)($17)
$2,574
=
$243 +(1 −.35)($17)
$6,834
X
$6,834
$2,574
9.9% = 3.7% X 2.7
6.13 (Exxon Mobil; calculating and disaggregating rate of return on common
shareholders’ equity.) (Amounts in Millions)
a. Rate of
Return on Common
Year Numerator Denominator Shareholders’
b. Profit Margin for ROCE
Profit Margin
Year Numerator Denominator for ROCE
Total Assets Turnover
Total Assets
Year Numerator Denominator Turnover
Capital Structure Leverage Ratio
Capital Structure
Solutions 6-6
Year Numerator Denominator Leverage Ratio
6-7 Solutions
6.13 continued.
c. The rate of return on common shareholders’ equity was relatively
steady during the three years. The profit margin for ROCE and the
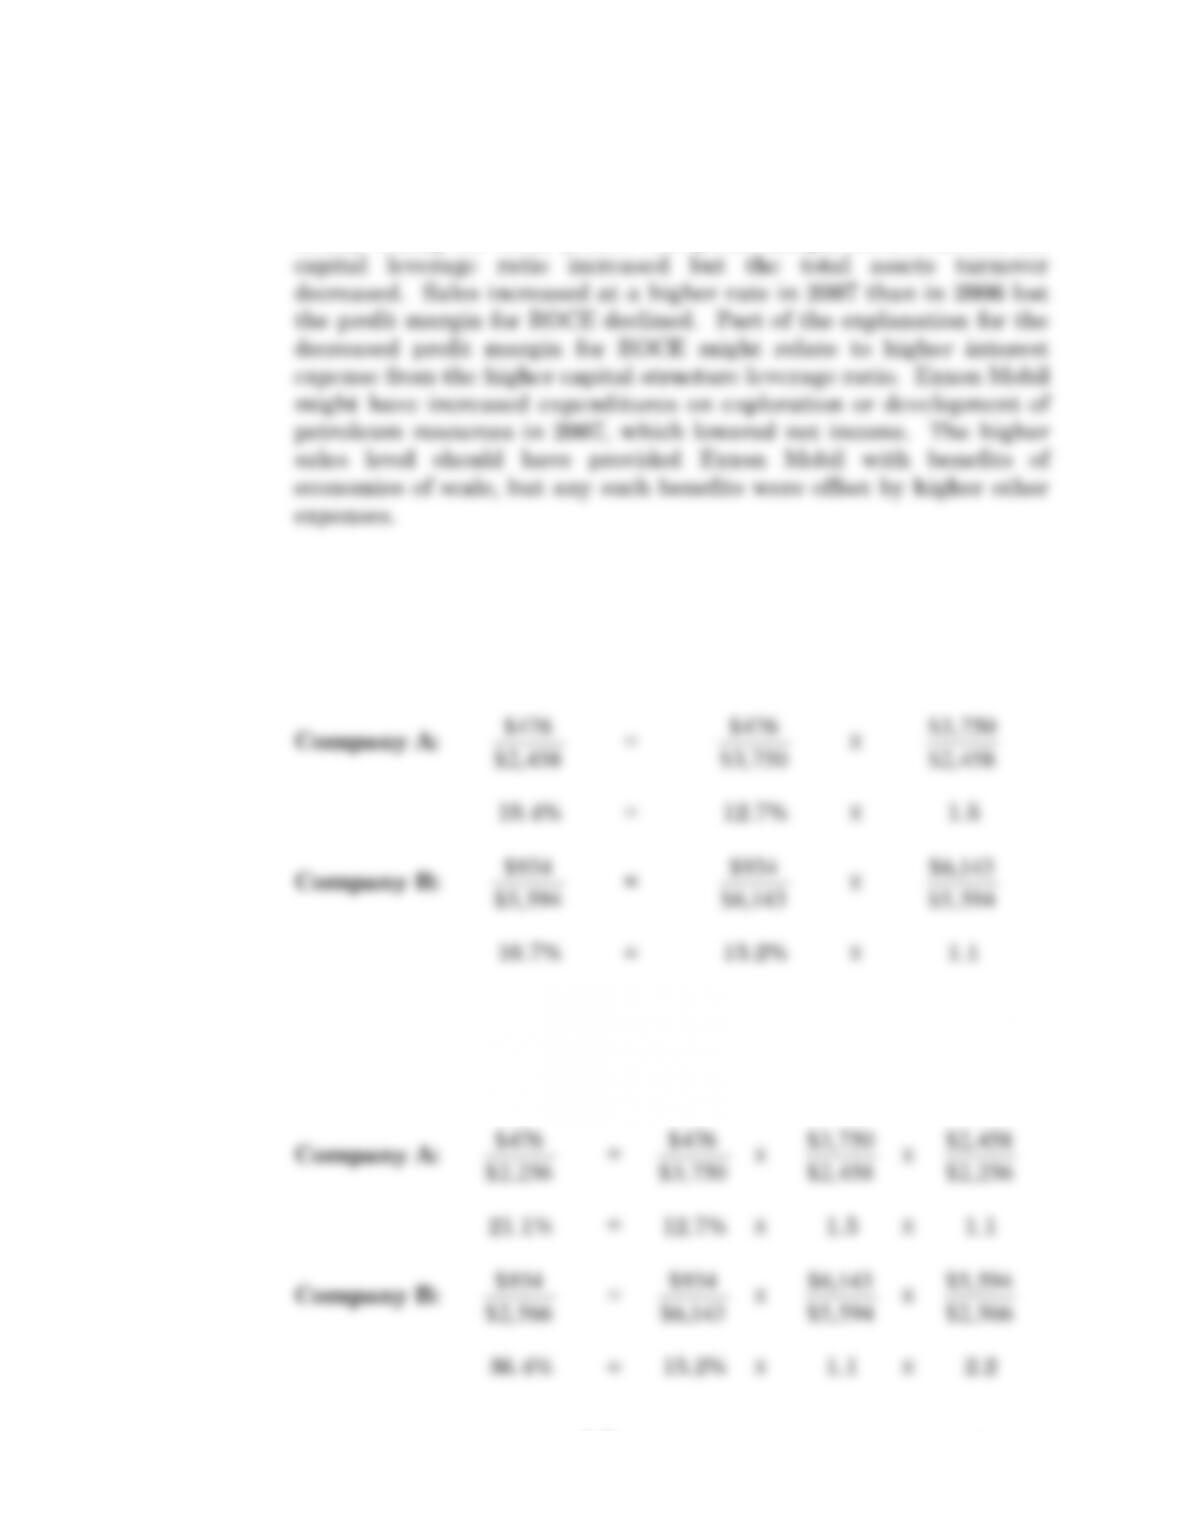
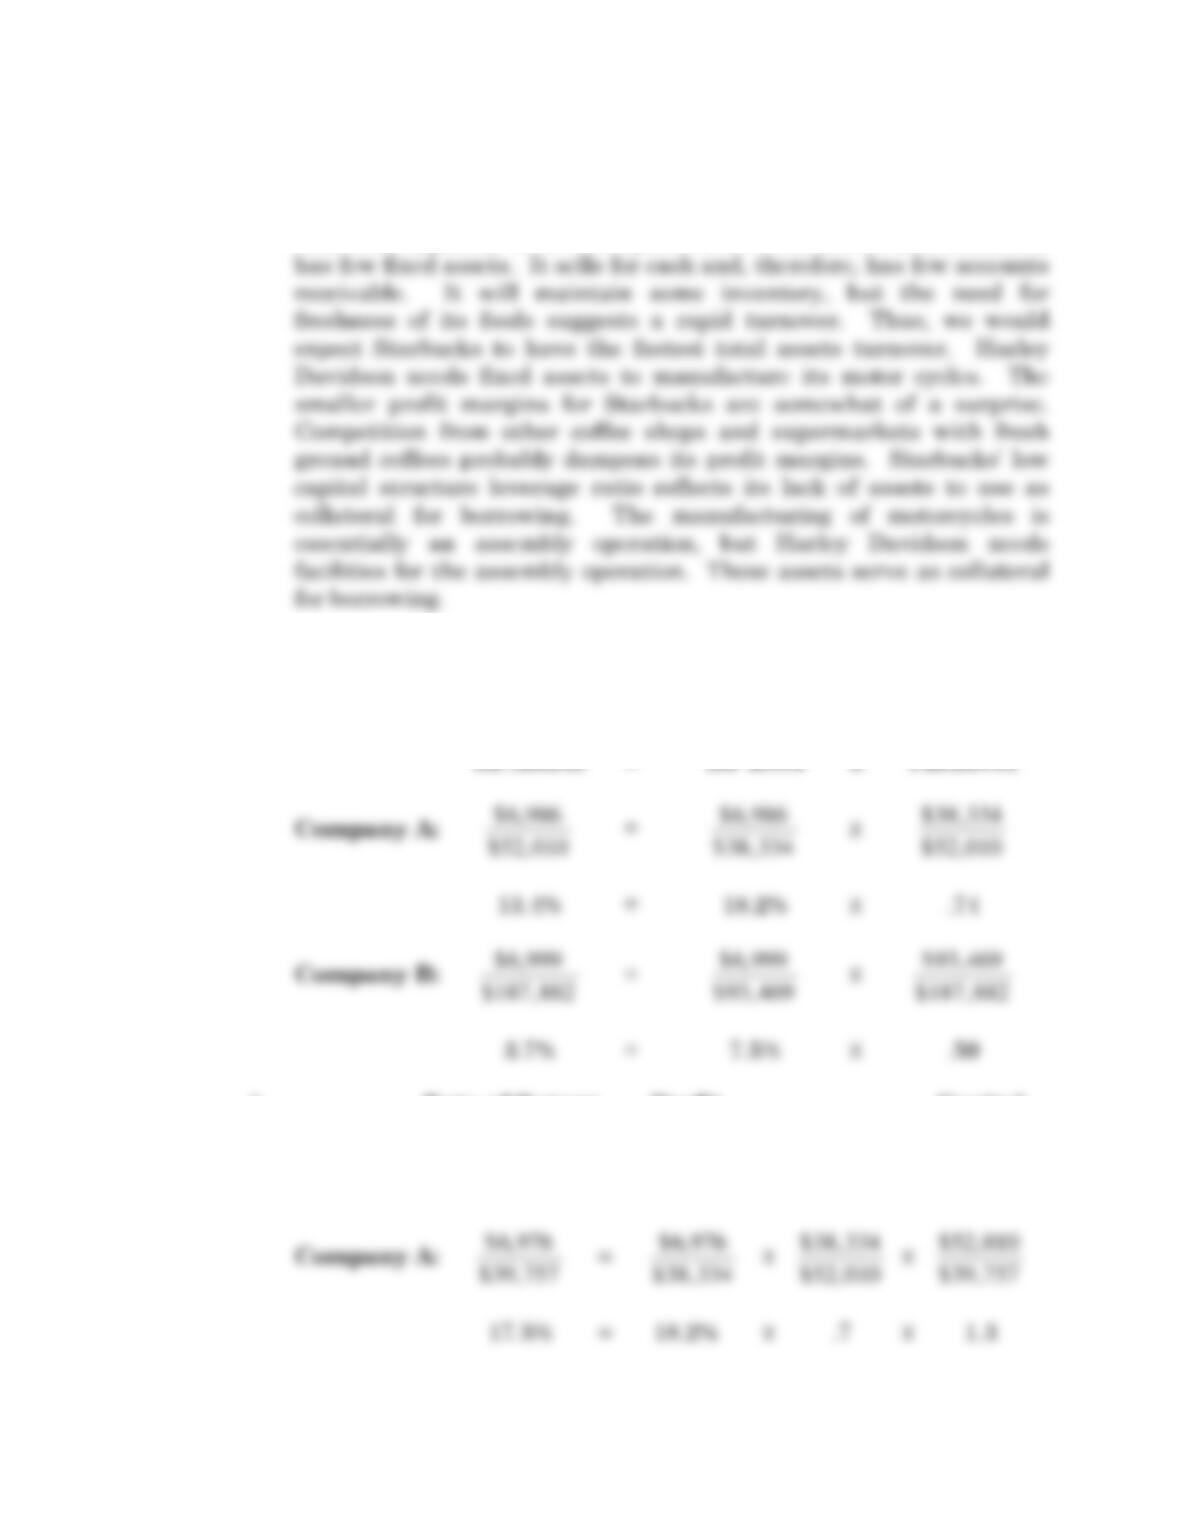
6.14 (Harley Davidson and Starbucks; profitability analysis for two
companies.) (Amounts in Millions)
a. Rate of Return Profit Margin Total Assets
on Assets = for ROA X Turnover
$5,594
$6,143
$5,594
16.7% = 15.2% X 1.1
b. Rate of Return Capital
on Common Profit Total Structure
Shareholders’ = Margin X Assets X Leverage
Equity for ROCE Turnover Ratio
$476
$2,256
$476
$3,750
$3,750
$2,458
$2,458
$2,256
21.1% = 12.7% X 1.5 X 1.1
Company B:
$934
$2,566
=
$934
$6,143
X
$6,143
$5,594
X
$5,594
$2,566
36.4% = 15.2% X 1.1 X 2.2
Solutions 6-8
6.14 continued.
c. Company A is Starbucks and Company B is Harley Davidson.
Starbucks typically leases the space for its restaurants and, therefore,
6.15 (Intel and Verizon Communications; profitability analysis for two
companies.) (Amounts in Millions)
a. Rate of Return Profit Margin Total Assets
on Assets = for ROA X Turnover
$187,882
$93,469
$187,882
3.7% = 7.5% X .50
b. Rate of Return Profit Capital
on Common Margin Total Structure
Shareholders’ = for X Assets X Leverage
Equity ROCE Turnover Ratio
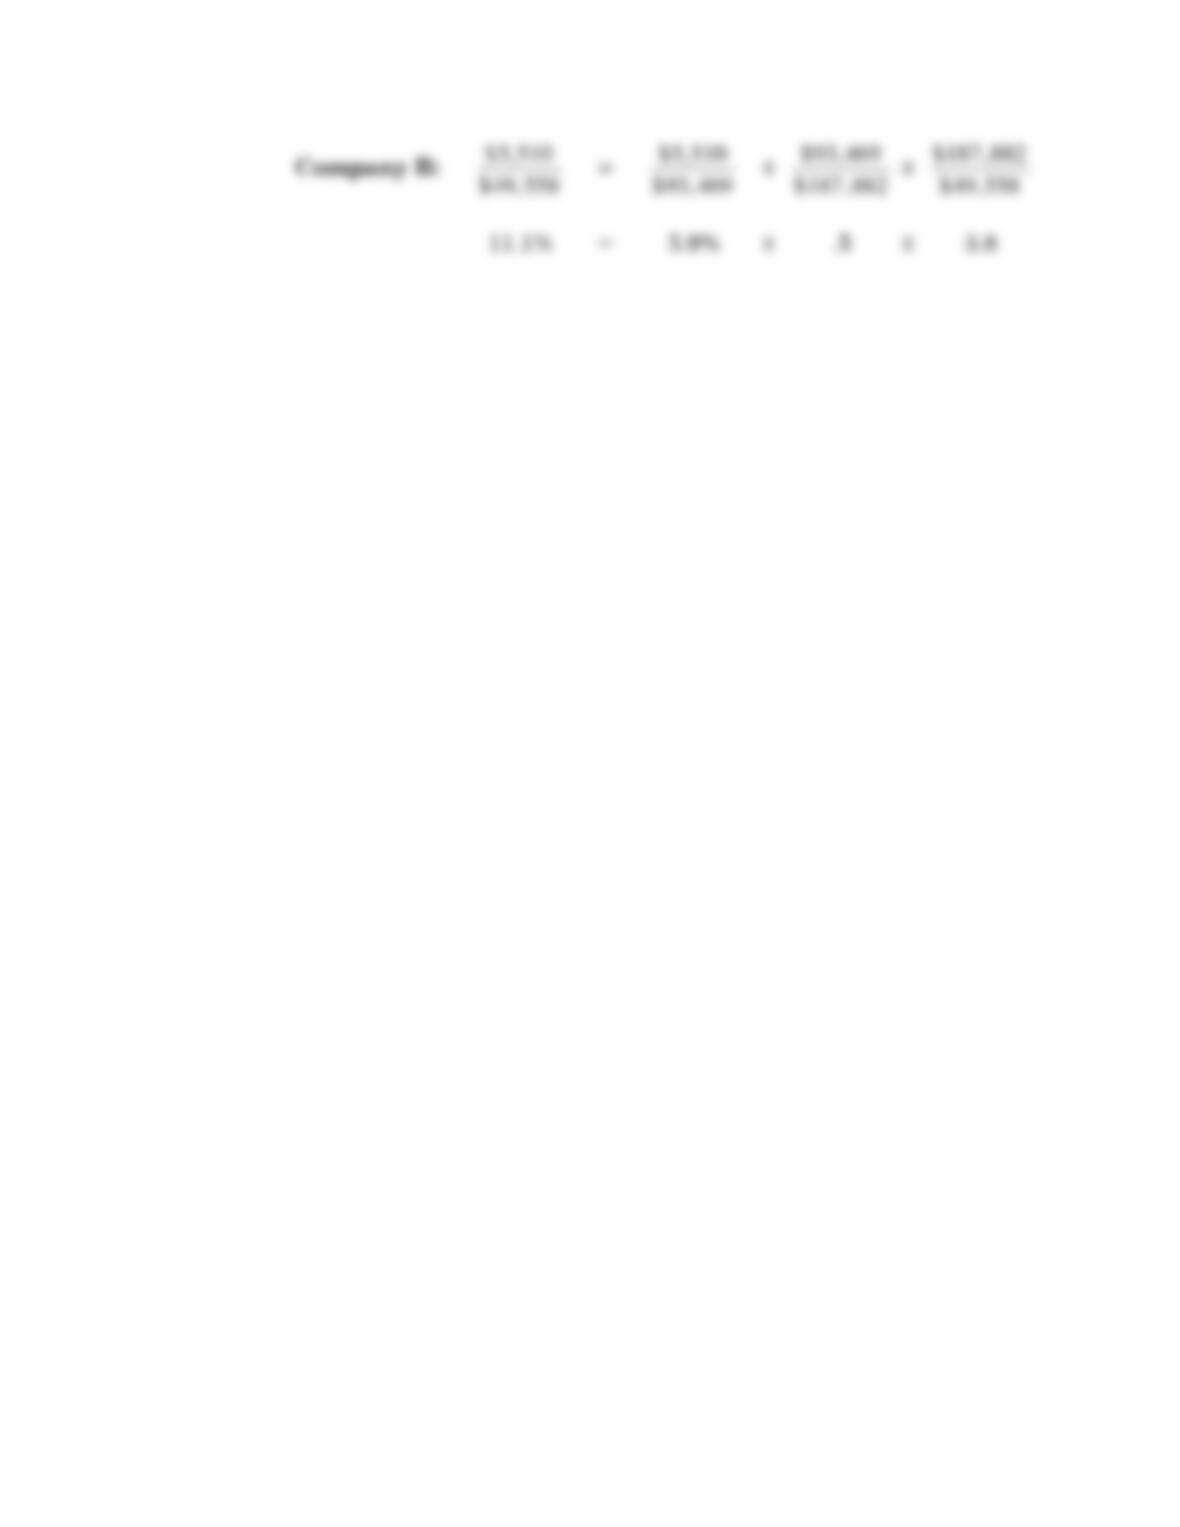
6-9 Solutions
$5,510
$5,510
$93,469
$187,882
Solutions 6-10
6.15 continued.
c. Company A is Intel and Company B is Verizon Communications.
Both of these firms are fixed-asset intensive, so their total assets
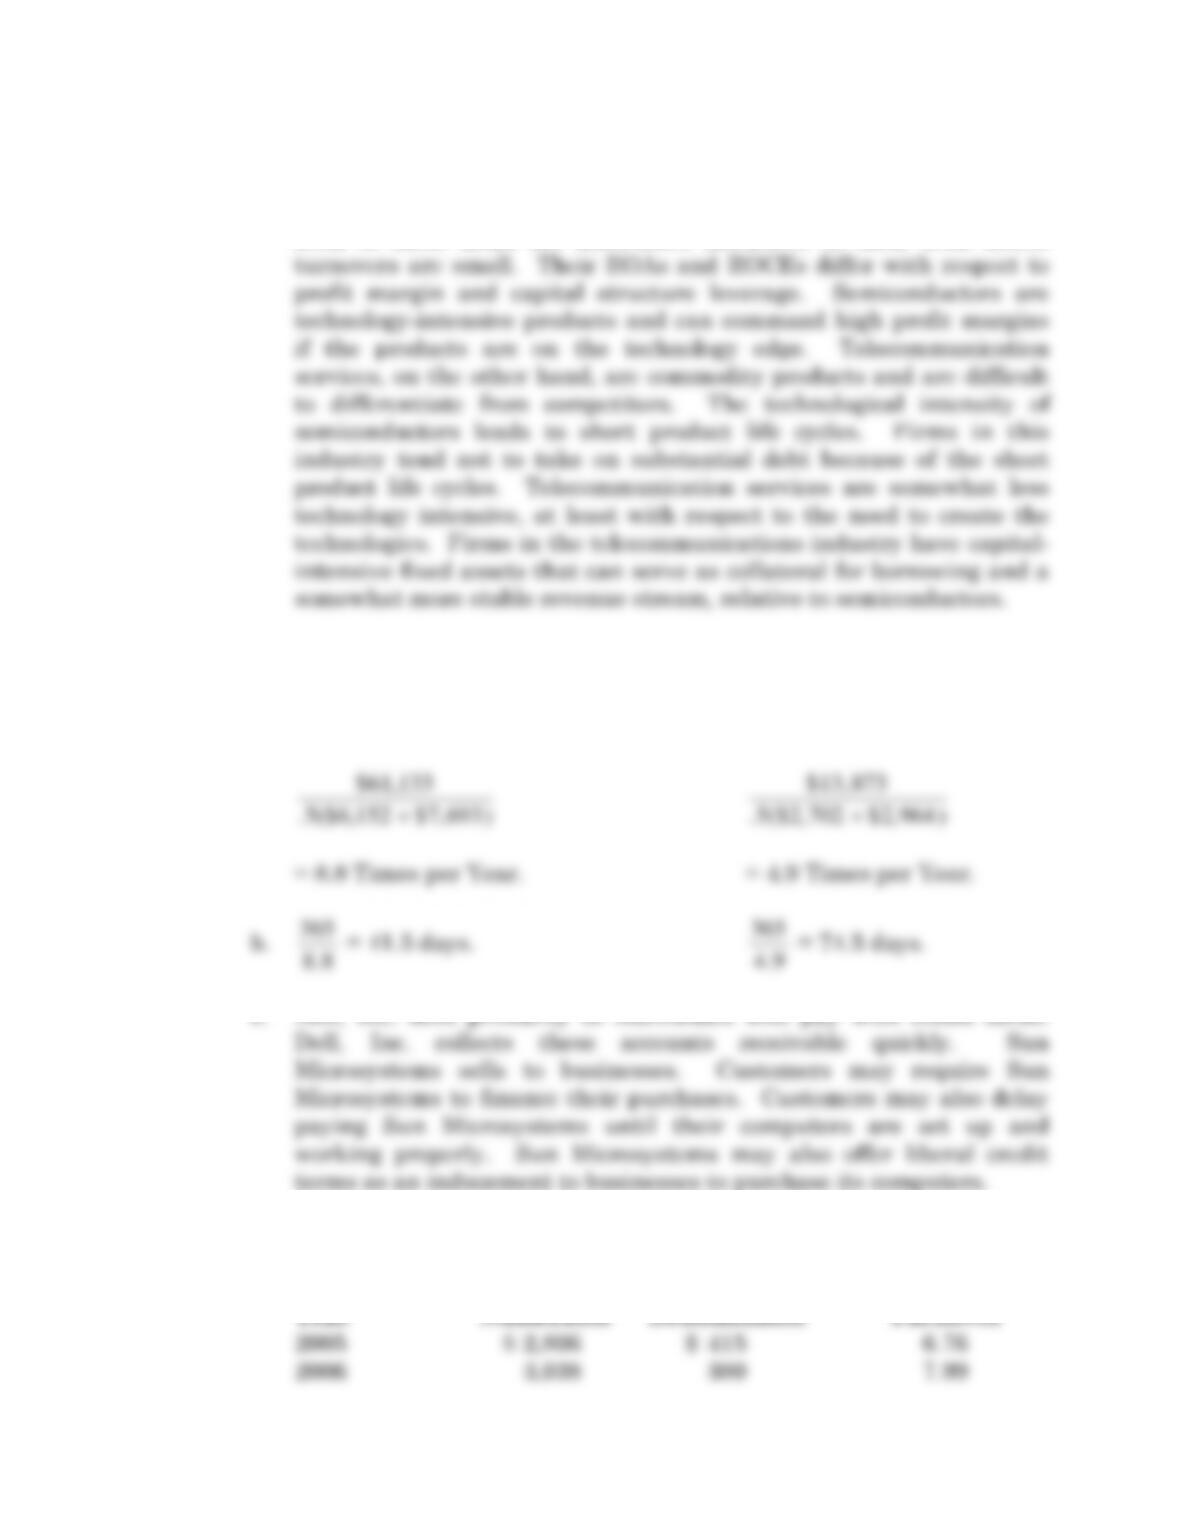
6.16 (Dell, Inc. and Sun Microsystems; analyzing accounts receivable for two
companies.) (Amounts in Millions)
a. Dell, Inc. Sun Microsystems
8.8
4.9
c. Dell, Inc. sells primarily to individuals who pay with credit cards.
6.17 (Mattel; analyzing inventories over three years.) (Amounts in Millions)
a. Inventory
6-11 Solutions
Solutions 6-12
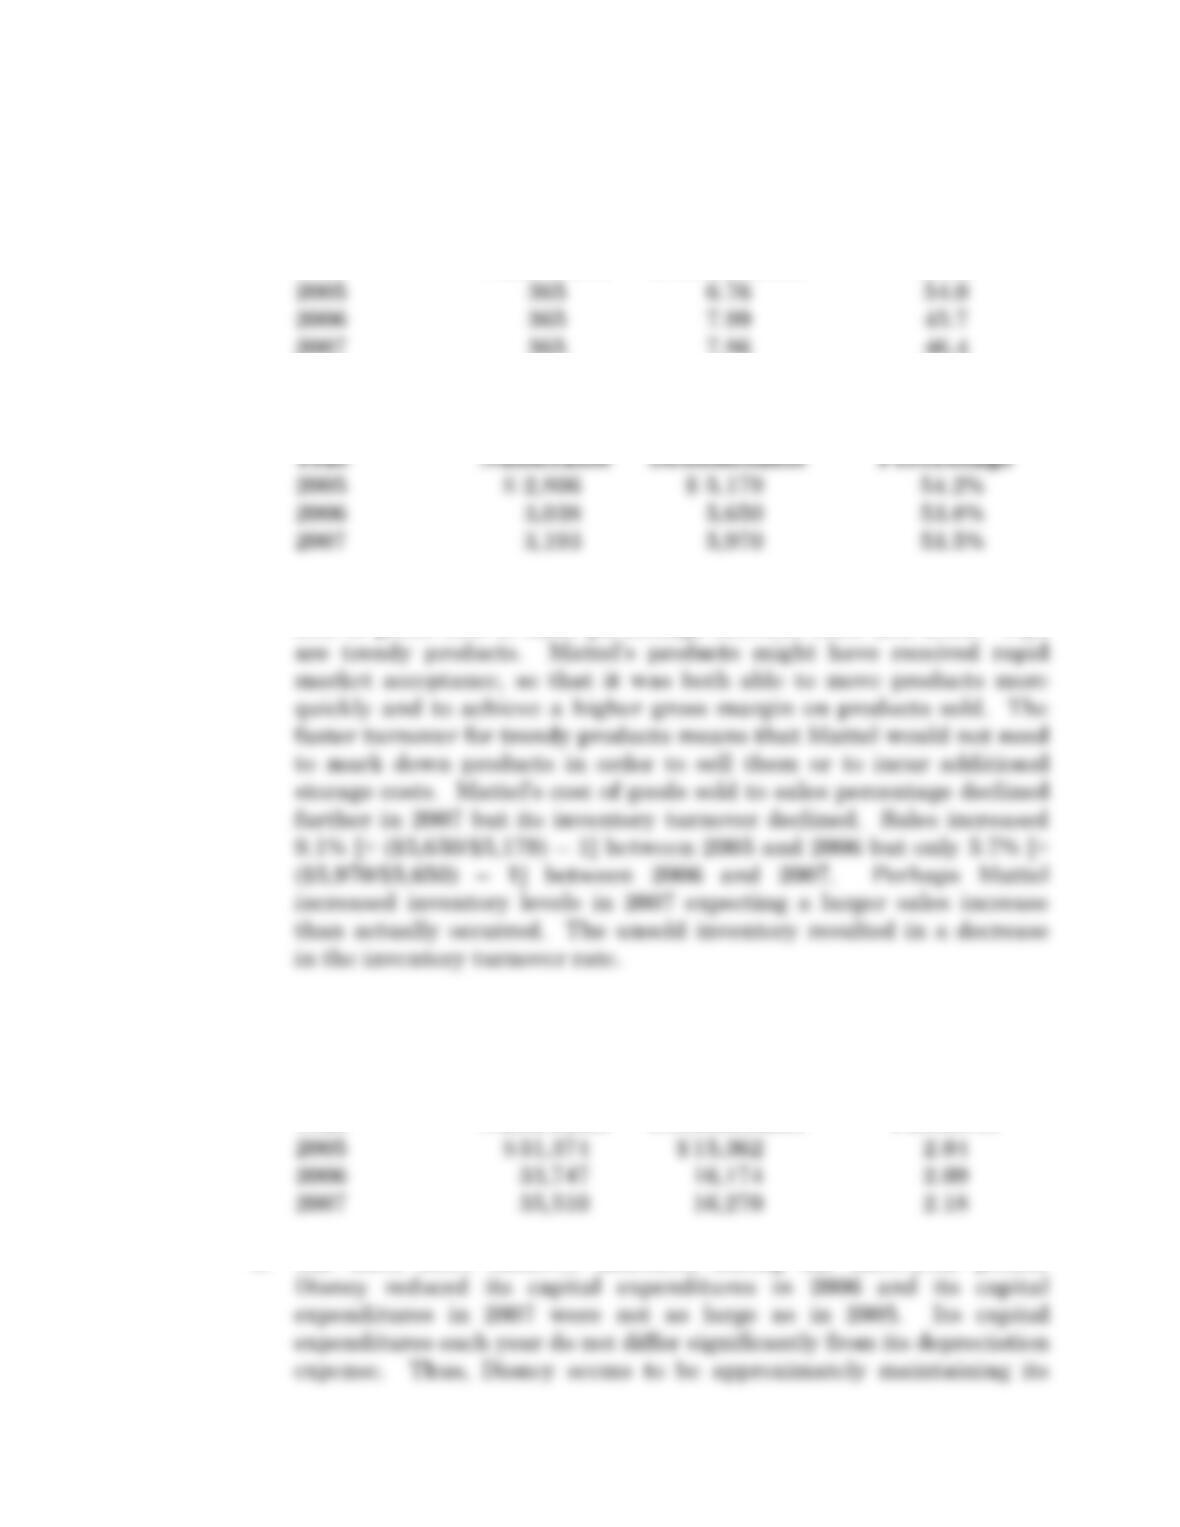
6.17 continued.
b. Days
Inventory
Year Numerator Denominator Held
2007 365 7.86 46.4
c. Cost of
Goods Sold
d. Mattel experienced an increasing inventory turnover and a decreasing
cost of goods sold to sales percentage between 2005 and 2006. Toys
6.18 (The Walt Disney Company; analyzing fixed asset turnover over three
years.) (Amounts in Millions)
a. Fixed Asset
Year Numerator Denominator Turnover
b. The fixed asset turnover increased during the three-year period.
6-13 Solutions
Solutions 6-14
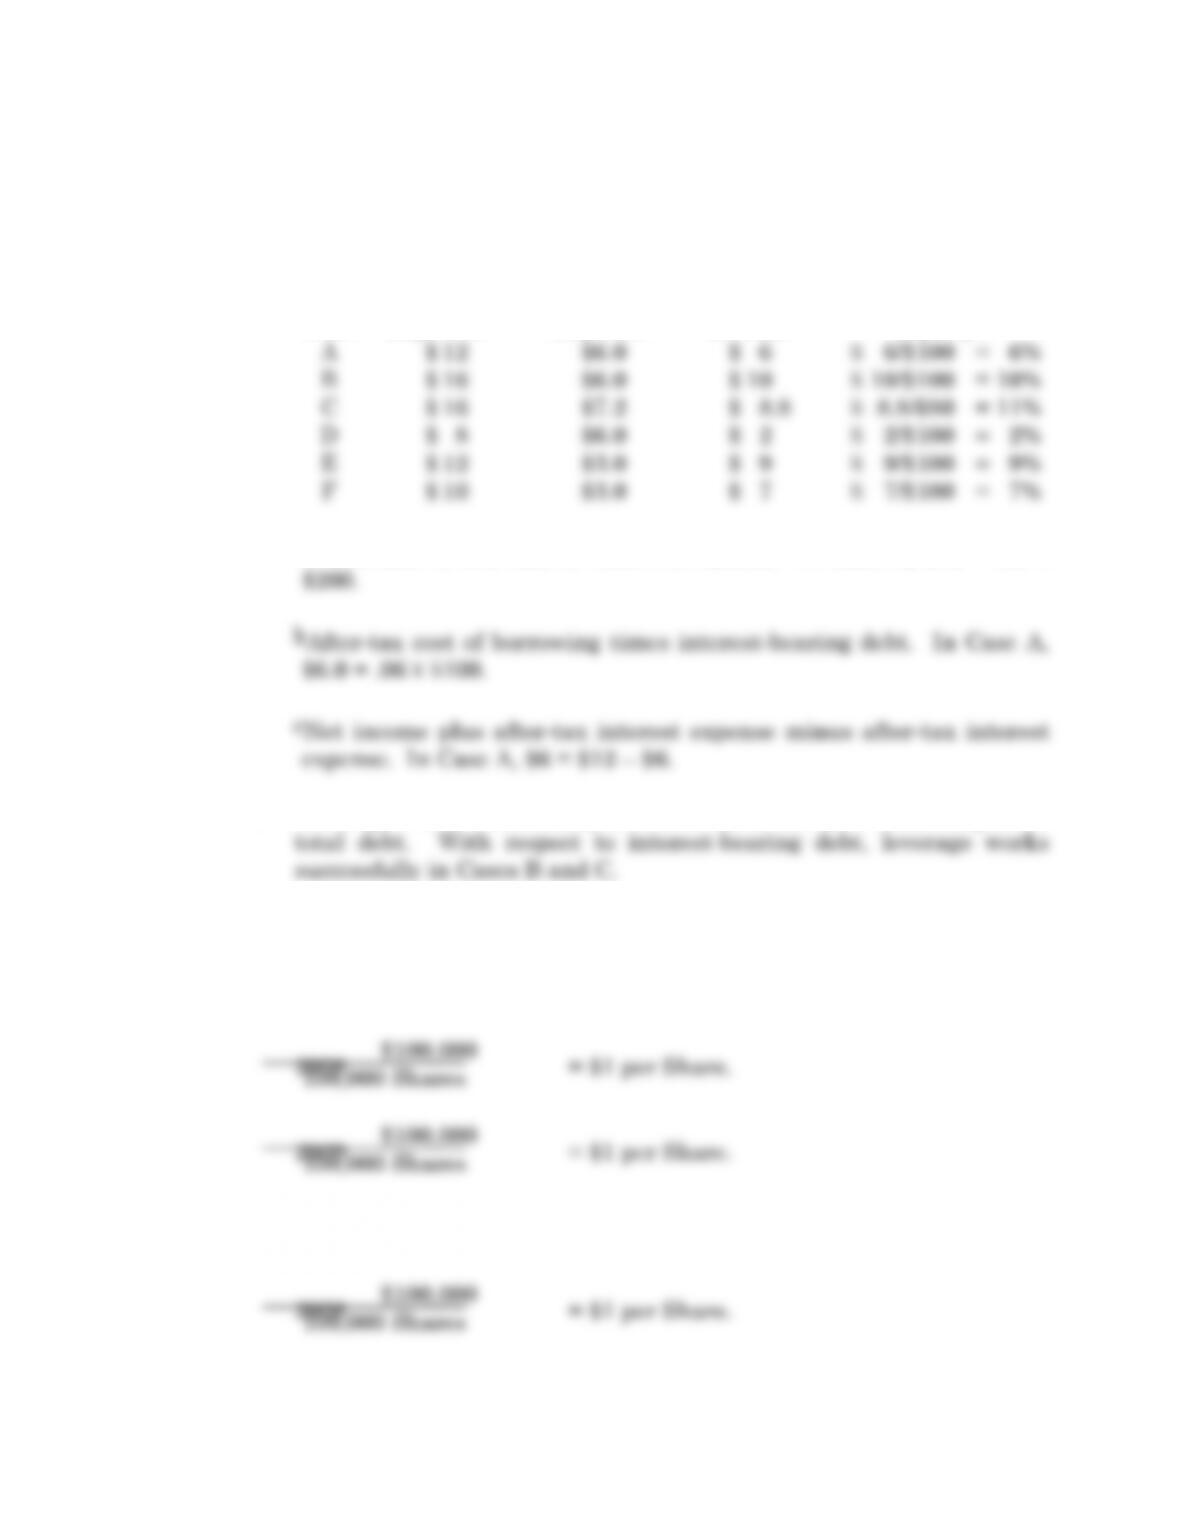
6.19 (Relating profitability to financial leverage.)
a. Net Income
Plus Rate of Return
After-Tax After-Tax on Common
Interest Interest Net Shareholders’
Case Expensea Expenseb Incomec Equity
aNumerator of the rate of return on assets. In Case A, $12 = .06 X
b. Leverage works successfully in Cases B, C, E, and F with respect to
6.20 (Company A/Company B; interpreting changes in earnings per share.)
a. Company A Earnings
per Share:
Company B Earnings
per Share:
6-15 Solutions
Solutions 6-16
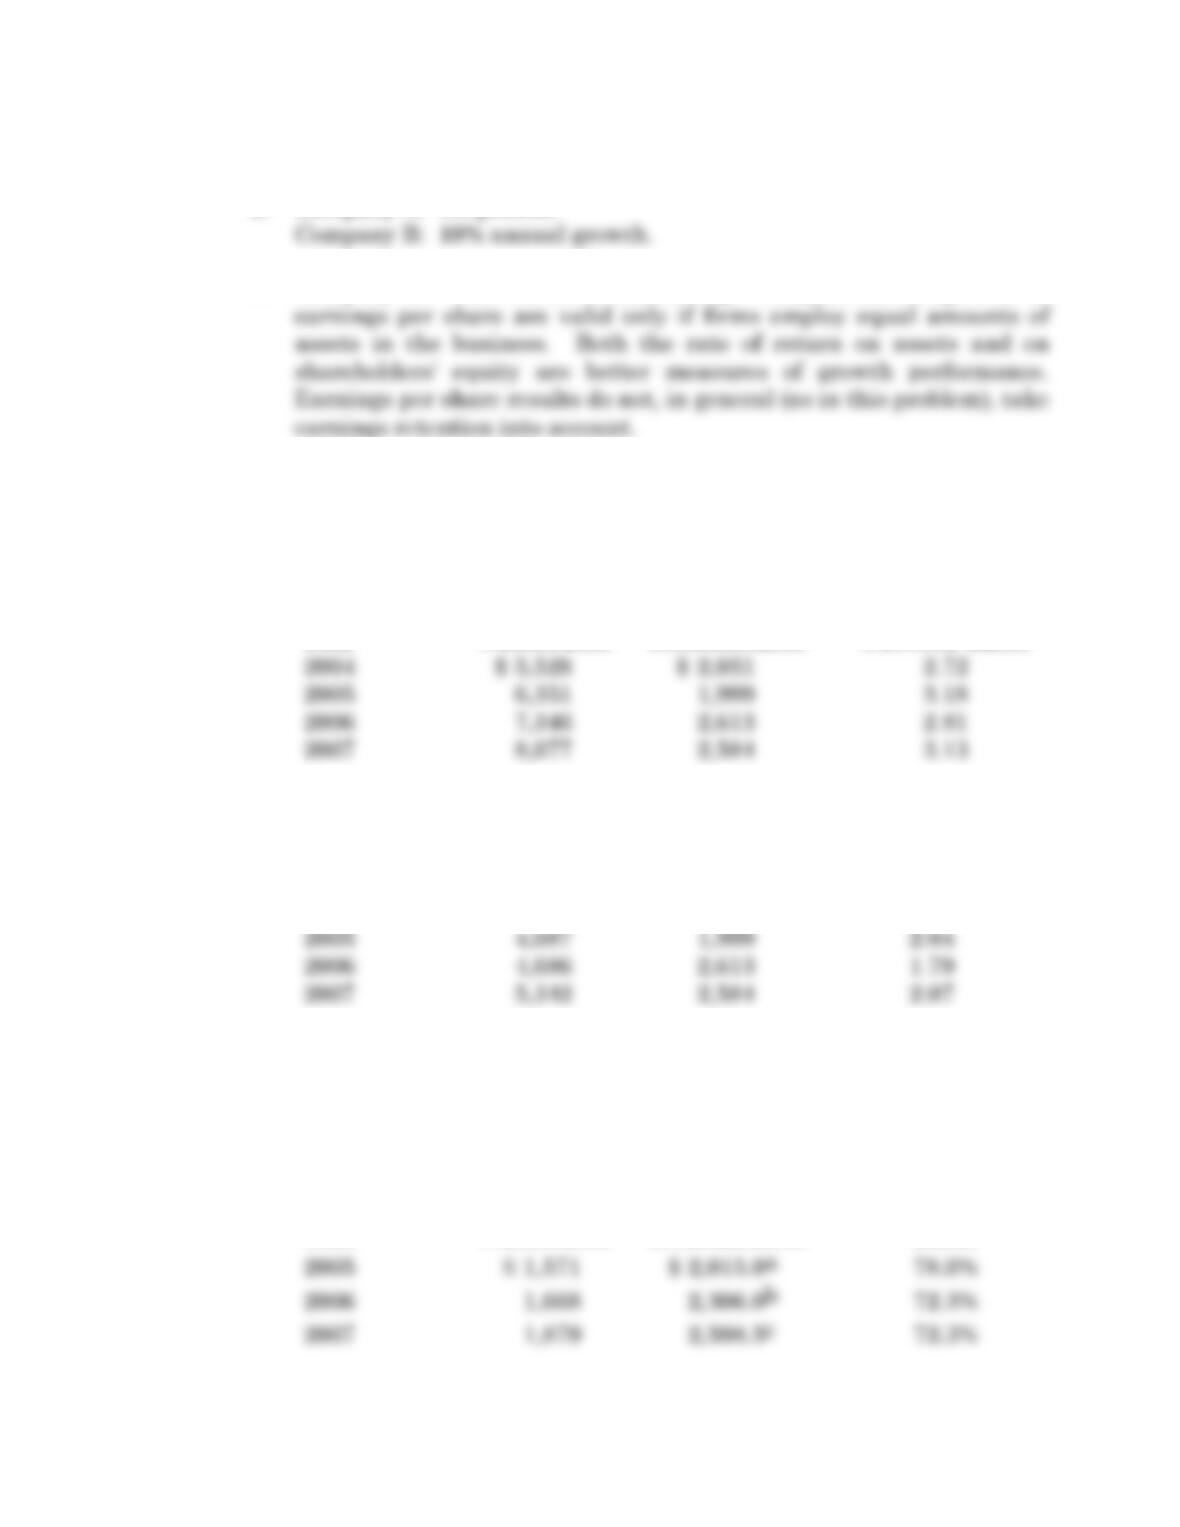
6.20 continued.
b. Company A: No growth.
c. Company B: This result is misleading. Comparisons of growth in
6.21 (NIKE; calculating and interpreting short-term liquidity ratios.)
(Amounts in Millions)
a. Current Ratio
Year
End Numerator Denominator Current Ratio
Quick Ratio
Year
End Numerator Denominator Quick Ratio
2004 $ 3,349 $ 2,031 1.65
b. Cash Flow from Operations to Current Liabilities Ratio
Cash Flow
from
Operations
to Current
Liabilities
Year Numerator Denominator Ratio
6-17 Solutions
a.5($2,031 + $1,999) = $2,015.0.
Solutions 6-18
6.21 b. continued.
Accounts Receivable Turnover Ratio
Accounts Receivable
Year Numerator Denominator Turnover Ratio
Inventory Turnover Ratio
Inventory
Year Numerator Denominator Turnover Ratio
Accounts Payable Turnover Ratio
Accounts Payable
Year Numerator Denominator Turnover Ratio
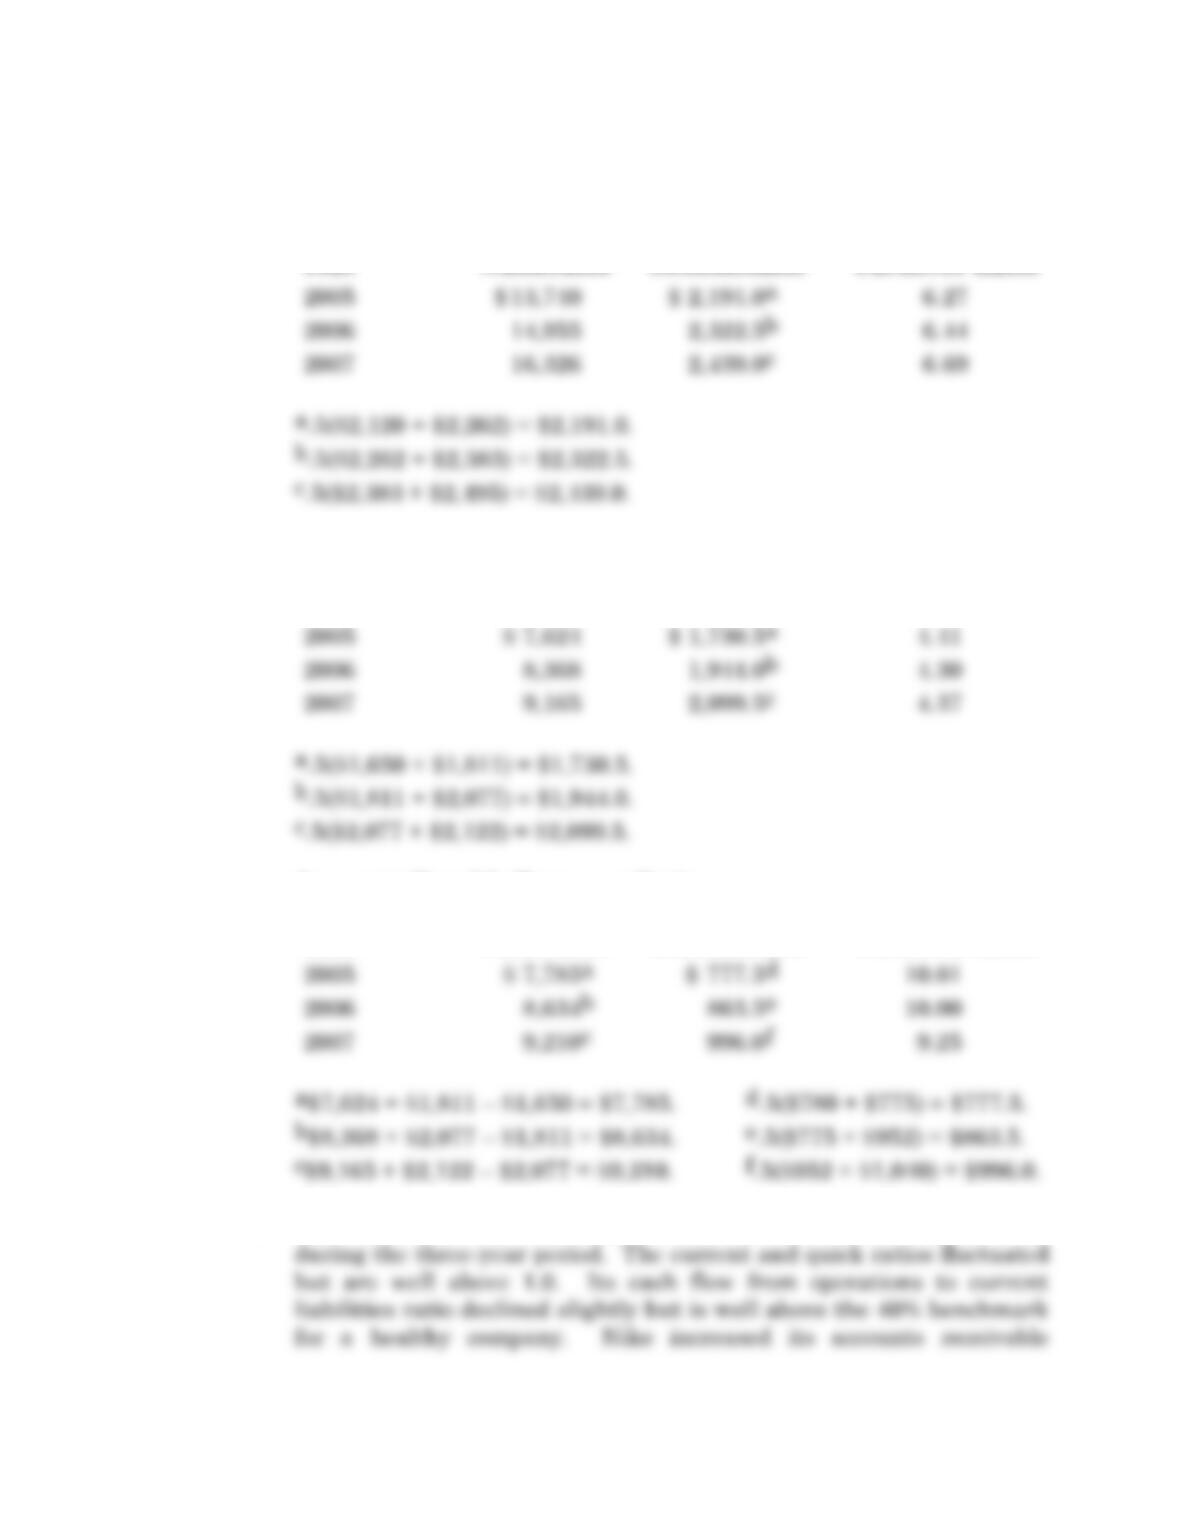
c. The short-term liquidity risk of Nike did not change significantly

6-19 Solutions
Solutions 6-20
6.21 c. continued.
6.22 (Nestle; calculating and interpreting short-term liquidity ratios.)
(Amounts in Millions of Euros)
a. Current Ratio
Year
End Numerator Denominator Current Ratio
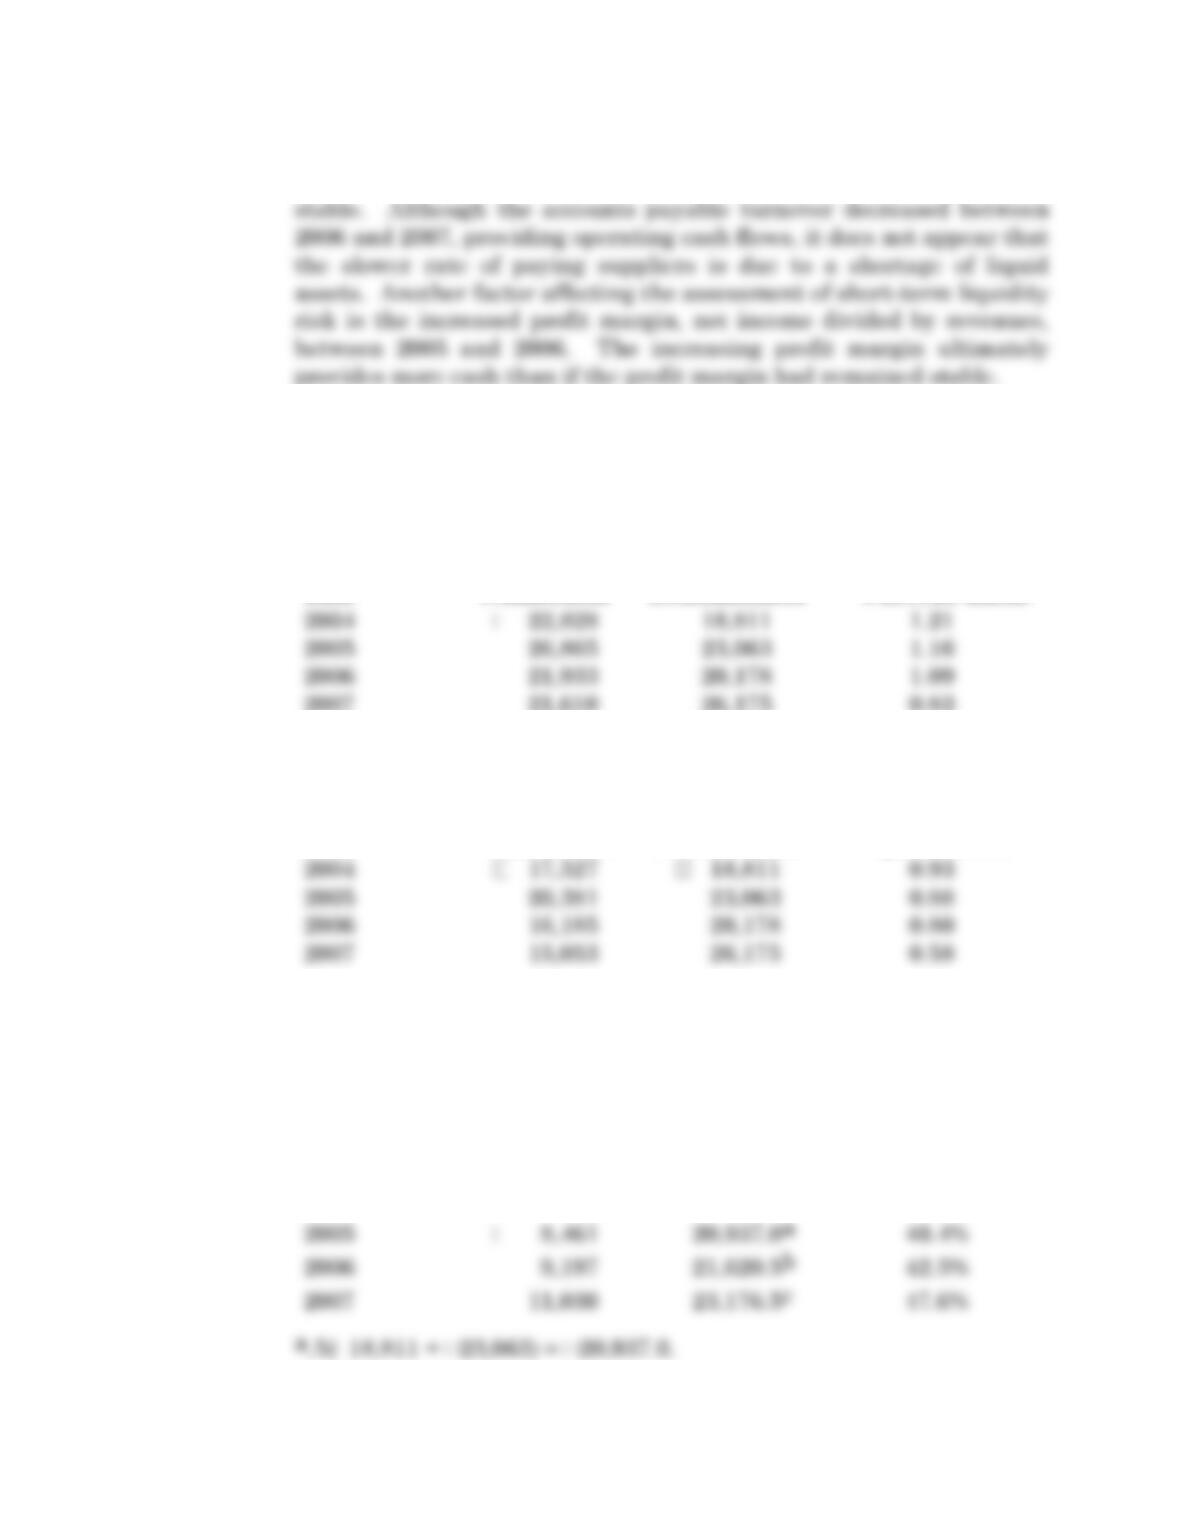
2007 21,610 26,175 0.83
Quick Ratio
Year
End Numerator Denominator Quick Ratio
b. Cash Flow from Operations to Current Liabilities Ratio
Cash Flow
from
Operations
to Current
Liabilities
Year Numerator Denominator Ratio