Unlock document.
This document is partially blurred.
Unlock all pages and 1 million more documents.
Get Access

5-41 Solutions
Solutions 5-42
5.36 continued.
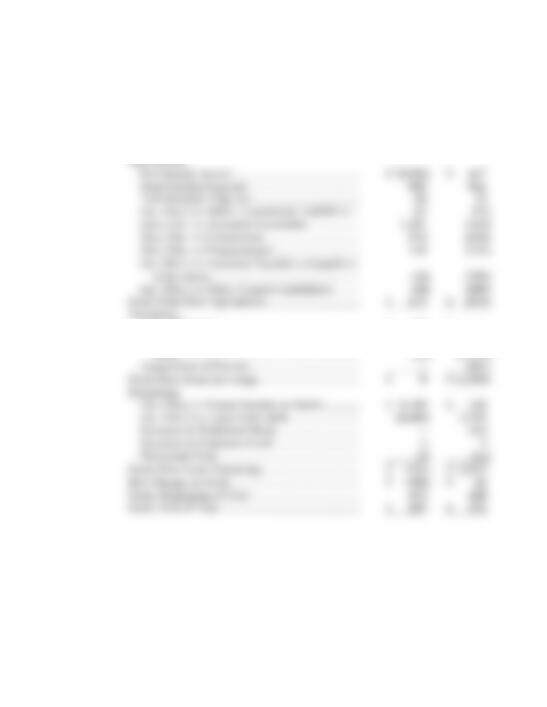
b. GTI, INC.
Statement of Cash Flows
For 2007 and 2008
2008 2007
Operations:
Sale of Patents ................................................ $ 63 $ --
Acquisition of Property, Plant and Equip-
ment ............................................................ (54) (1,433)
5-43 Solutions
5.36 continued.
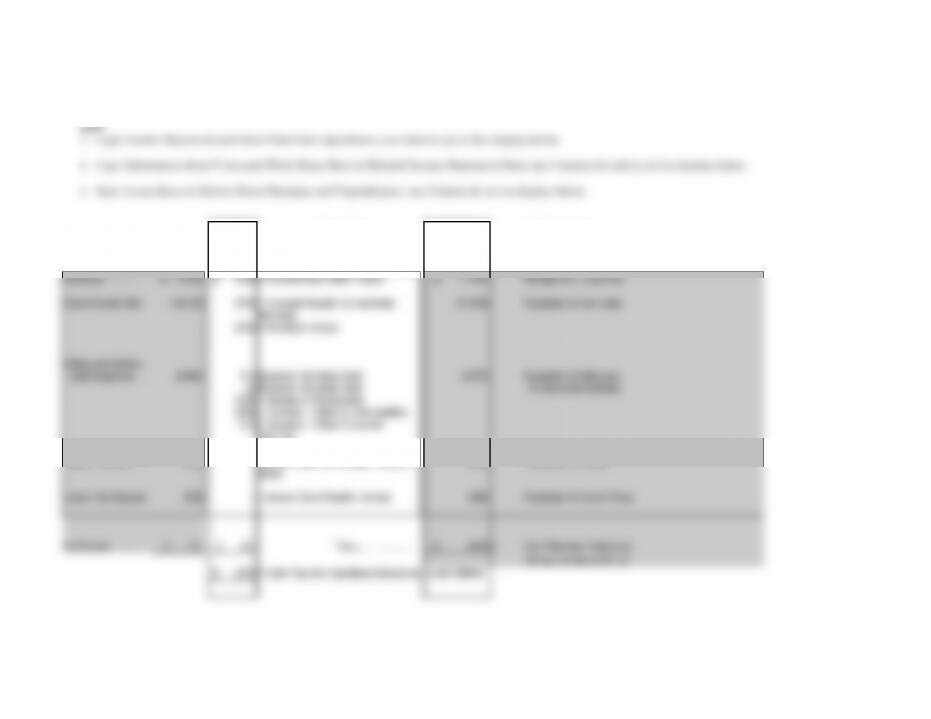
c. Deriving Direct Method Cash Flow from Operations Using Data from T-Account Work Sheet
(All Dollar Amounts in Thousands)
Indirect
Changes in
Direct
From Operations:
Operations, 2007
Method
Related Balance Sheet Accounts from
T-Account Work Sheet
Method
Receipts less Expenditures
(a)
(b)
(c)
(d)
2007
Revenues…………..
$ 22,833
$ (168)
= Accounts Receivable Increase
$ 22,665
Receipts from Customers
Cost of Goods Sold
(16,518)
(769)
= Accounts Payable for Inventories
Decrease
(17,919)
Payments for Inventories
(632)
= Inventory Increase
Selling and Adminis-
trative Expenses…. (4,849)
641
(Expense Not Using Cash)
(4,673)
Payments for Selling and
25
(Expense Not Using Cash)
Administrative Services
(154)
= Increase in Prepayments
(299)
= Decrease in Other Current Liabilities
(37)
= Decrease in Other Noncurrent
Liabilities
Interest Expense……
(459)
-
Interest Payable (no change in balance
sheet)
(459)
Payments for Interest
Income Tax Expense.
(590)
-
= Income Taxes Payable Increase
(590)
Payments for Income Taxes
Net Income……….…
$ 417
$ 417
Totals………………
$ (976)
=
Cash Flow from Operations
Derived via Direct Method
$ (976)
= Cash Flow from Operations Derived via Indirect Method
Solutions 5-44
5.36 continued.
d. Cash flow from operations was negative during 2007, despite positive
and prepayments with only minor reductions in current operating
liabilities. The small reductions in current operating liabilities
relative to the declines in current operating assets reflect either a
stretching of short-term creditors or a return to a normal level of
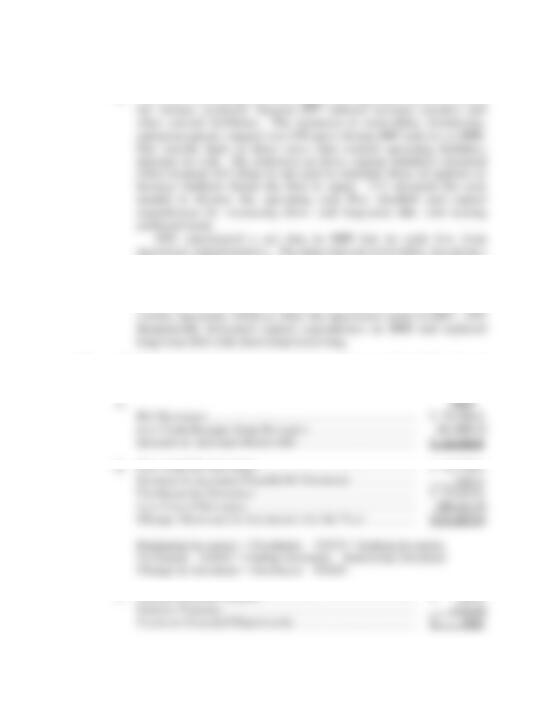
5.37 (CVS Caremark Corporation; interpreting a statement of cash flows based
on the direct method for presenting cash flow from operations.)
c. Amount Paid for Interest ................................................... $ 468.2
5-45 Solutions
Solutions 5-46
5.38 (CVS Caremark Corporation; interpreting a statement of cash flows based
on the direct method for presenting cash flow from operations.)
a. 2006
b. Cost of Revenues ................................................................. $ 32,079.2
Increase in Inventories for the Year .................................. 624.1
Purchases for Inventory ..................................................... $ 32,703.3
5.39 (Nordstrom Inc.; Derive cash flow from operations presented with the direct method from annual report presentation that uses the indirect
method.)
Deriving Direct Method Cash Flow from Operations Using Data from T-Account Work Sheet
(All Dollar Amounts in Millions)
Fiscal Year 2006
Indirect
Changes in
Direct
Operations
Method
Related Balance Sheet Accounts from
T-Account Work Sheet
Method
(a)
(b)
(c)
(d)
Net Sales .................
$ 8,560.7
$ 17.1
(61.3)
= Provision for Bad Debt Expense
= Accounts Receivable Increase
$ 8,577.8
(61.3)
$ 8,516.5 Receipts from Customers
Cost of Goods Sold ..
(5,353.9)
(38.6)
84.3
= Merchandise Inventories Increase
= Accounts Payable Increase
$ (5,392.5)
84.3
( 5,308.2) Payments to Suppliers of Merchandise
Selling General and
Administrative
Expenses ............... (2,296.9)
248.2
37.4
(4.7)
= Depreciation and Amortization, Net not
Using Cash this Period
= Stock-Based Compensation Expense
= Prepaid Expenses Increase
$ 248.2
(2,259.5)
(4.7)
48.7
= Accrued Salaries, Wages and Related
Benefits Increase
48.7
(1,967.3) Payments for S, G & A
Interest Expense ......
(42.8)
$ (42.8)
(42.8) Payments for Interest
Other Income, Net ....
238.5
128.0
= Asset Backed Securities Decrease
(Increase)
$ 366.5
(7.7)
= Other Assets Increase
(7.7)
23.5
= Other Current Liabilities Increase
23.5
30.7
= Deferred Property Incentives Increase
30.7
17.3
= Other Liabilities Increase
17.3
430.3 New Receipts for Other Items
Income Tax Expense
(427.6)
(58.3)
= Deferred Income Tax Benefits
$ (485.9)
43.6
= Tax Benefits from Stock-Based Payments
43.6
(38.3)
= Excess Stock Benefits from Stock-Based
Payments
(38.3)
(5.5)
= Income Taxes Payable Decrease
(5.5)
(486.1) Payments for Income Taxes
Net Income ...............
$ 678.0
$ 678.0
$ 1,142.4
= Cash Flow from Operations Derived via
$ 1,142.4
$ 1,142.4 Cash Flow from Operations
Indirect Method
Derived via the Direct Method
5.40 (Nordstrom Inc.; Derive cash flow from operations presented with the direct method from annual report presentation that uses the indirect
method.)
Deriving Direct Method Cash Flow from Operations Using Data from T-Account Work Sheet
(All Dollar Amounts in Millions)
Fiscal Year 2005
Indirect
Changes in
Direct
Operations
Method
Related Balance Sheet Accounts from
T-Account Work Sheet
Method
(a)
(b)
(c)
(d)
Net Sales .................
$ 7,722.8
$ 20.9
(15.1)
= Provision for Bad Debt Expense
= Accounts Receivable Increase
$ 7,743.7
(15.1)
$ 7,728.6 Receipts from Customers
Cost of Goods Sold ..
(4,888.0)
(20.8)
31.7
= Merchandise Inventories Increase
= Accounts Payable Increase
$ (4,908.8)
31.7
(4,877.1) Payments to Suppliers of Merchandise
Selling General and
Administrative
Expenses ............... (2,100.7)
242.9
13.3
(1.0)
= Depreciation and Amortization, Net not
Using Cash this Period
= Stock-Based Compensation Expense
= Prepaid Expenses Increase
$ 242.9
(2,087.4)
(1.0)
(11.3)
= Accrued Salaries, Wages and Related
Benefits Increase
(11.3)
(1,856.8) Payments for S, G & A
Interest Expense ......
(45.3)
$ (45.3)
(45.3) Payments for Interest
Other Income, Net ....
196.4
(135.8)
= Asset Backed Securities Decrease
(Increase)
$ 60.6
(3.5)
= Other Assets Increase
(3.5)
38.8
= Other Current Liabilities Increase
38.7
49.5
= Deferred Property Incentives Increase
49.5
19.3
= Other Liabilities Increase
19.3
164.6 New Receipts for Other Items
Income Tax Expense
(333.9)
(11.2)
= Deferred Income Tax Benefits
$ (345.1)
41.1
= Tax Benefits from Stock-Based Payments
41.1
--
= Excess Stock Benefits from Stock-Based
Payments
--
(33.9)
= Income Taxes Payable Decrease
(33.9)
(337.9) Payments for Income Taxes
Net Income ...............
$ 551.3
$ 551.3
$ 776.2
= Cash Flow from Operations Derived via
$ 776.2
$ 776,2 Cash Flow from Operations
Indirect Method
Derived via the Direct Method

5-49 Solutions
5.41 (Quinta Company; working backwards through the statement of cash
flows.)
QUINTA COMPANY
Condensed Balance Sheet
January 1, 2008
($ in 000's)
Assets
Current Assets:
Cash ................................................................. $ 20
Accounts Payable ............................................ $ 255
Other Current Liabilities ................................ 130
Total Current Liabilities ............................. $ 385
Bonds Payable ..................................................... 60
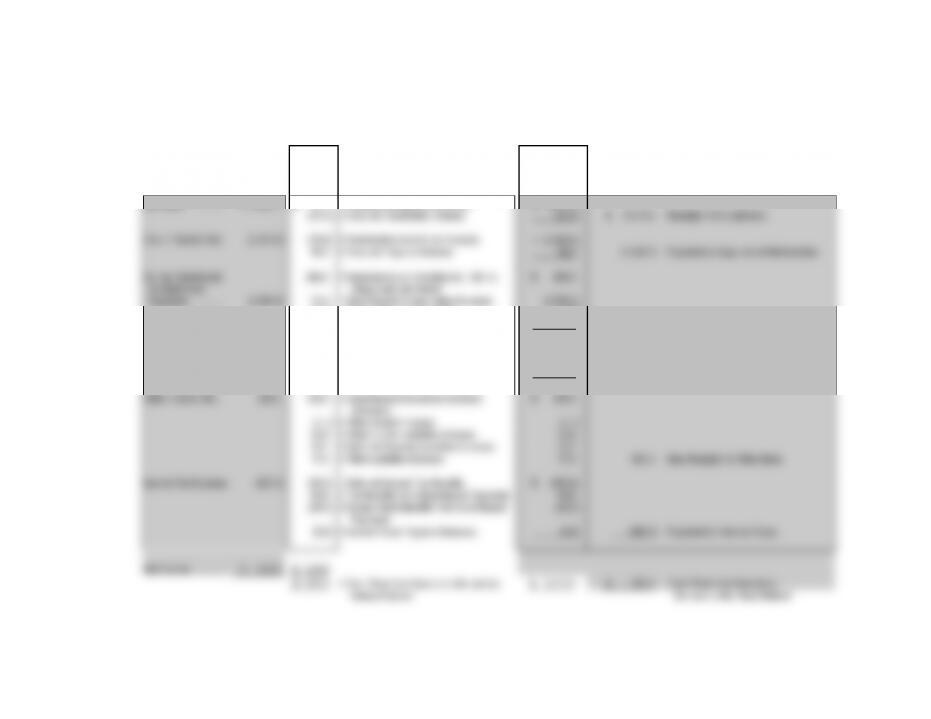
Shown below are T-accounts for deriving the solution. Entries (1)—(13)
are reconstructed from the statement of cash flows. Changes for the year
are appropriately debited or credited to end-of-year balances to get

Solutions 5-50
5-51 Solutions
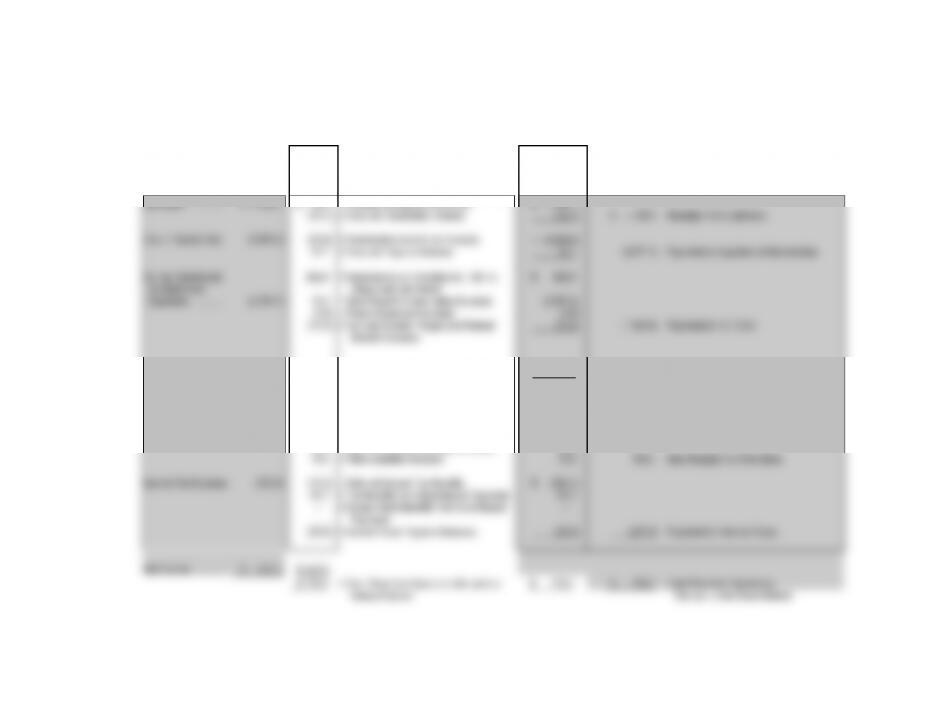
5.41 continued.
Buildings Accumulated
Land and Equipment Depreciation
Other Current
Bonds Payable Common Stock Retained Earnings
Shown on the following page is the Transactions Spreadsheet. Entries (1)—(13)
are reconstructed from the statement of cash flows. Changes for the year are
appropriately debited or credited to end-of-year balances to get beginning-of-year
balances. Amounts are shown in thousands.
Solutions 5-52
5.41 continued.
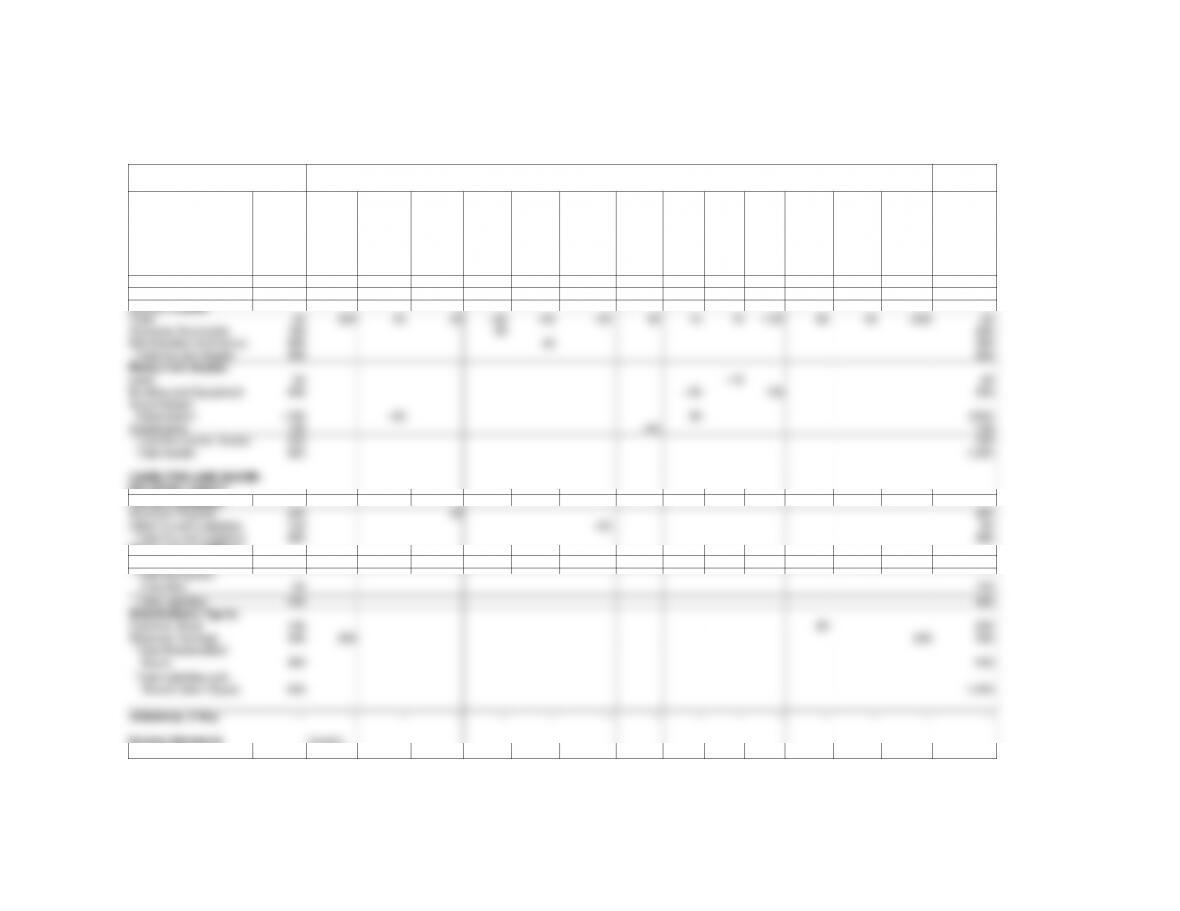
Following, we show the Transaction Spreadsheet for those who prefer to work problems with it, not with T-accounts.
Transactions spreadsheet.
Balance Sheet Accounts
Transactions, By Number and Description
Balance:
Begin-
ning of
Period
(Derived)
Net
Income
for Year
Depreci-
ation
Expense
Increase
in
Accounts
Payable
Increase
in
Accounts
Receiv-
able
Increase
in Mer-
chandise
Inven-
tories
Decrease
in Other
Current
Liabilities
Sale
of Invest-
ments
Sale of
Build-
ings
and
Equip-
ment
Sale of
Land
Acquire
New
Build-
ings
and
Equip-
ment
Issue
Common
Stock
Issue
Bonds
Payable
Dividends
Paid in
Cash
Balance:
End of
Period
(Given)
1
2
3
4
5
6
7
8
9
10
11
12
13
ASSETS
Current Assets:
Cash
20
200
60
25
–30
–40
–45
40
15
10
–130
60
40
–200
25
Accounts Receivable
190
30
220
Merchandise Inventories
280
40
320
Total Current Assets
490
565
Noncurrent Assets:
Land
50
–10
40
Building and Equipment
405
–35
130
500
Accumulated
Depreciation
–160
–60
20
(200)
Investments
140
–40
100
Total Noncurrent Assets
435
440
Total Assets
925
1,005
LIABILITIES AND SHARE-
HOLDERS’ EQUITY
Current Liabilities:
Accounts Payable
255
25
280
Other Current Liabilities
130
–45
85
Total Current Liabilities
385
365
Noncurrent Liabilities:
Bonds Payable
60
40
100
Total Noncurrent
Liabilities
60
100
Total Liabilities
445
465
Shareholders' Equity:
Common Stock
140
60
200
Retained Earnings
340
200
–200
340
Total Shareholders'
Equity
480
540
Total Liabilities and
Shareholders' Equity
925
1,005
Imbalance, if Any
-
-
-
-
-
-
-
-
-
-
-
-
-
-
-
Income Statement
Accounts
Income
Summary


