
Supplement
G Acceptance Sampling Plans
1. Acceptance Sampling Quality and Risk Decisions
• Acceptance sampling; Definition and purpose
o Impact of TQM
• Basic procedure
• Key terms
o Producer
o Consumer
o Sampling plan
• Quality and risk decisions
o Acceptable quality level (AQL)
▪ Producer’s risk (
)
o Lot tolerance proportion defective (LTPD)
▪ Consumer’s risk (
)
2. Sampling Plans
1. Single-sampling plans (for attributes)
• Specified by sample size, n, and acceptable number of defectives, c, found in that
sample.
• Single-sampling procedure for determining whether to accept a lot:
• The risks
2. Double-sampling plan
• Specified by two sample sizes, (
n1
and
n2
), and two acceptance numbers (
c1
and
c2
).
• Procedure for determining whether to accept a lot:
3. Sequential-sampling plan
• Results of random samples, tested one-by-one, are compared to sequential-sampling
chart.
• Chart guides decision to reject, accept, or continue sampling.
3. Operating Characteristic Curves
• Select sample size n and acceptance number c.
1. Drawing the OC curve
a Each item inspected is either defective or not defective (binomial).
b When n > 20 and p < 0.05, use Poisson distribution to prepare (OC) curve. It shows the
probability of accepting a lot
P
a
, as a dependent function of p, the true proportion of
defectives in the lot.
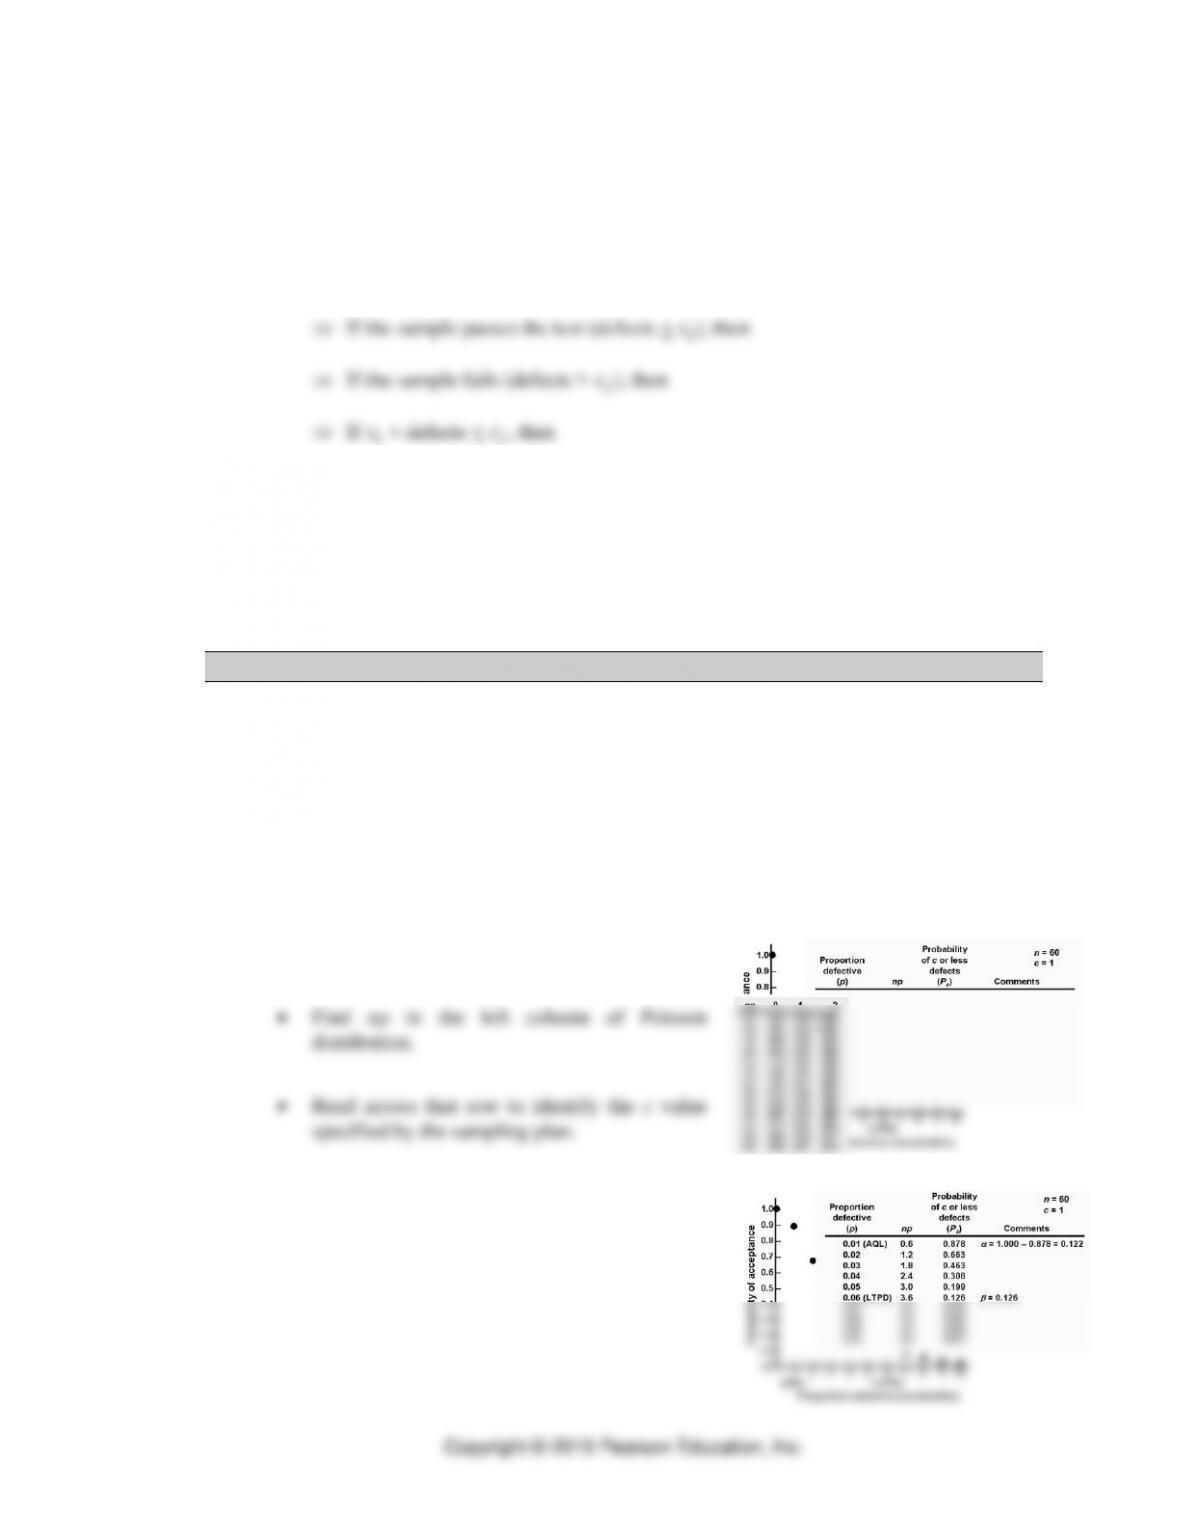
c. Steps for drawing an operating characteristics curve, given n and c:
• Select a value for p and calculate np.
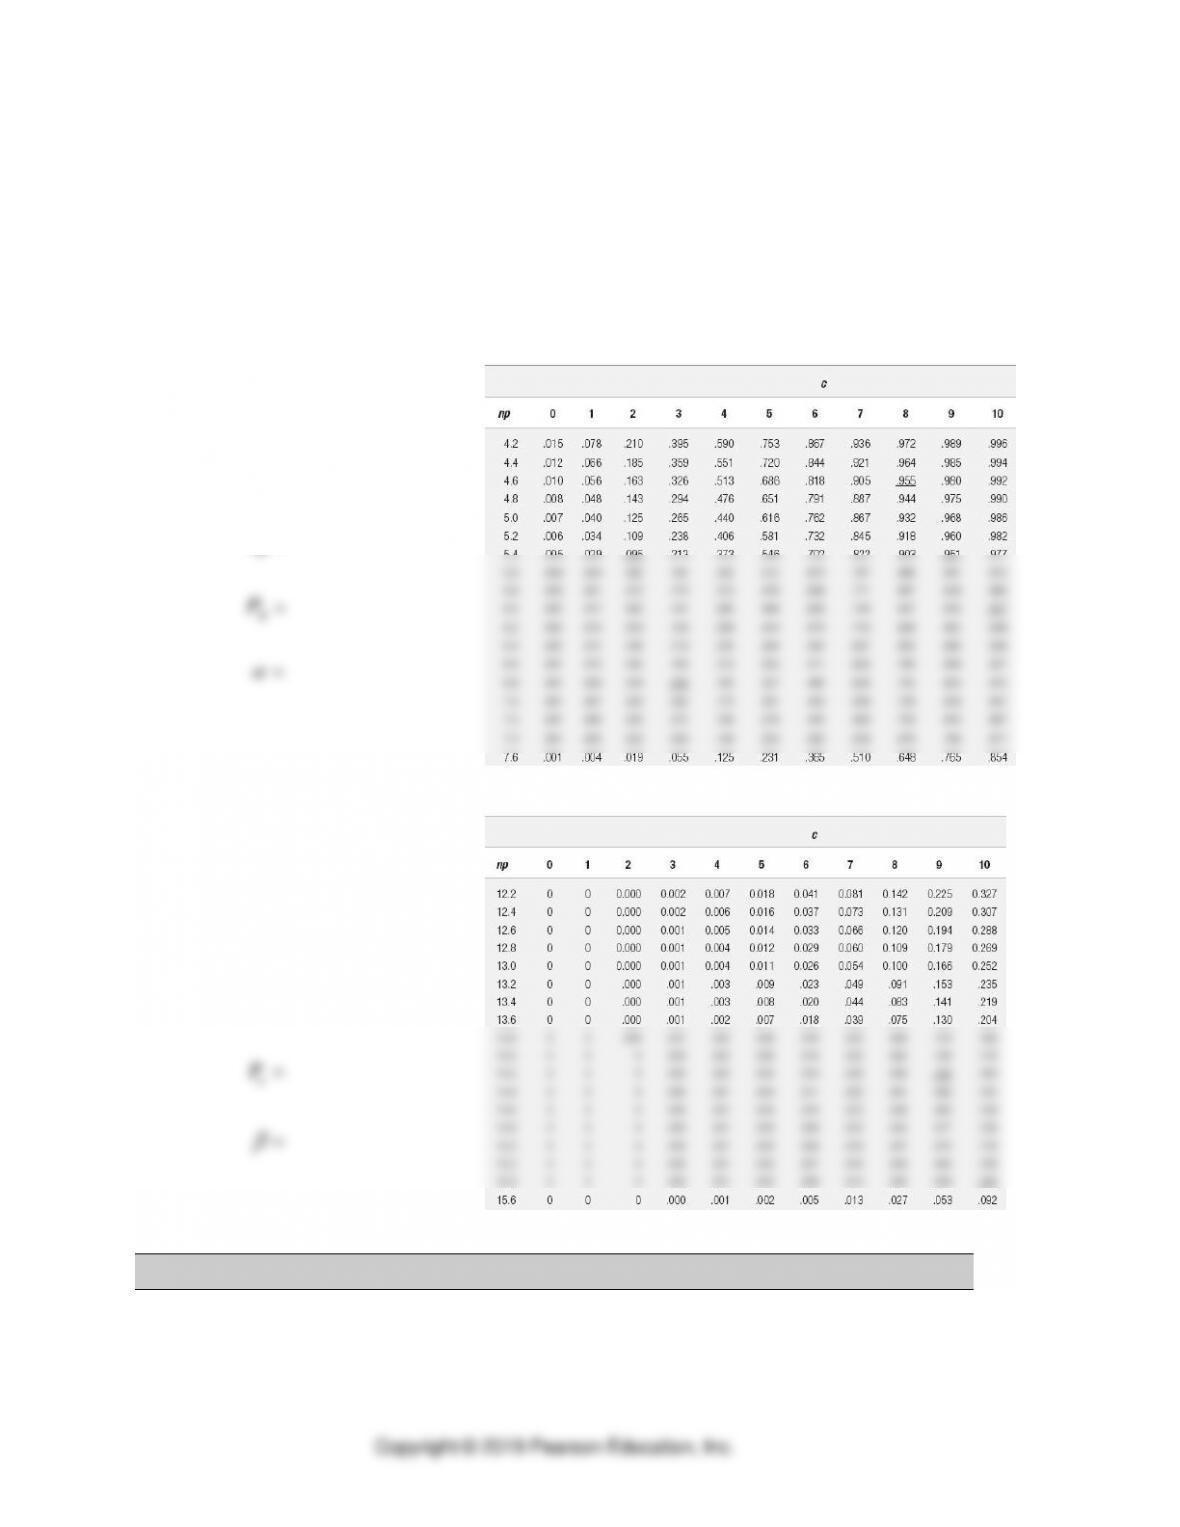
• Find
P
a
, the probability of accepting the lot for
the selected value of p. Plot this point on a
graph with
P
a
on the vertical axis, and p on the
horizontal axis.
• Return to the first step, selecting a different value for p, and continue this process for
a range of p values.
d. Application G.1: Drawing the OC Curve
A sampling plan is being evaluated where c = 10 and n = 193. If AQL = 0.03 and LTPD
= 0.08, what are the producer’s risk and consumer’s risk for the plan?
How would you draw the OC curve for this plan?
• Finding
(probability of
rejecting AQL quality)
=
=
np
p
• Finding
(probability of
accepting LTPD quality)
p
np
P
a
=
=
=
=
4. Selecting a Single-Sampling Plan
Understanding changes in the OC curve
1. Sample size effect
2. Acceptance level effect
5. Average Outgoing Quality
• AOQ is the expected (or Average) proportion of defects that a particular sampling plan would
allow to pass through (Outgoing Quality from) inspection.
o Rectified inspection—defects
found during the sampling process
are removed and reworked or
replaced with conforming
material.
o AOQL is the maximum value of
the average outgoing quality over
different AOQs and AOQLs.
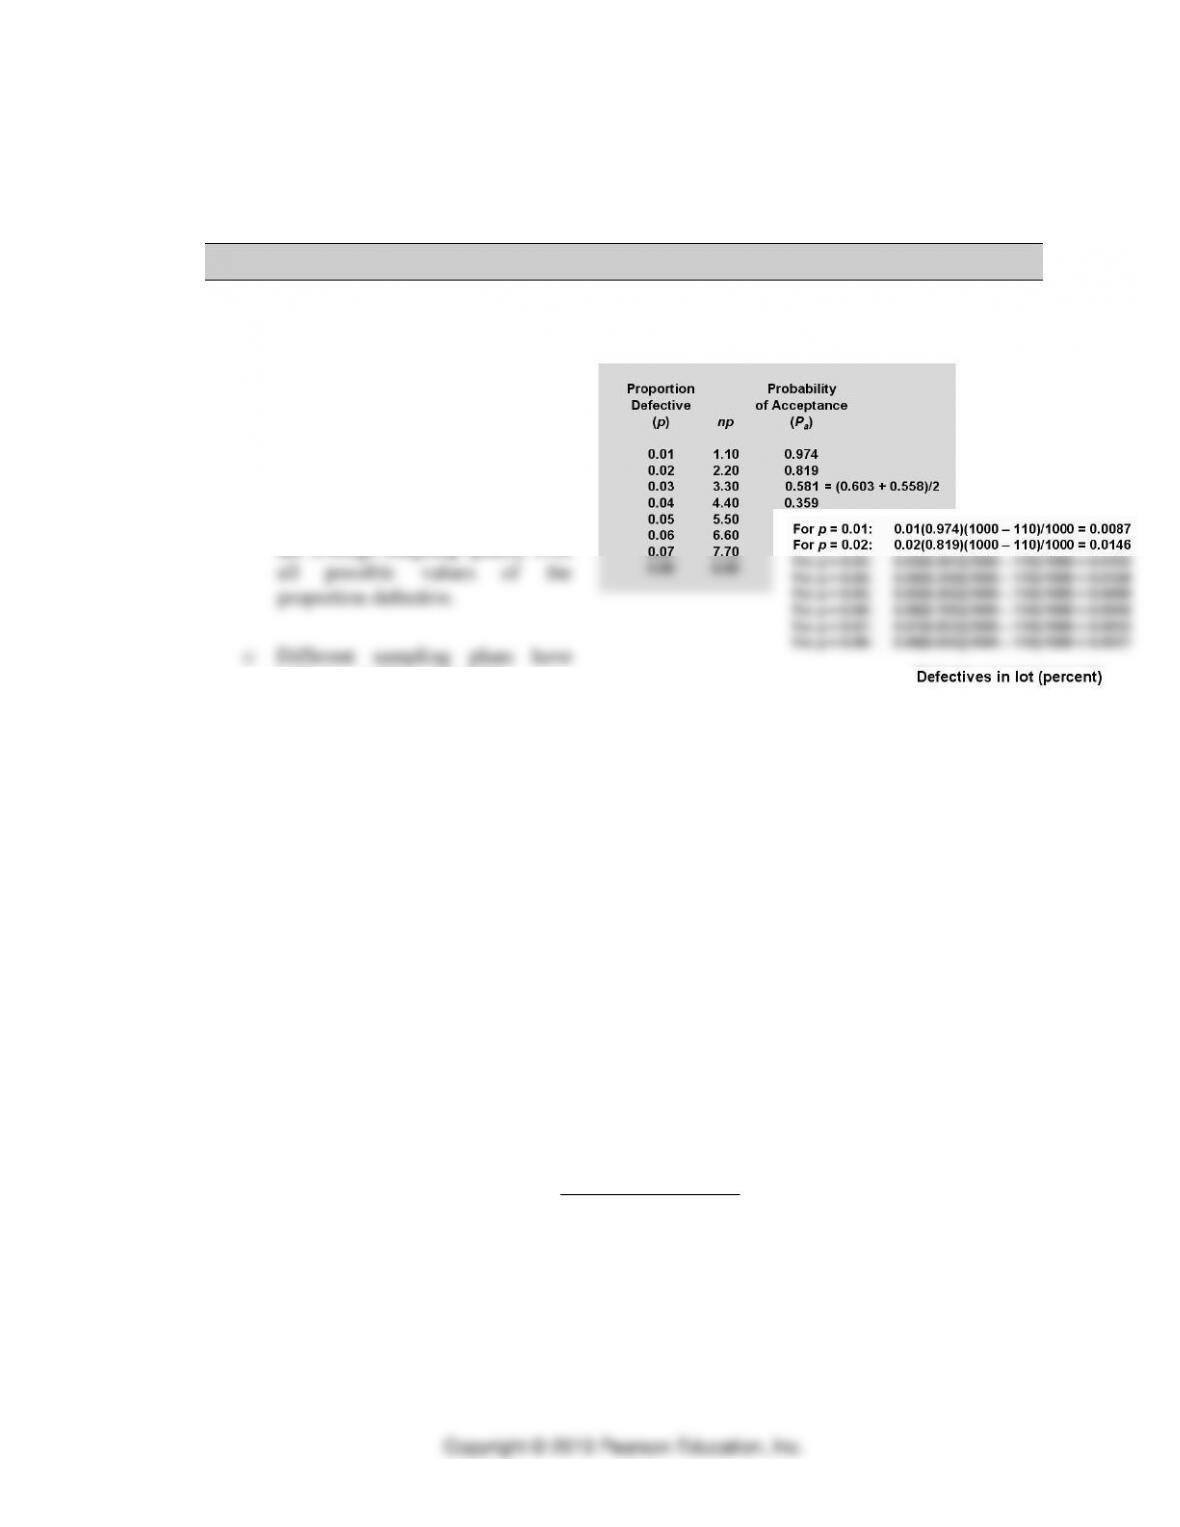
• The AOQL is found by calculating AOQ at several values for p, then setting AOQL equal to
the highest occurring AOQ.
• Application G.2: Average Outgoing Quality: demonstrating the model for computing
AOQ.
Management has selected the following parameters:
AQL
LTPD
n c
= =
= =
= =
001 005
006 010
100 3
. .
. .
What is the AOQ if p = 0.05 and N = 3000?
( )( )
==
=
=
=
3000
2900
AOQ
p
np
p
a