Supplement
B
Waiting Lines
PROBLEMS
Structure of Waiting-Line Problems
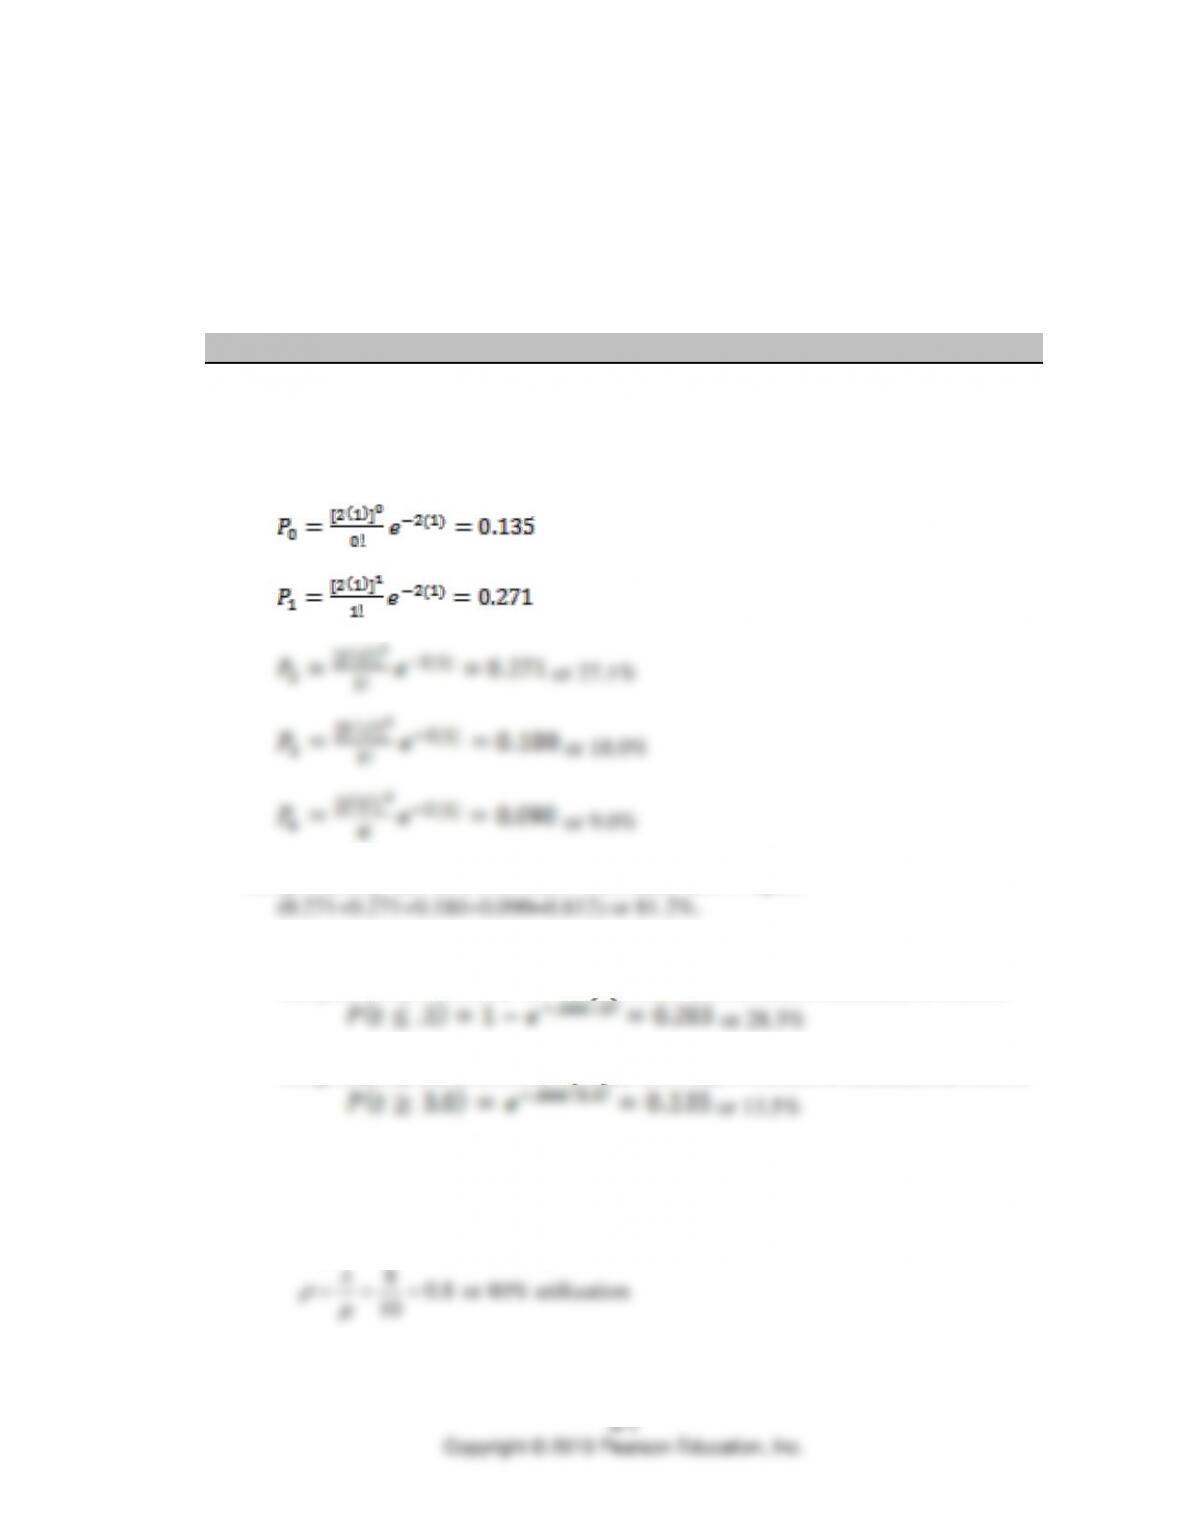
1. Wingard Credit Union
or 13.5%
or 27.1%
The probability that between 1 and 4 customers arrive equals
2. Wingard Credit Union part 2
The probability a customer will take less than half a minute is calculated as follows
The probability that a customer will take more than 3 minutes is calculated as follows
Using Waiting-Line Models to Analyze Operations
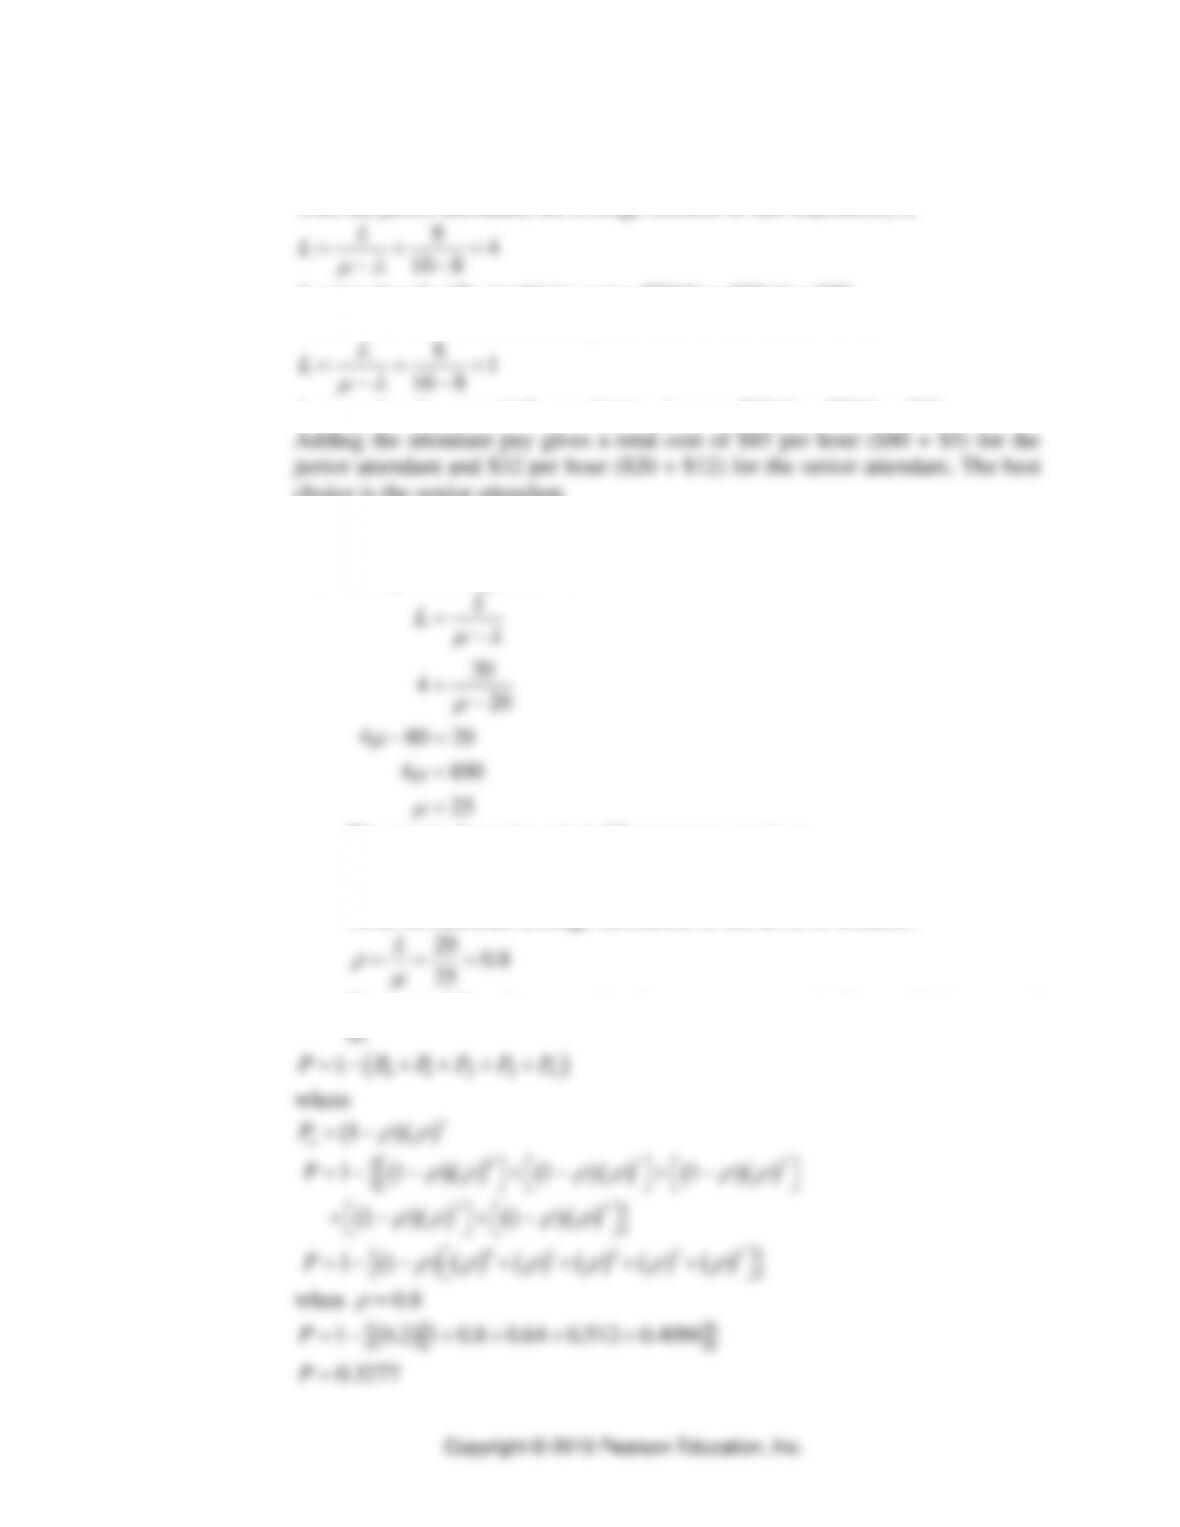
3. Solomon, Smith and Samson
a. Single-server model, average utilization rate.
80.8
10
= = =
or 80% utilization
B-2 ⚫ PART 1 ⚫ Managing Processes
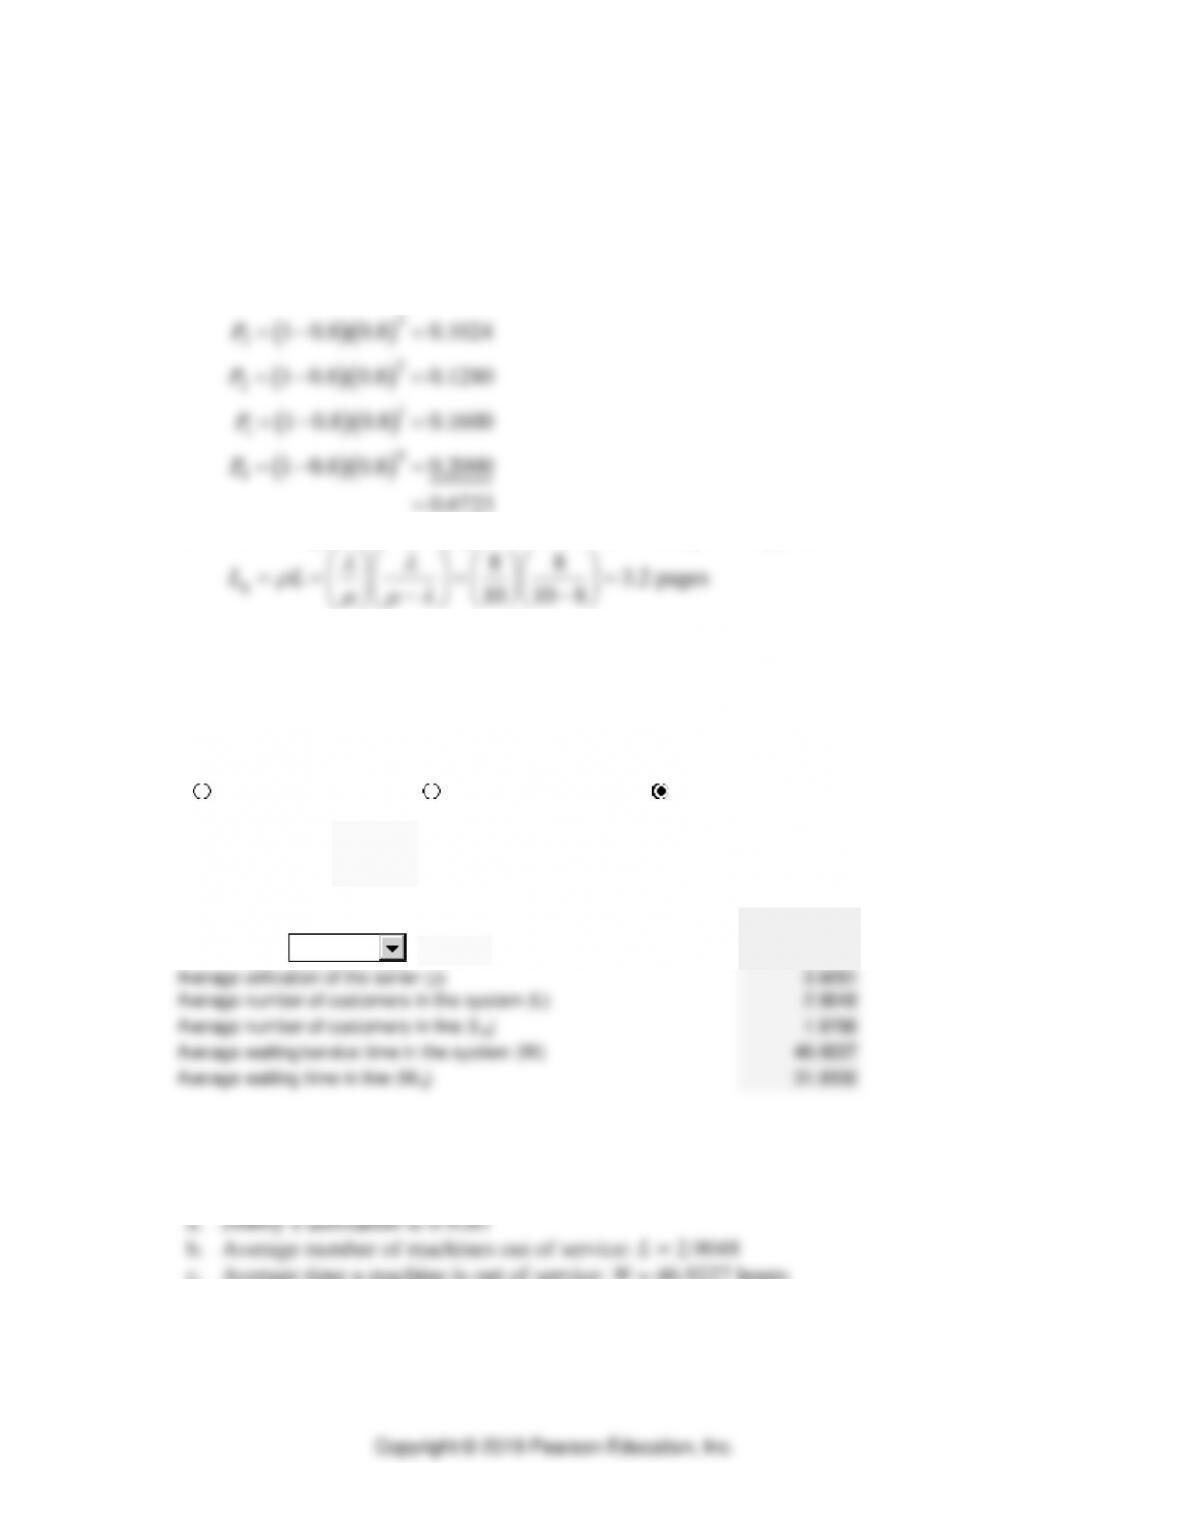
b. The probability of four or fewer documents in the system is 0.6723 as shown
following. Therefore, the probability of more than four documents in the system
is 1 – 0.6723 = 0.3277.
( )( )
( )( )
( )( )
( )( )
( )( )
( )( )
4
4
3
3
2
2
1
1
0
0
1
1 0.8 0.8 0.0819
1 0.8 0.8 0.1024
1 0.8 0.8 0.1280
1 0.8 0.8 0.1600
1 0.8 0.8 0.2000
0.6723
n
n
P
P
P
P
P
P
=−
= − =
= − =
= − =
= − =
= − =
=
c. The average number of pages of documents waiting to be typed,
883.2 pages
10 10 8
q
LL
= = = =
−−
4. Benny’s Arcade
Because there are only six machines, we must use the finite source model.
Solver – Waiting Lines
Enter data in yellow shaded areas.
Customers 6
Arrival Rate () 0.02
Service Rate () 0.0667
Probability of zero customers in the system (P0) 0.0719
Probability of 4
customers in the system (Pn) #N/A
Average utilization of the server () 0.9281
Average number of customers in the system (L) 2.9048
Average number of customers in line (Lq) 1.9766
Average waiting/service time in the system (W) 46.9227
Average waiting time in line (Wq) 31.9302
Single-server model
Multiple-server model
Finite-source model
at most
c. Average time a machine is out of service: W = 46.9227 hours
5. Moore, Akin, and Payne (dental clinic). Multiple-server model. This problem is
Waiting Lines ⚫ SUPPLEMENT B ⚫ B-3
a. Operating characteristics when 3 chairs are staffed
Parameter Value
—————————————-
Arrival rate(lambda) 5
Service rate(mu) 2
Number of servers 3
Result Value
———————————————
B-4 ⚫ PART 1 ⚫ Managing Processes
Operating characteristics when 4 chairs are staffed
Parameter Value
—————————————-
Arrival rate(lambda) 5
Service rate(mu) 2
Number of servers 4
Result Value
———————————————
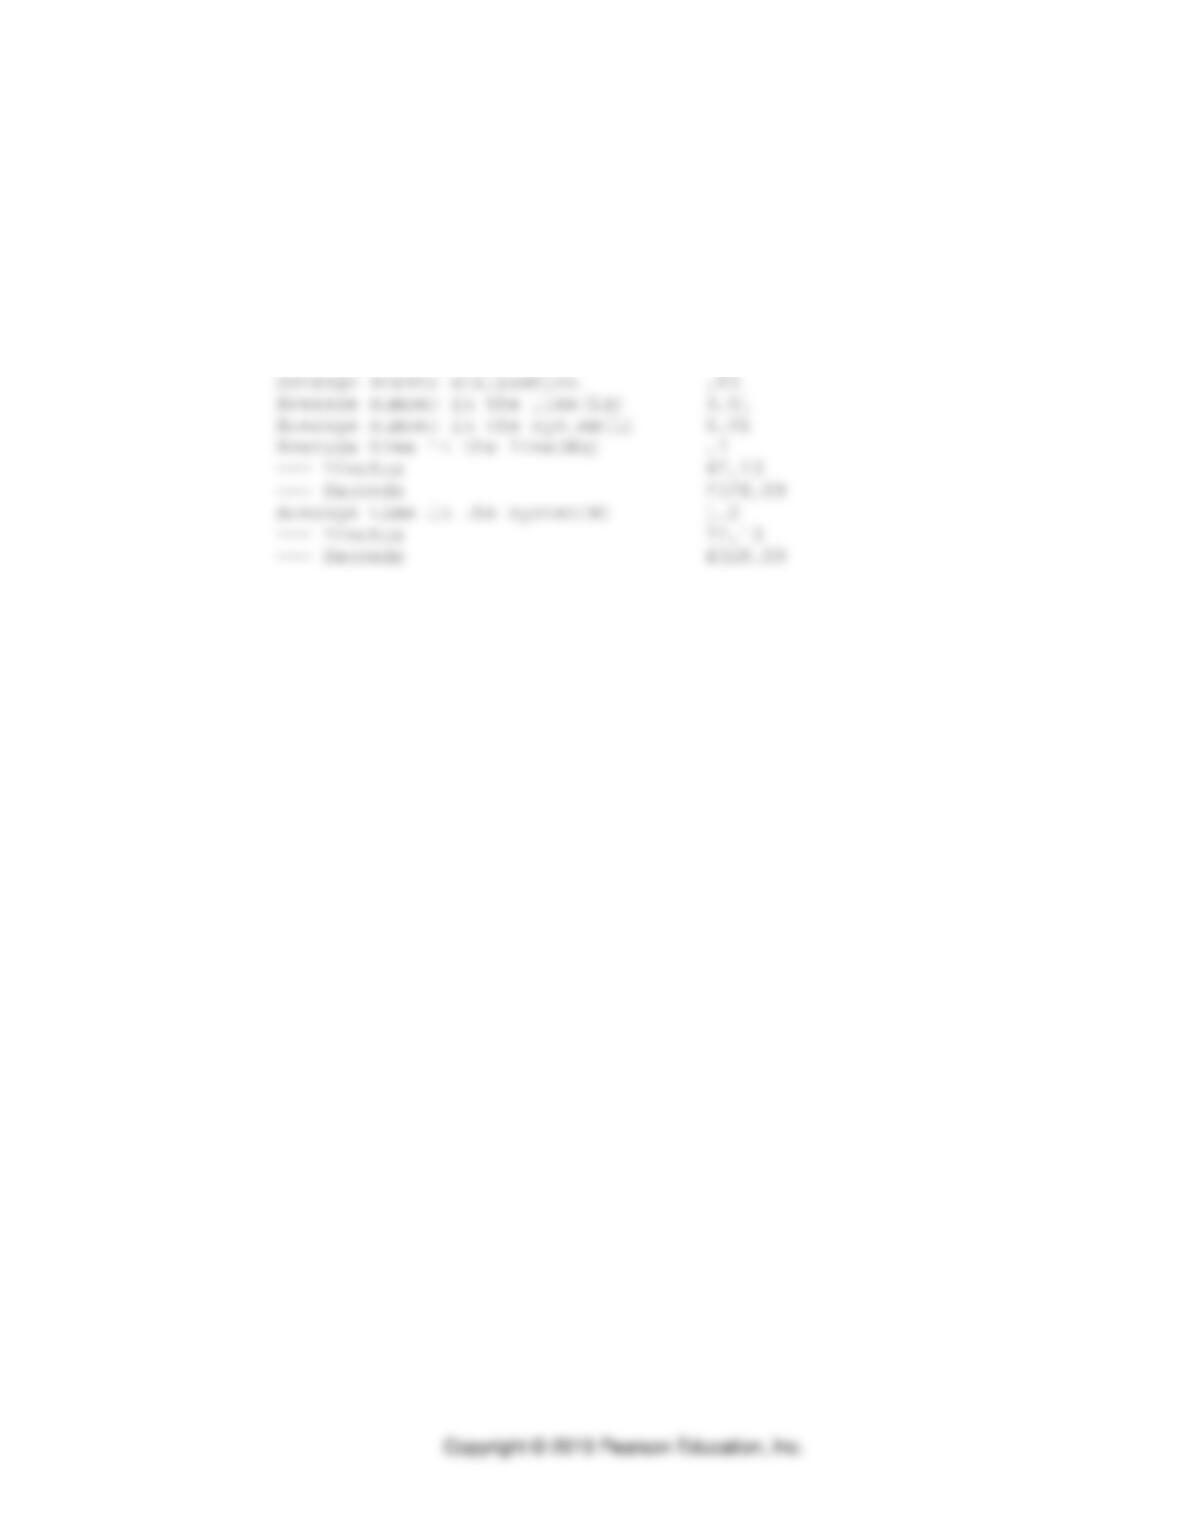
Average server utilization .63
Average number in the line(Lq) .53
Average number in the system(L) 3.03
Operating characteristics when 5 chairs are staffed
Parameter Value
—————————————-
Arrival rate(lambda) 5
Service rate(mu) 2
Number of servers 5
Result Value
———————————————
Average server utilization .5
Average number in the line(Lq) .13
Average number in the system(L) 2.63
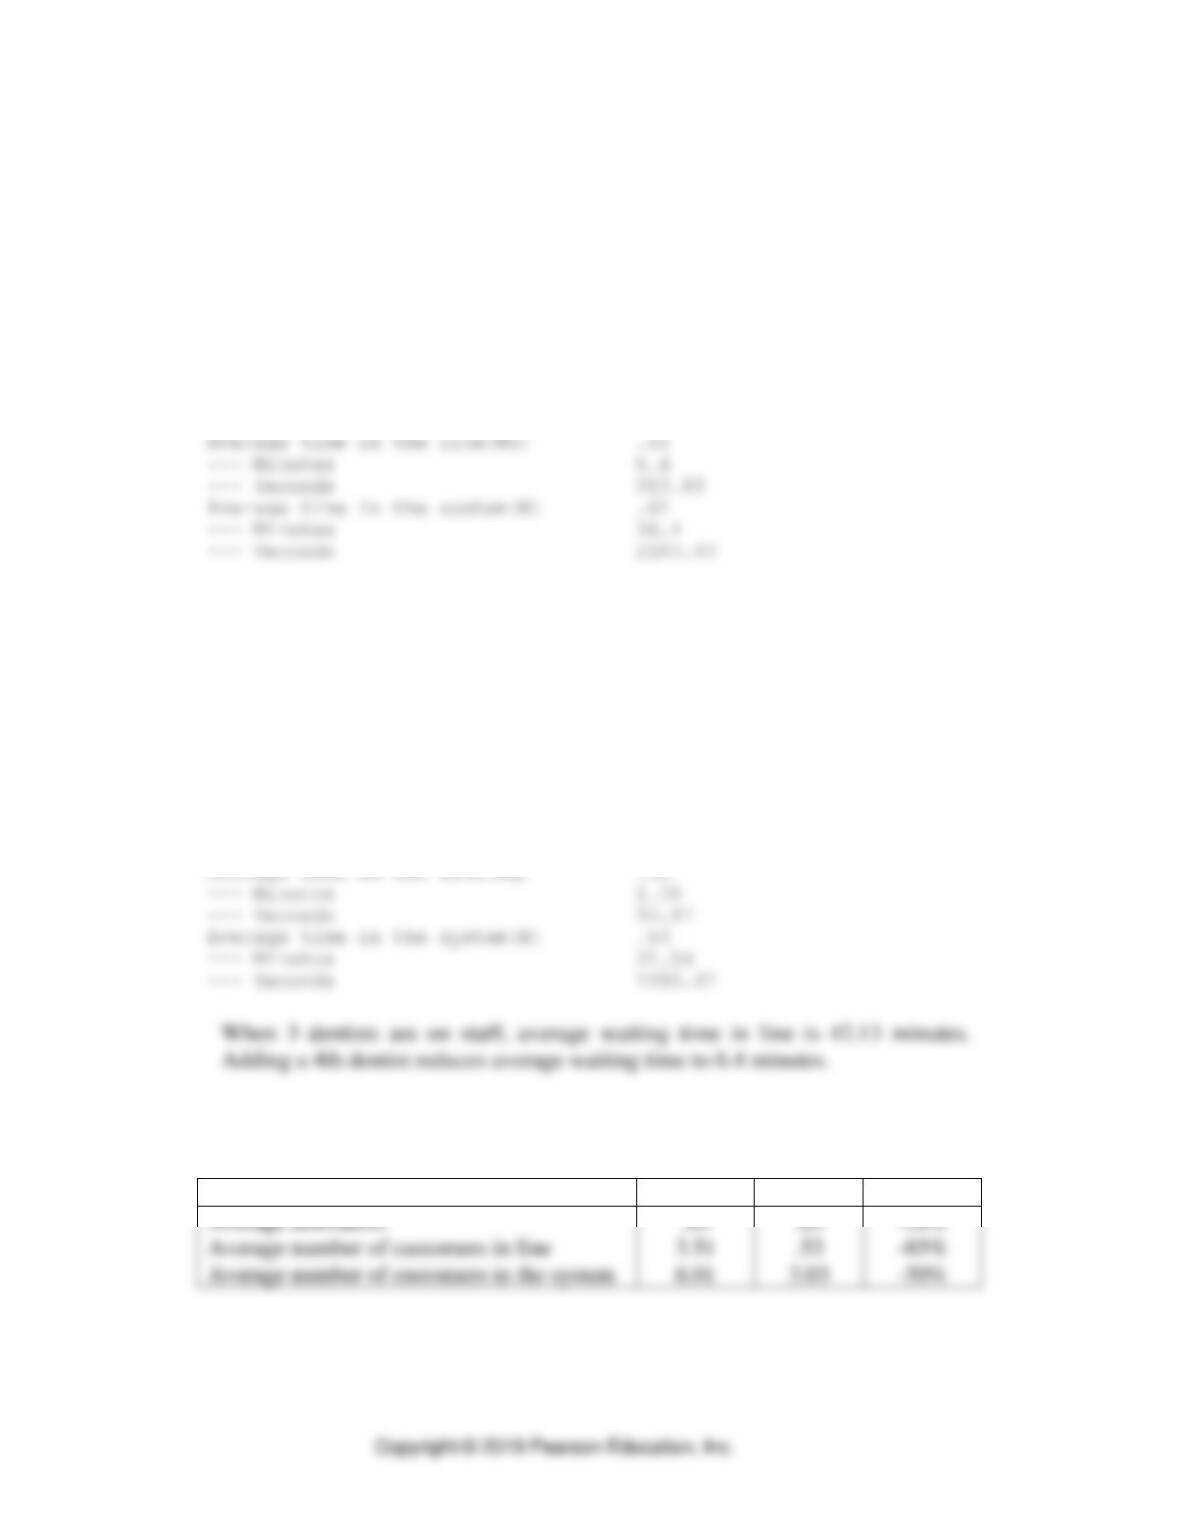
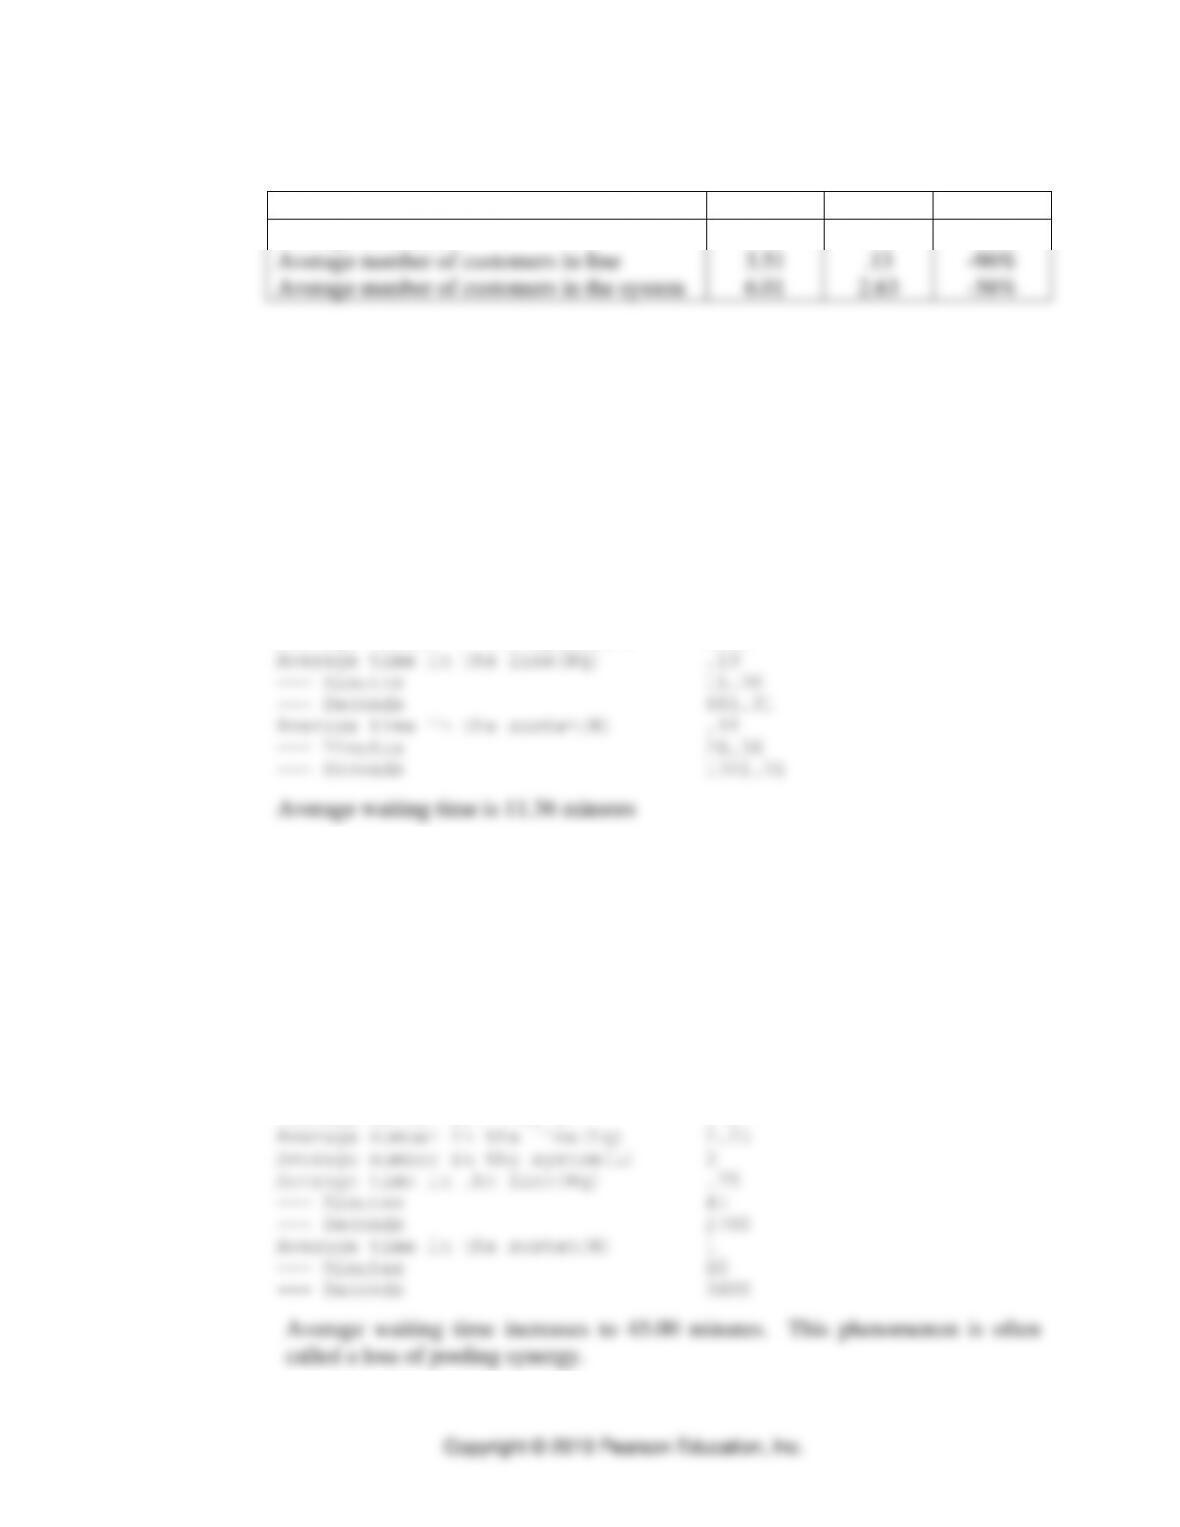
b. The changes in operating characteristics when 3 or 4 dentists are on staff are
summarized in the table below:
3 dentists
4 dentists
% change
Average utilization
Average number of customers in line
Average number of customers in the system
.83
3.51
6.01
.63
.53
3.03
-24%
-85%
-50%
Waiting Lines ⚫ SUPPLEMENT B ⚫ B-5
c. The changes in operating characteristics when 3 or 5 dentists are on staff are
summarized in the table below:
3 dentists
5 dentists
% change
Average utilization
Average number of customers in line
Average number of customers in the system
.83
3.51
6.01
.50
.13
2.63
-40%
-96%
-56%
6. Fantastic Styling Salon. This problem is solved with the help of the Waiting Line
Analysis module in POM for Windows
a. Operating characteristics with 3 stylists and one line
Parameter Value
—————————————-
Arrival rate(lambda) 9
Service rate(mu) 4
Number of servers 3
Result Value
———————————————
Average server utilization .75
Average number in the line(Lq) 1.7
Average number in the system(L) 3.95
b. Operating characteristics with 3 stylists and individual lines. The following
results are the characteristics of one of the three waiting lines. The arrival rate for
each stylist is 1/3 the rate of the salon.
Parameter Value
—————————————-
Arrival rate(lambda) 3
Service rate(mu) 4
Number of servers 1
Result Value
———————————————
Average server utilization .75
B-6 ⚫ PART 1 ⚫ Managing Processes
c. Operating characteristics with 2 stylists and one line.
Parameter Value
—————————————-
Arrival rate(lambda) 6
Service rate(mu) 4
Number of servers 2
Result Value
———————————————
Average server utilization .75
Average number in the line(Lq) 1.93
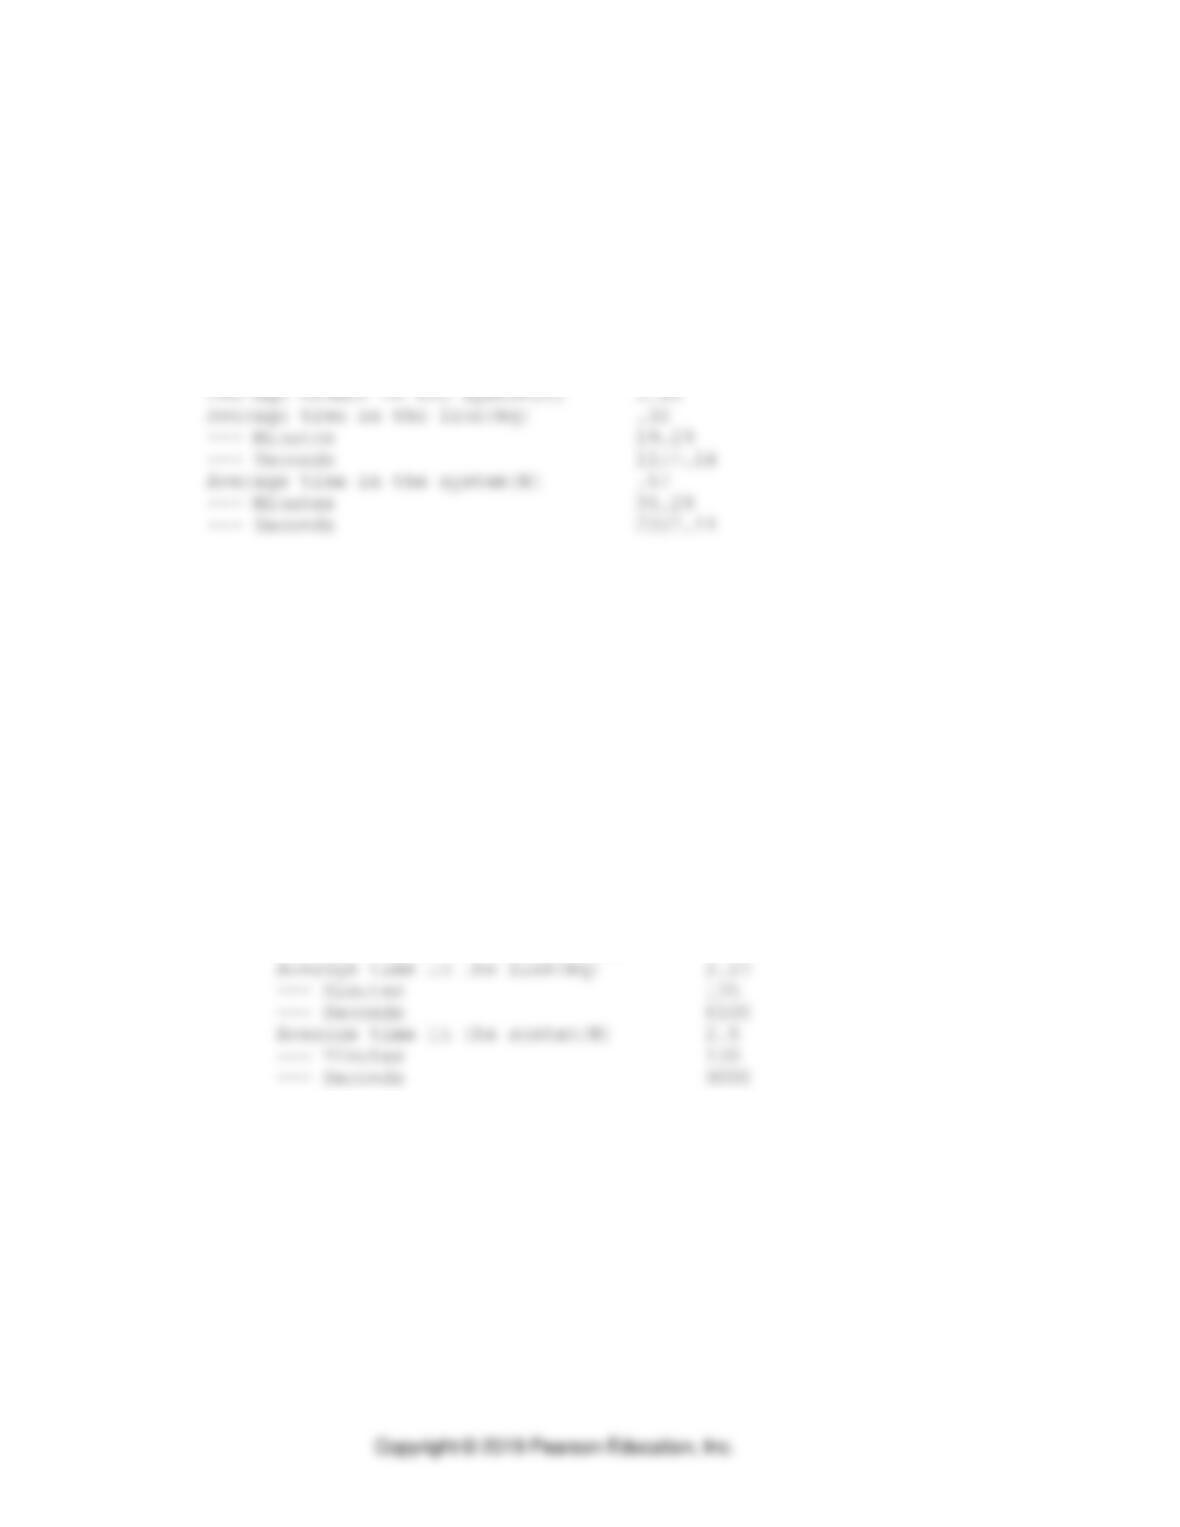
Average waiting time is 19.29 minutes (note the longer waiting time compared to
part a. even though utilization is unchanged)
d. Operating characteristics with 2 stylists and one line:
Characteristics of Perez’s line:
Parameter Value
—————————————-
Arrival rate(lambda) 3.6
Service rate(mu) 4
Number of servers 1
Result Value
———————————————
Average server utilization .9
Average number in the line(Lq) 8.1
Average number in the system(L) 9
Waiting Lines ⚫ SUPPLEMENT B ⚫ B-7
Characteristics of Sloan’s line:
Parameter Value
—————————————-
Arrival rate(lambda) 2.4
Service rate(mu) 4
Number of servers 1
Result Value
———————————————
Average server utilization .6
Average number in the line(Lq) .9
Average number in the system(L) 1.5
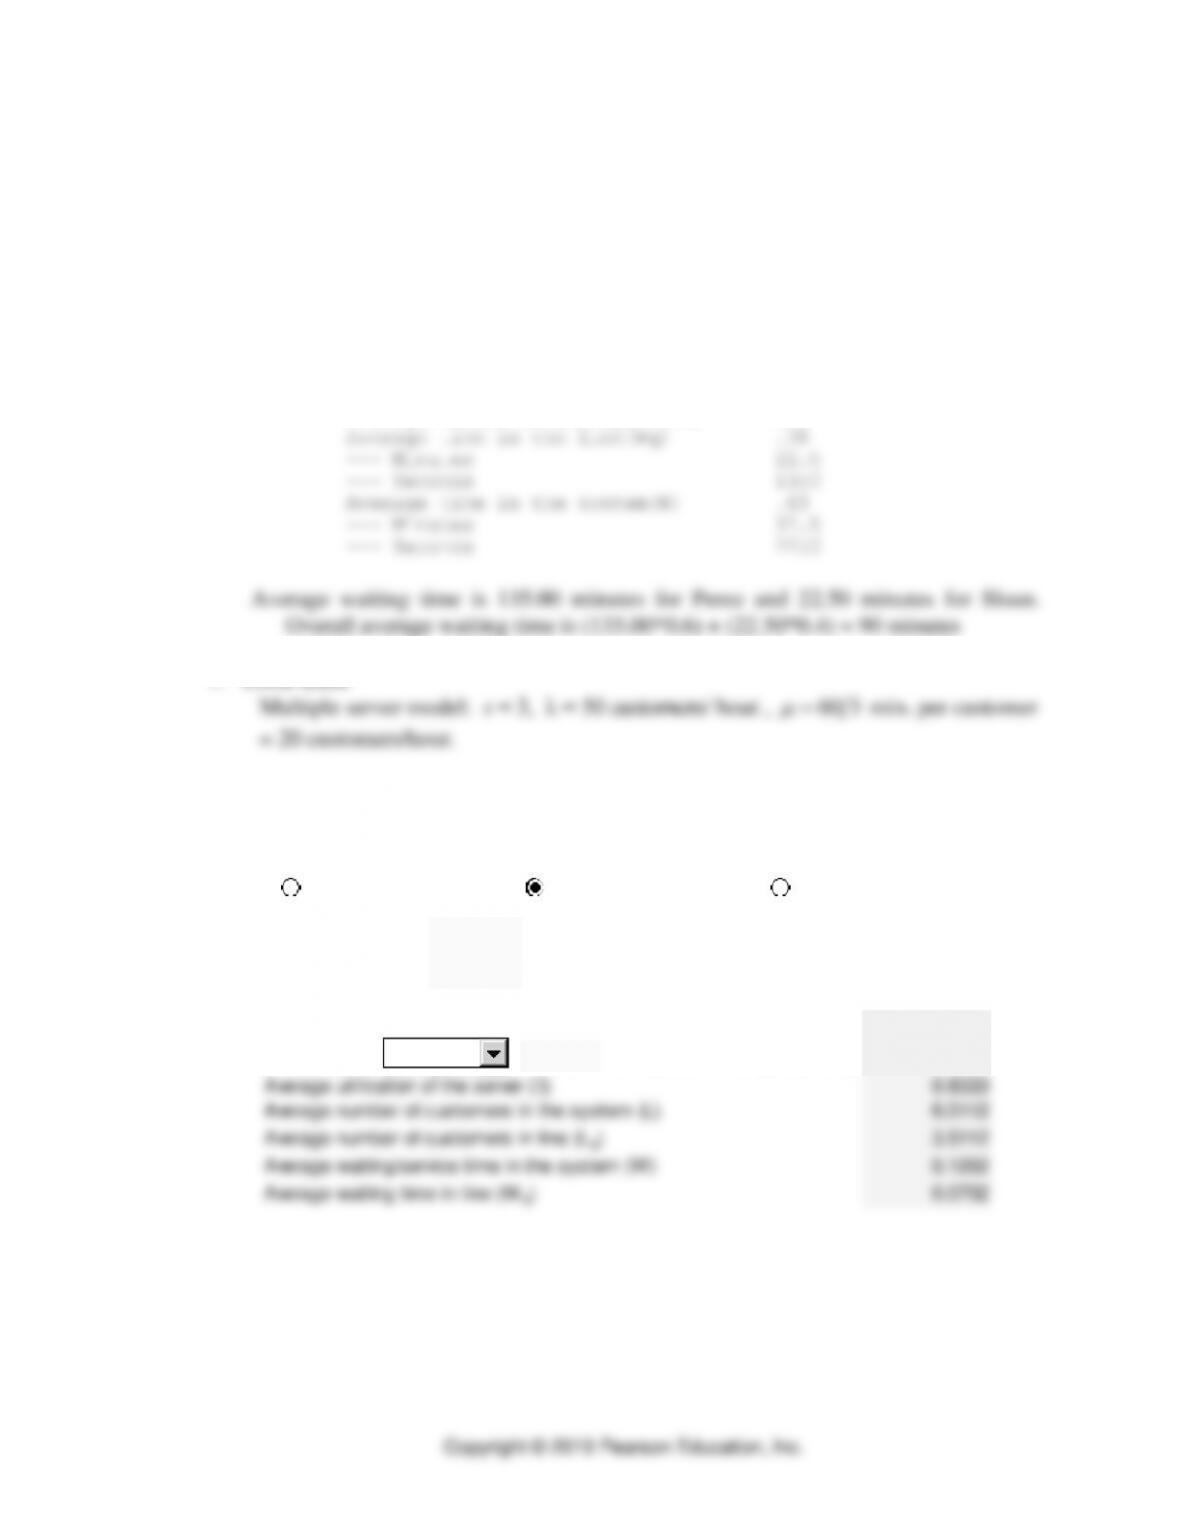
7. Local Bank
Solver – Waiting Lines
Enter data in yellow shaded areas.
Servers 3
Arrival Rate ()50
Service Rate ()20
Probability of zero customers in the system (P0) 0.0449
Probability of 1
customers in the system (Pn) 0.9551
Average utilization of the server () 0.8333
Average number of customers in the system (L) 6.0112
Average number of customers in line (Lq) 3.5112
Average waiting/service time in the system (W) 0.1202
Average waiting time in line (Wq) 0.0702
Single-server model
Multiple-server model
Finite-source model
at least
B-8 ⚫ PART 1 ⚫ Managing Processes
a. Average utilization:
= 0.8333
b. Probability of no customers in the bank:
0
P
= 0.0449
8. Pasquist Water Company
a. Behavior of waiting trucks
1. Will not balk
2. Will wait until served
3. Will arrive according to a Poisson process
b. What is the probability that exactly 10 trucks will arrive between 1:00 p.m. and
2:00 p.m. next Tuesday?
%628.606628.
!10
)1(14 )1(14
10
10 oreP == −
How likely is it that once a truck is in position at the wellhead, the filling
time will be less than 15 minutes?
( )
4(0.25)
1 1 .36788 0.63212 63.212%P t T e or
−
= − = − =
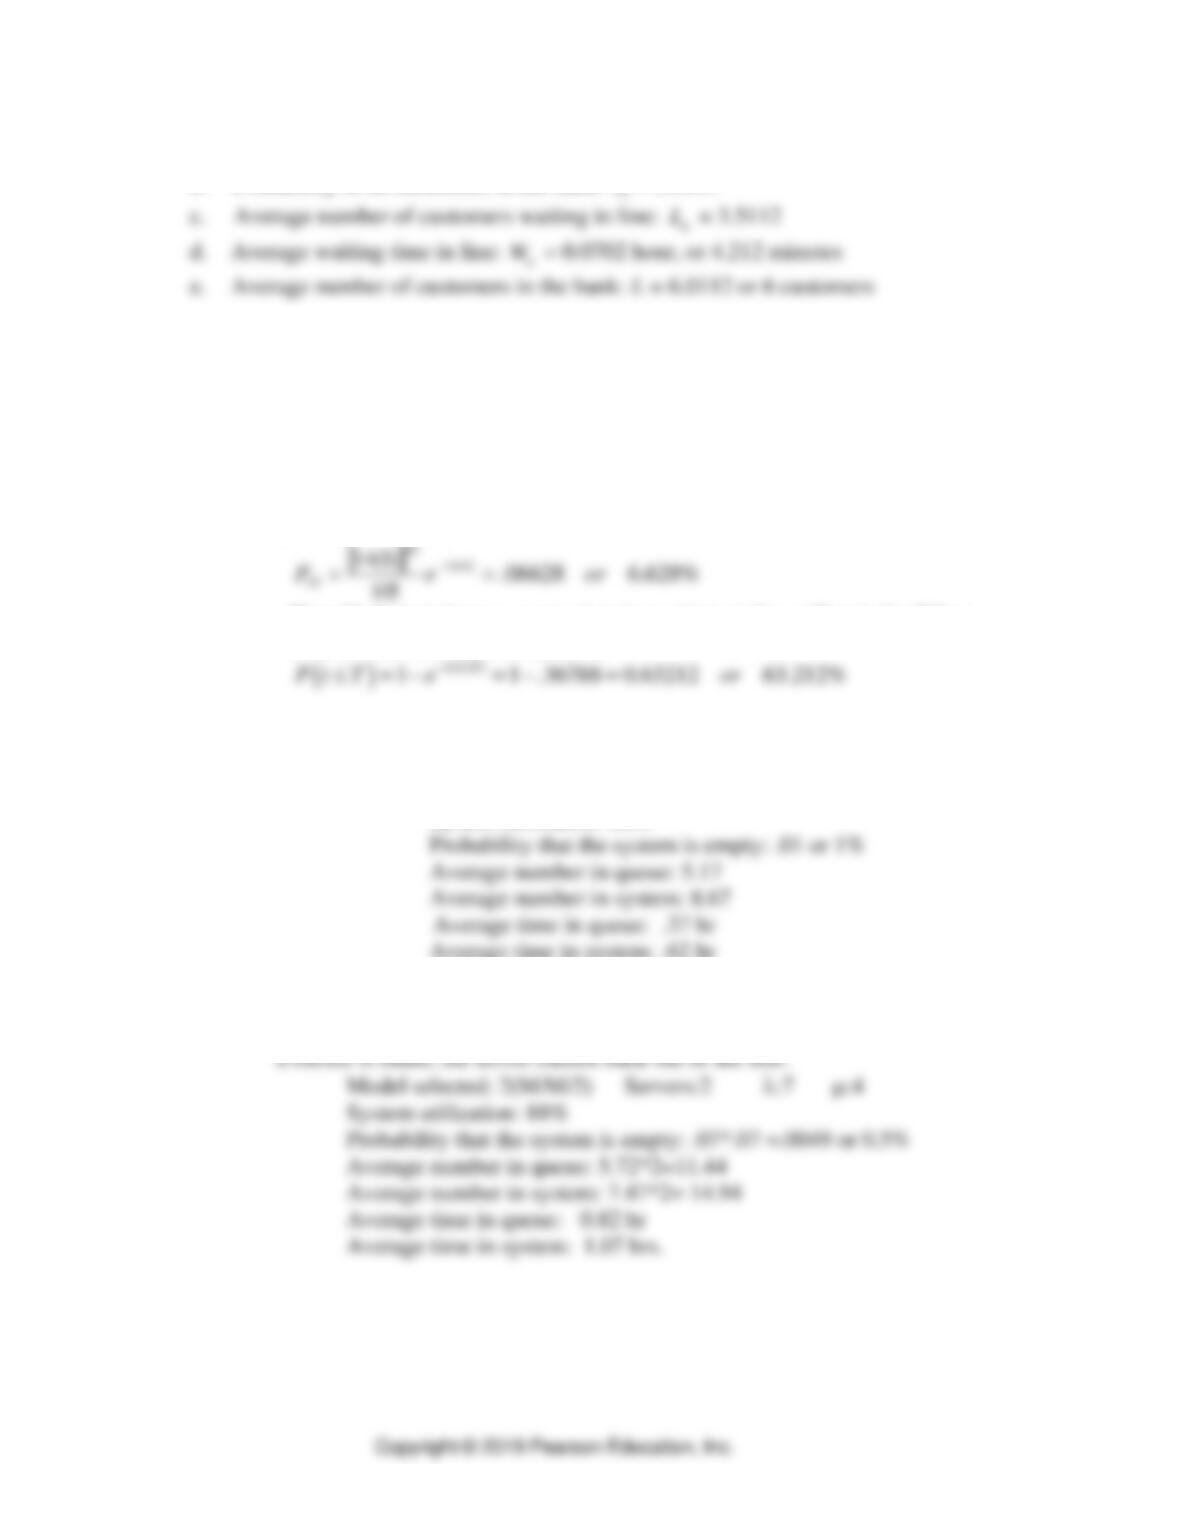
c. Suppose that PWC has only four wellhead pumps.
One waiting line feeding all four stations.
Model selected: M/M/4 Servers: 4 : 14 : 4
System utilization: 88%
Average time in system: .62 hr
One waiting line feeding two wellhead pumps and a second waiting line
feeding two other wellhead pumps. Assume that drivers cannot see each
line and must choose randomly between them. Further, assume that once
Waiting Lines ⚫ SUPPLEMENT B ⚫ B-9
9. Precision Machine Shop. Single-server model.
With the junior attendant, the average number of idle machinists, L
84
10 8
L
= = =
−−
Average hourly idle machinist cost = $20(L) = $20(4) = $80
With the senior attendant, average number of idle machinists, L
81
16 8
= = =
−−
L
Average hourly cost of idle machinists drops to $20(L) = $20(l) = $20
choice is the senior attendant.
10. Hasty Burgers. Single-server model,
20
=
a. Find
resulting in L = 4.
20
420
4 80 20
4 100
25
=−
=−
−=
=
=
L
The required service rate is 25 customers per hour.
b. Find the probability that more than four customers are in the system. This
is one minus the probability of four or fewer customers in the system.
First, we calculate average utilization of the drive-in window.
20 0.8
25
= = =
The probability that more than four customers are in line and being served
0.3277
=
P
B-10 ⚫ PART 1 ⚫ Managing Processes
Consequently, there is about a 33 percent chance of more than four customers in
the system.
c. Find the average time in line.
1
1
0.8 25 20
q
WW
==
−
=
−
0.16
q
W=
hour or 9.6 minutes
Ten minutes borders on being unbearable, particularly in the atmosphere of
exhaust fumes. Keep in mind that this is an average, and some people must wait
longer.
11. Banco Mexicali. Little’s Law.
= 20 customers/hour
12. Paula Caplin. Little’s Law.
a. = 120 jobs/day
b. L must be reduced to 240 jobs. Therefore, either the average number of repairs, λ,
or the time in the system, W, must be cut in half (or some combination). Paula has
13. Failsafe Textiles. Multiple-server model. This problem is solved with the help of the
Waiting Line Analysis module in POM for Windows.
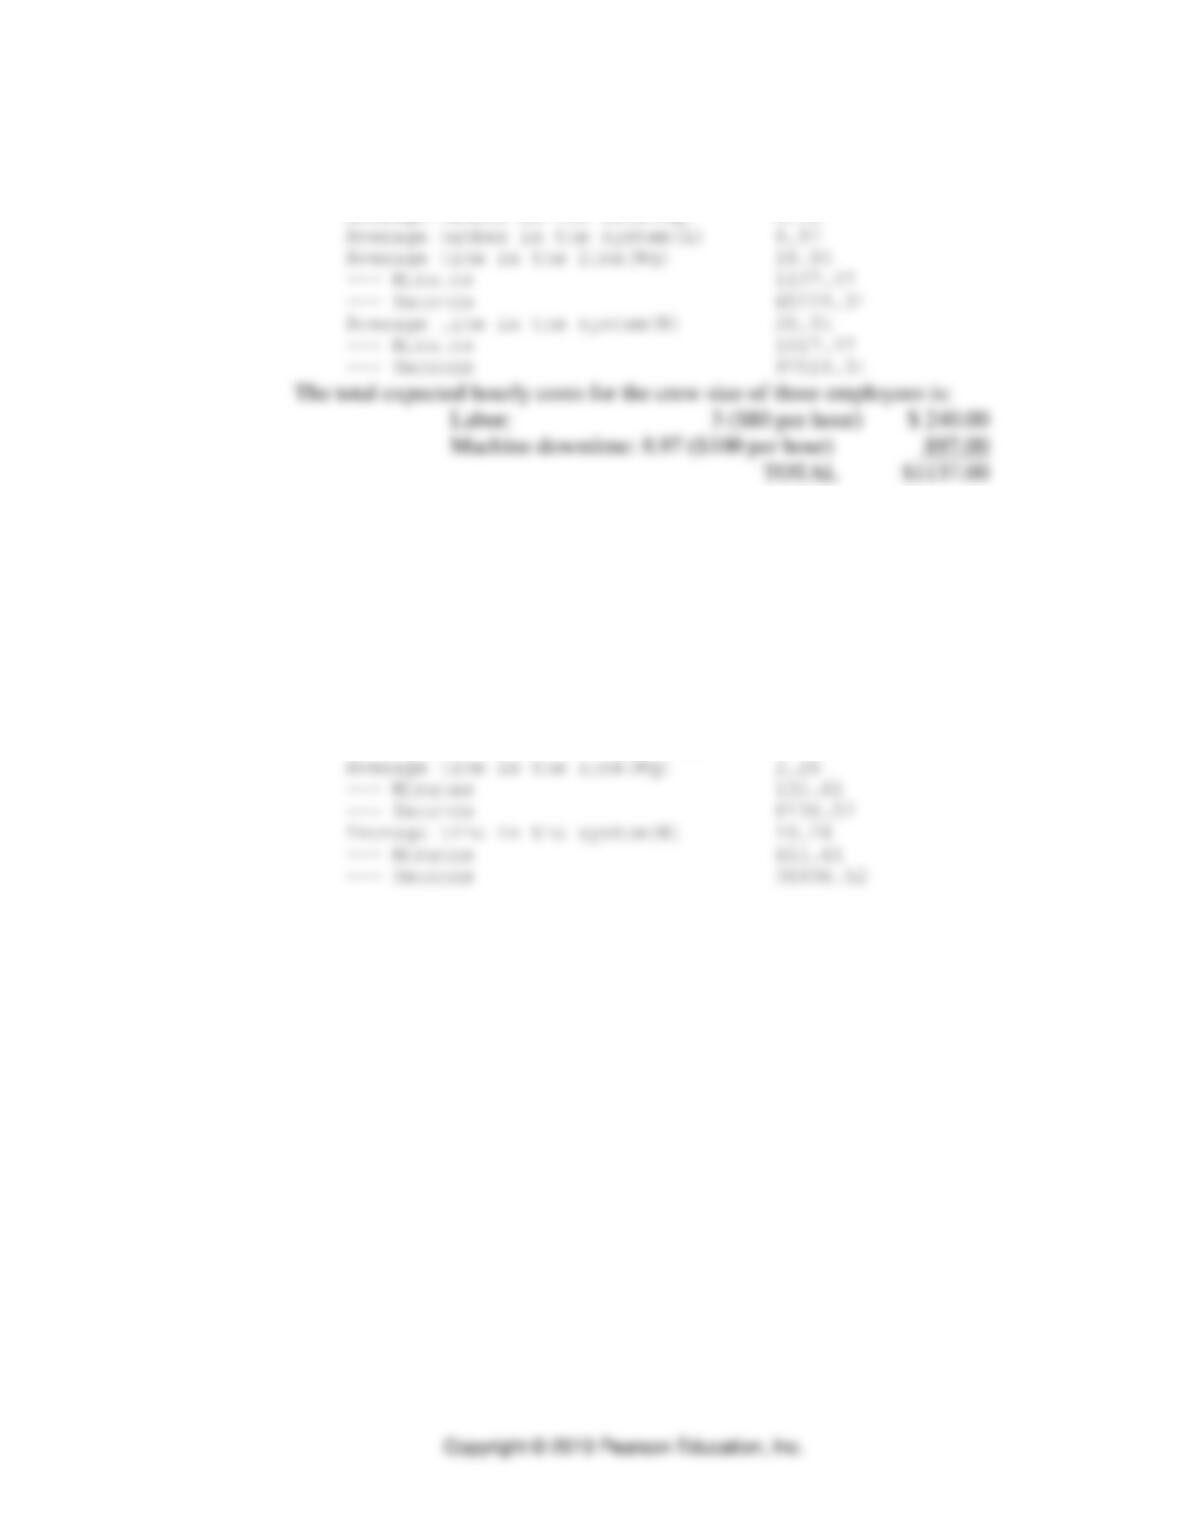
In this analysis we determine the expected total labor and machine failure costs for
Three maintenance people:
Parameter Value
—————————————-
Arrival rate(lambda) .33
Service rate(mu) .13
Number of servers 3
Waiting Lines ⚫ SUPPLEMENT B ⚫ B-11
Result Value
———————————————
Average server utilization .89
Average number in the line(Lq) 6.31
Four maintenance people:
Parameter Value
—————————————-
Arrival rate(lambda) .33
Service rate(mu) .13
Number of servers 4
Result Value
———————————————
Average server utilization .67
Average number in the line(Lq) .75
Average number in the system(L) 3.42
B-12 ⚫ PART 1 ⚫ Managing Processes
The total expected hourly costs for the crew size of four employees is:
Labor: 4 ($80 per hour) $ 320.00
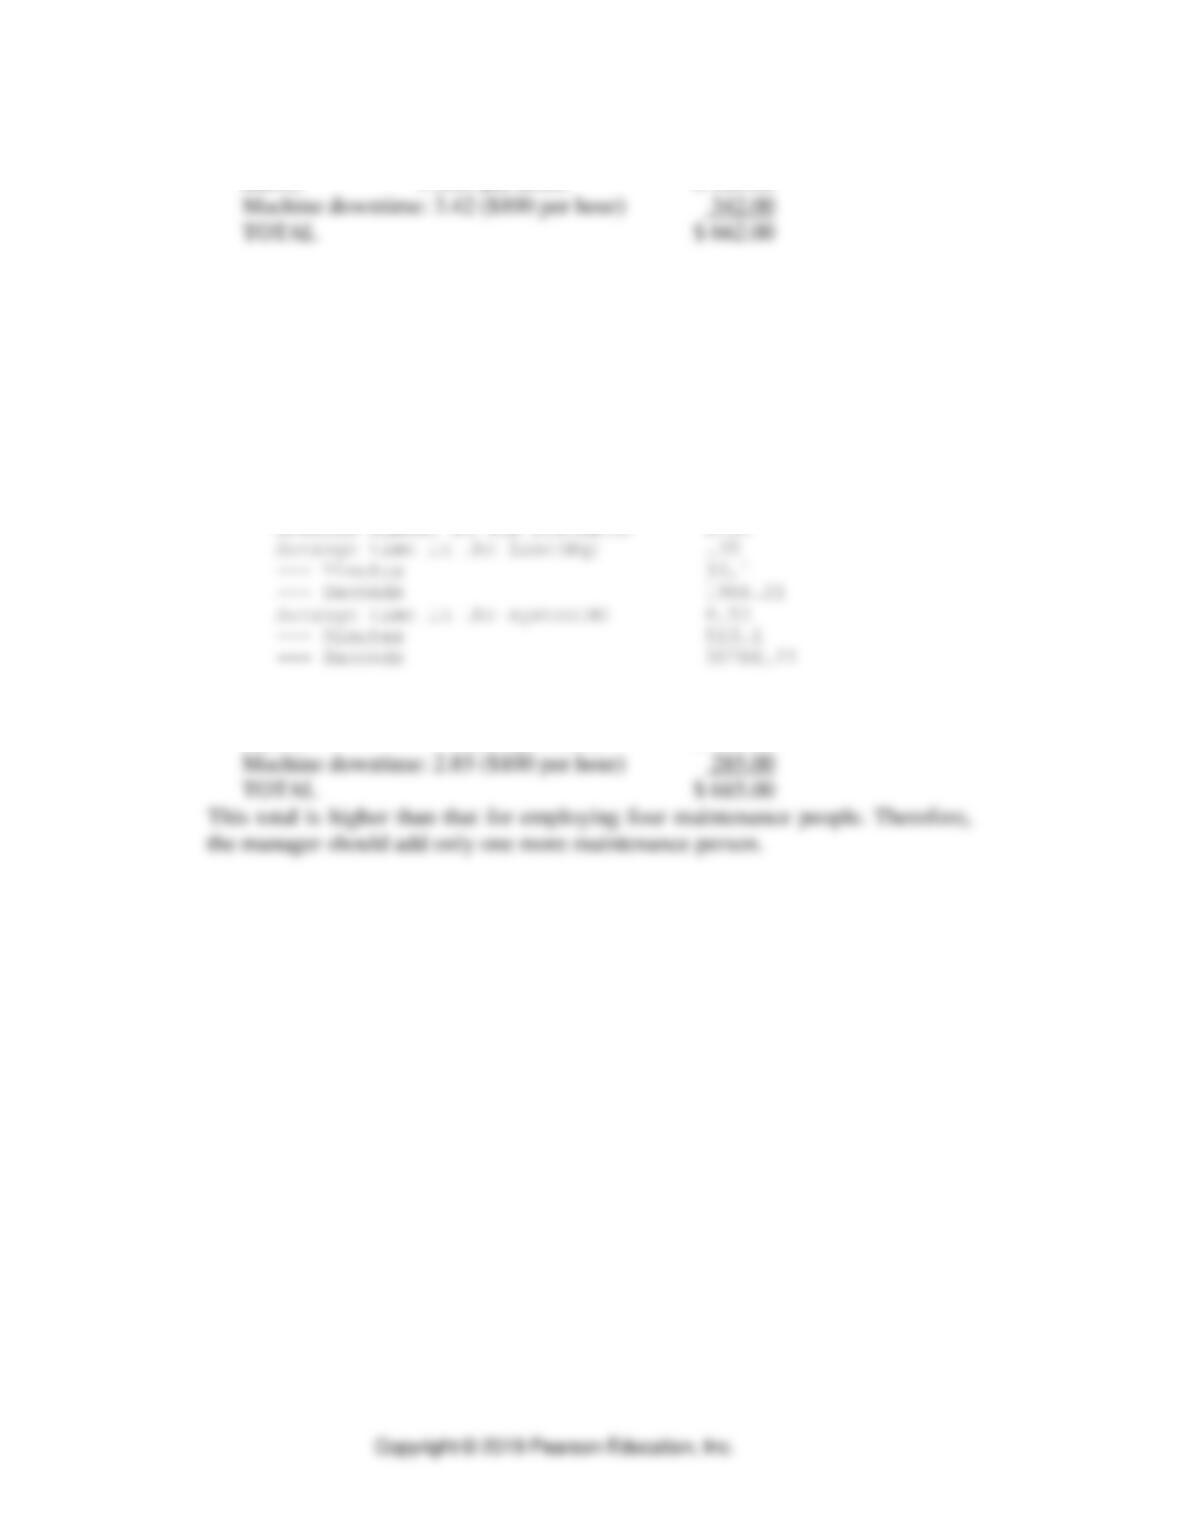
Five maintenance people:
Parameter Value
—————————————-
Arrival rate(lambda) .33
Service rate(mu) .13
Number of servers 5
Result Value
———————————————
Average server utilization .53
Average number in the line(Lq) .18
Average number in the system(L) 2.85
The total expected hourly costs for the crew size of five employees is:
Labor: 5 ($80 per hour) $ 400.00
Waiting Lines ⚫ SUPPLEMENT B ⚫ B-13
14. Benton University
Finite Source Model: λ = 0.40 copy machines/day, µ = 2.5 machines/day
Solver – Waiting Lines
Enter data in yellow shaded areas.
Customers 5
Arrival Rate () 0.4
Service Rate () 2.5
Probability of zero customers in the system (P0) 0.3775
Probability of 1
customers in the system (Pn) #N/A
Average utilization of the server () 0.6225
Average number of customers in the system (L) 1.1094
Average number of customers in line (Lq) 0.4869
Average waiting/service time in the system (W) 0.7129
Average waiting time in line (Wq) 0.3129
Single-server model
Multiple-server model
Finite-source model
at least
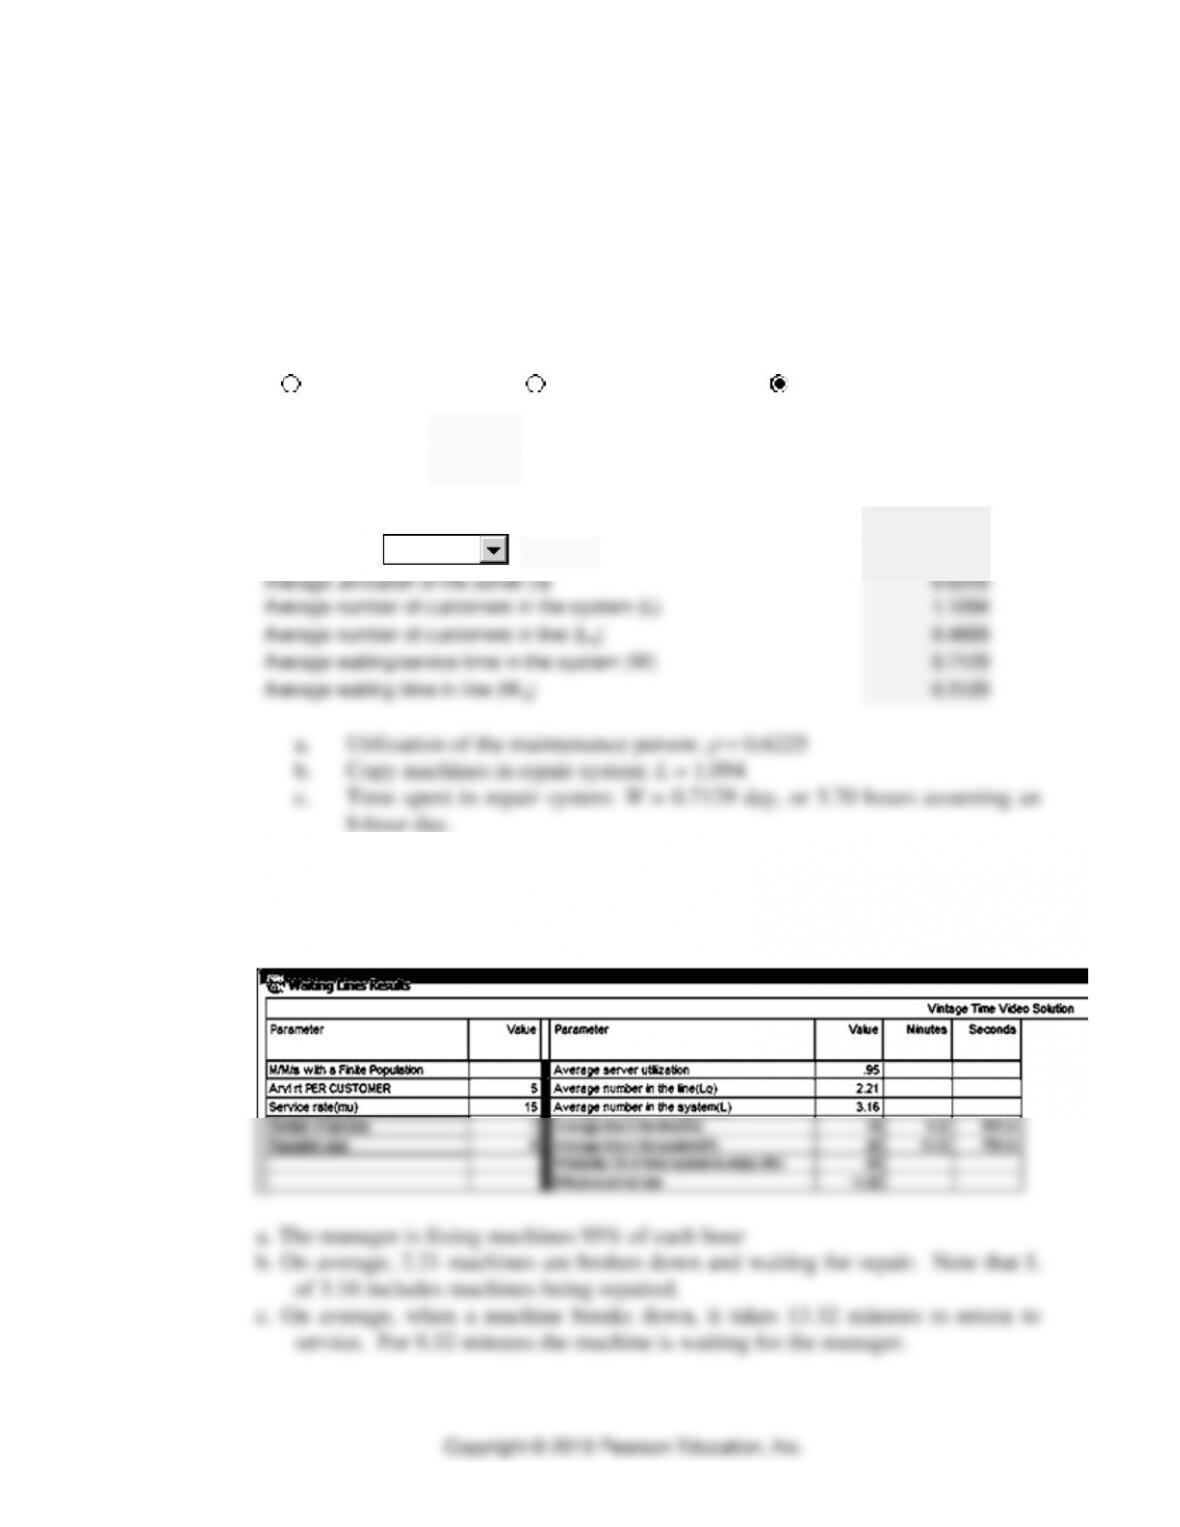
15. Vintage Time Video Machine Parlor
The M/M/s with a Finite Population Model is required to answer this problem.
The POM for Windows software, as seen below, provides the solution.
B-14 ⚫ PART 1 ⚫ Managing Processes
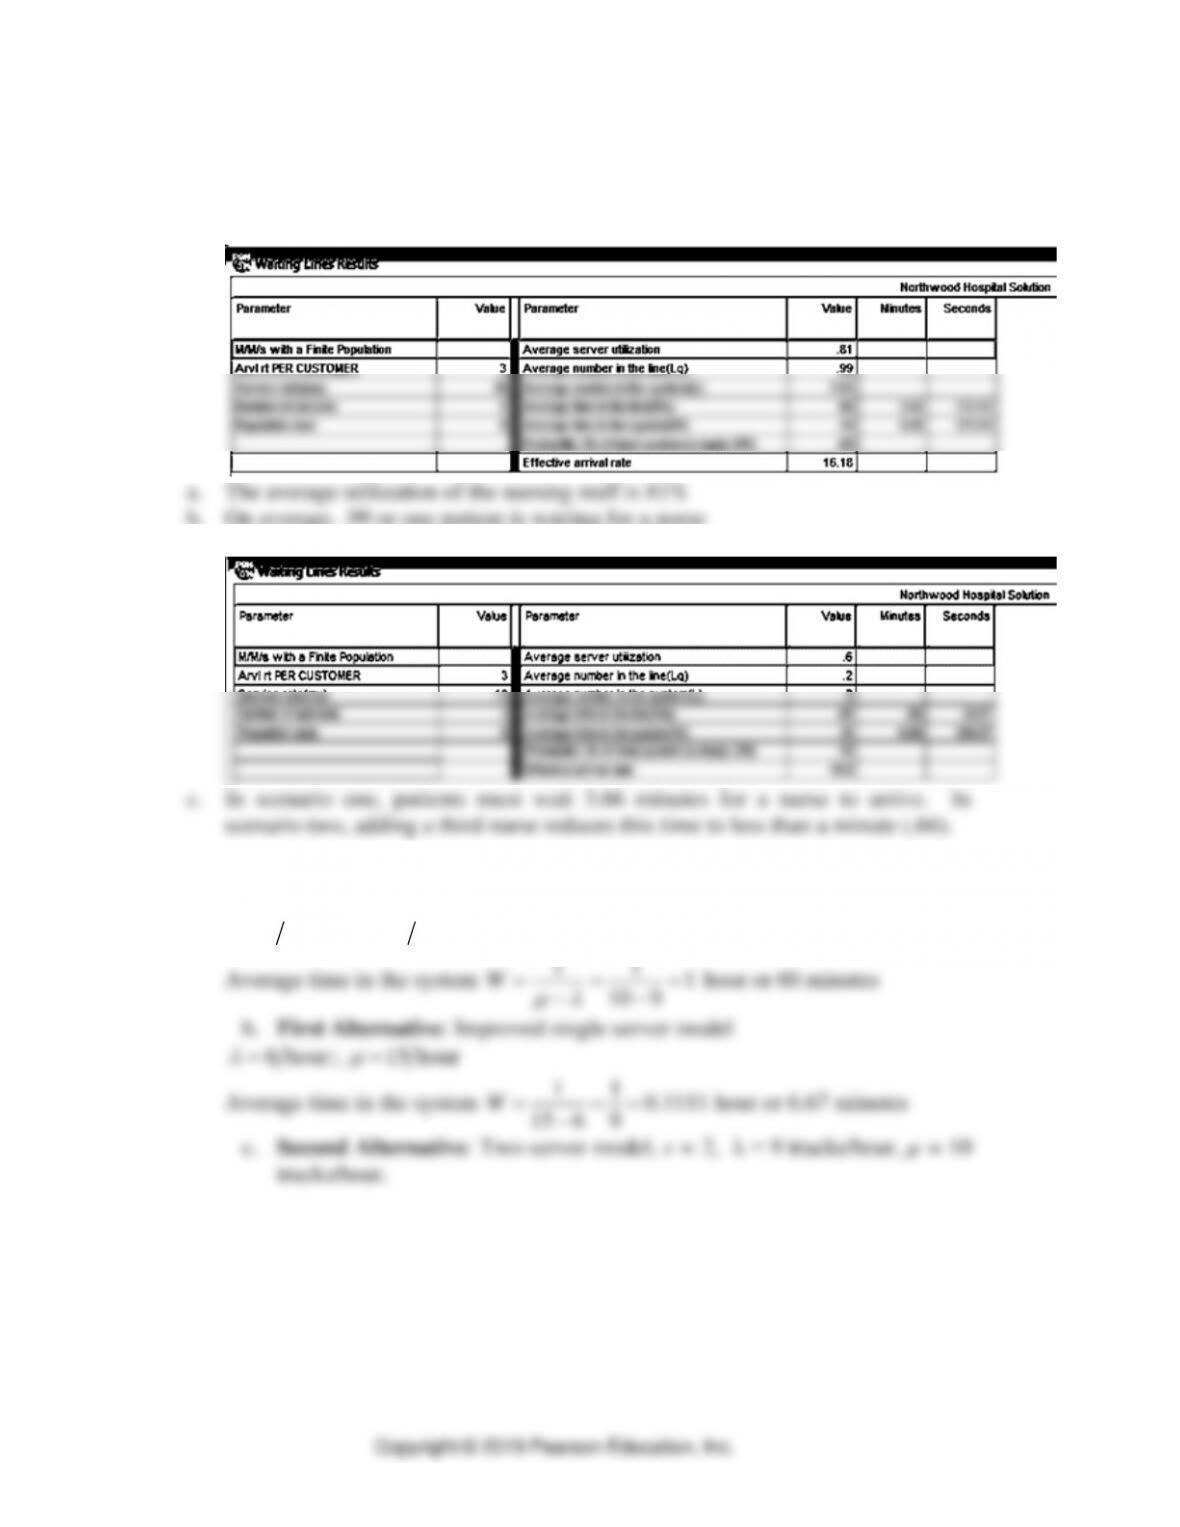
16. Northwood Hospital’s Cardiac Care Unit
The M/M/s with a Finite Population Model is required to answer this problem.
The POM for Windows software, as seen below, provides the solution.
b. On average, .99 or one patient is waiting for a nurse
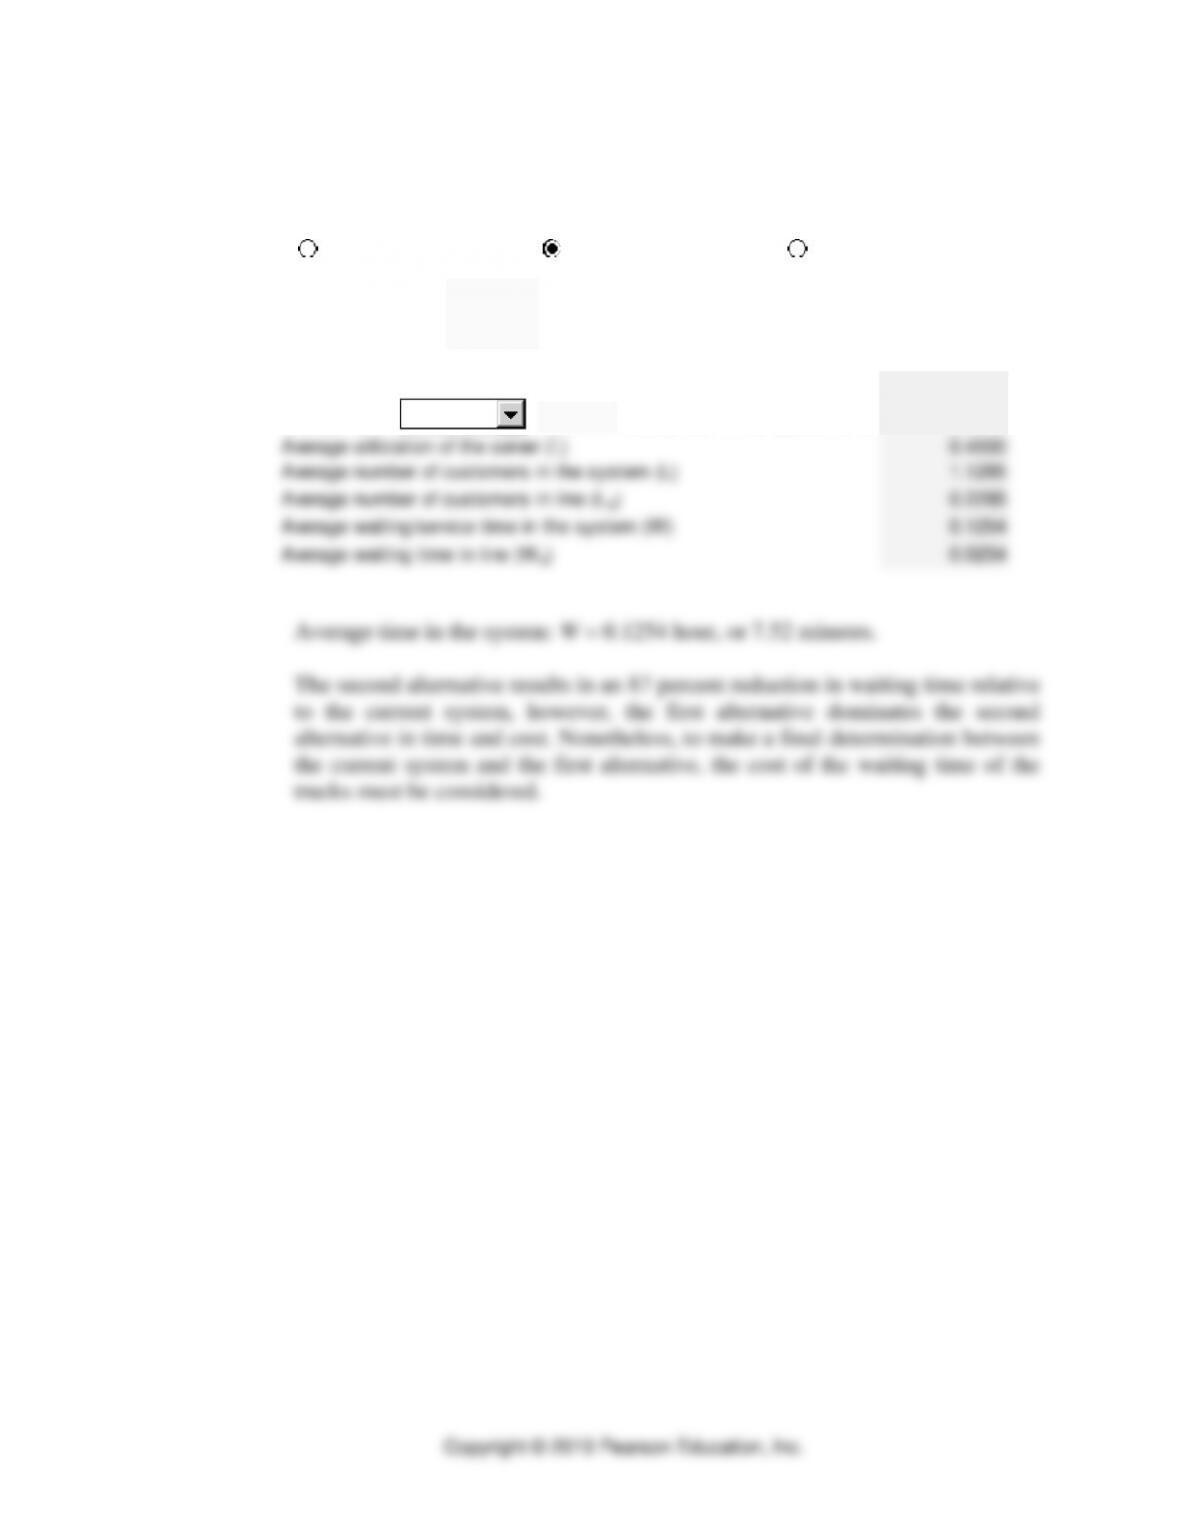
17. Quarry
a. Current System: Single-server model
9 hour
=
;
10 hour
=
11
Waiting Lines ⚫ SUPPLEMENT B ⚫ B-15
Solver – Waiting Lines
Enter data in yellow shaded areas.
Servers 2
Arrival Rate () 9
Service Rate ()10
Probability of zero customers in the system (P0) 0.3793
Probability of 1
customers in the system (Pn) 0.6207
Average utilization of the server () 0.4500
Average number of customers in the system (L) 1.1285
Average number of customers in line (Lq) 0.2285
Average waiting/service time in the system (W) 0.1254
Average waiting time in line (Wq) 0.0254
Single-server model
Multiple-server model
Finite-source model
at least