Supplement
A Decision Making
1. Break-even Analysis
1. Evaluating services or products
a. Assumptions and definitions
b. Break-even quantity: Algebraic approach
pQ = F + cQ
=−
F
Qpc
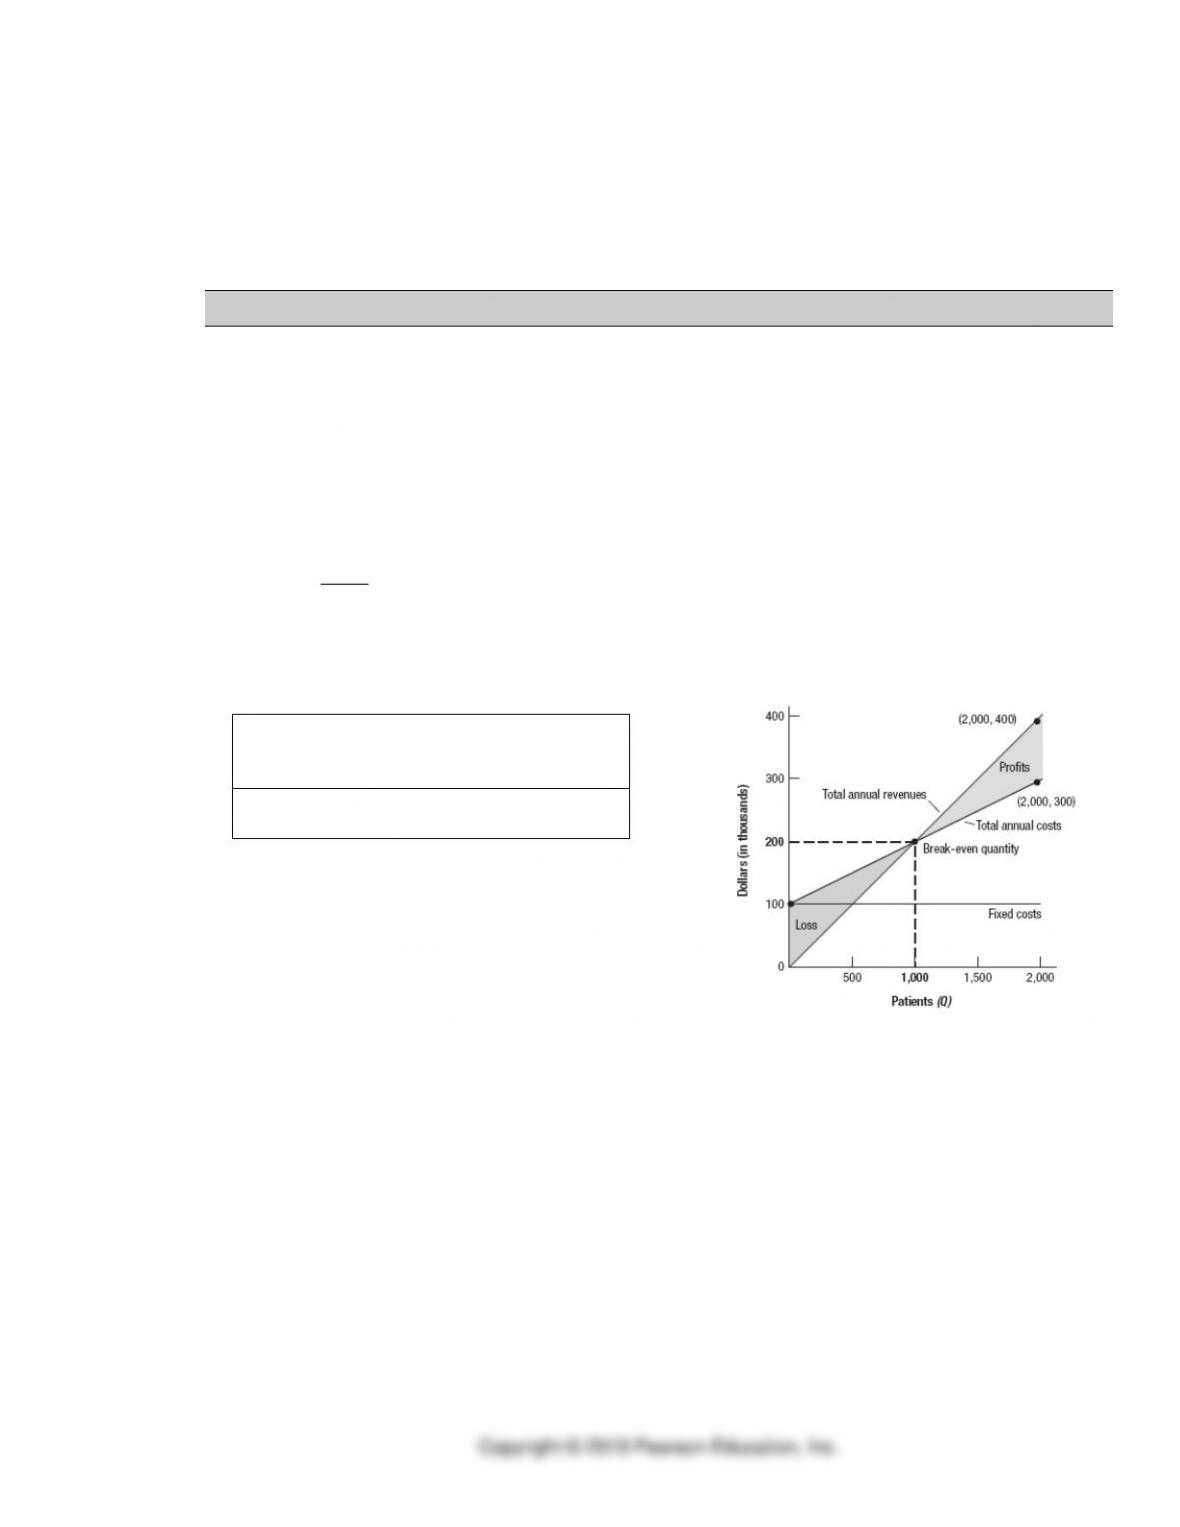
c. Break-even quantity: Graphic Approach with Example A.1
Quantity
(patients)
(Q)
Total Annual
Cost ($)
(100,000+100Q)
Total Annual
Revenue ($)
(200Q)
0
2000
d. Application A.1: Break-Even Analysis for Evaluating Products or Services
The Denver Zoo must decide whether to move twin polar bears to Sea World or build a special
exhibit for them and the zoo. The expected increase in attendance is 200,000 patrons. The data are:
Revenues per Patron for Exhibit
Gate receipts $4
Concessions $5
Licensed apparel $15
Estimated Fixed Costs
Exhibit construction $2,400,000
Salaries $220,000
Food $30,000
Estimated Variable Costs per Person
Concessions $2
Licensed apparel $9
Is the predicted increase in attendance sufficient to break even?
• Graphical solution of Denver Zoo problem
Q
TR = pQ
TC = F + cQ
0
250,000
Where
p =
F =
c =
• Algebraic solution of Denver Zoo problem
e. Sensitivity analysis with Example A.2
• If the most pessimistic sales forecast for the proposed service in Example A.1 were 1,500
patients, what would be the procedure’s total contribution to profit and overhead per year.
i.
f. Evaluating processes with Example A.3
• Assumptions and definitions: A Graphic Solution
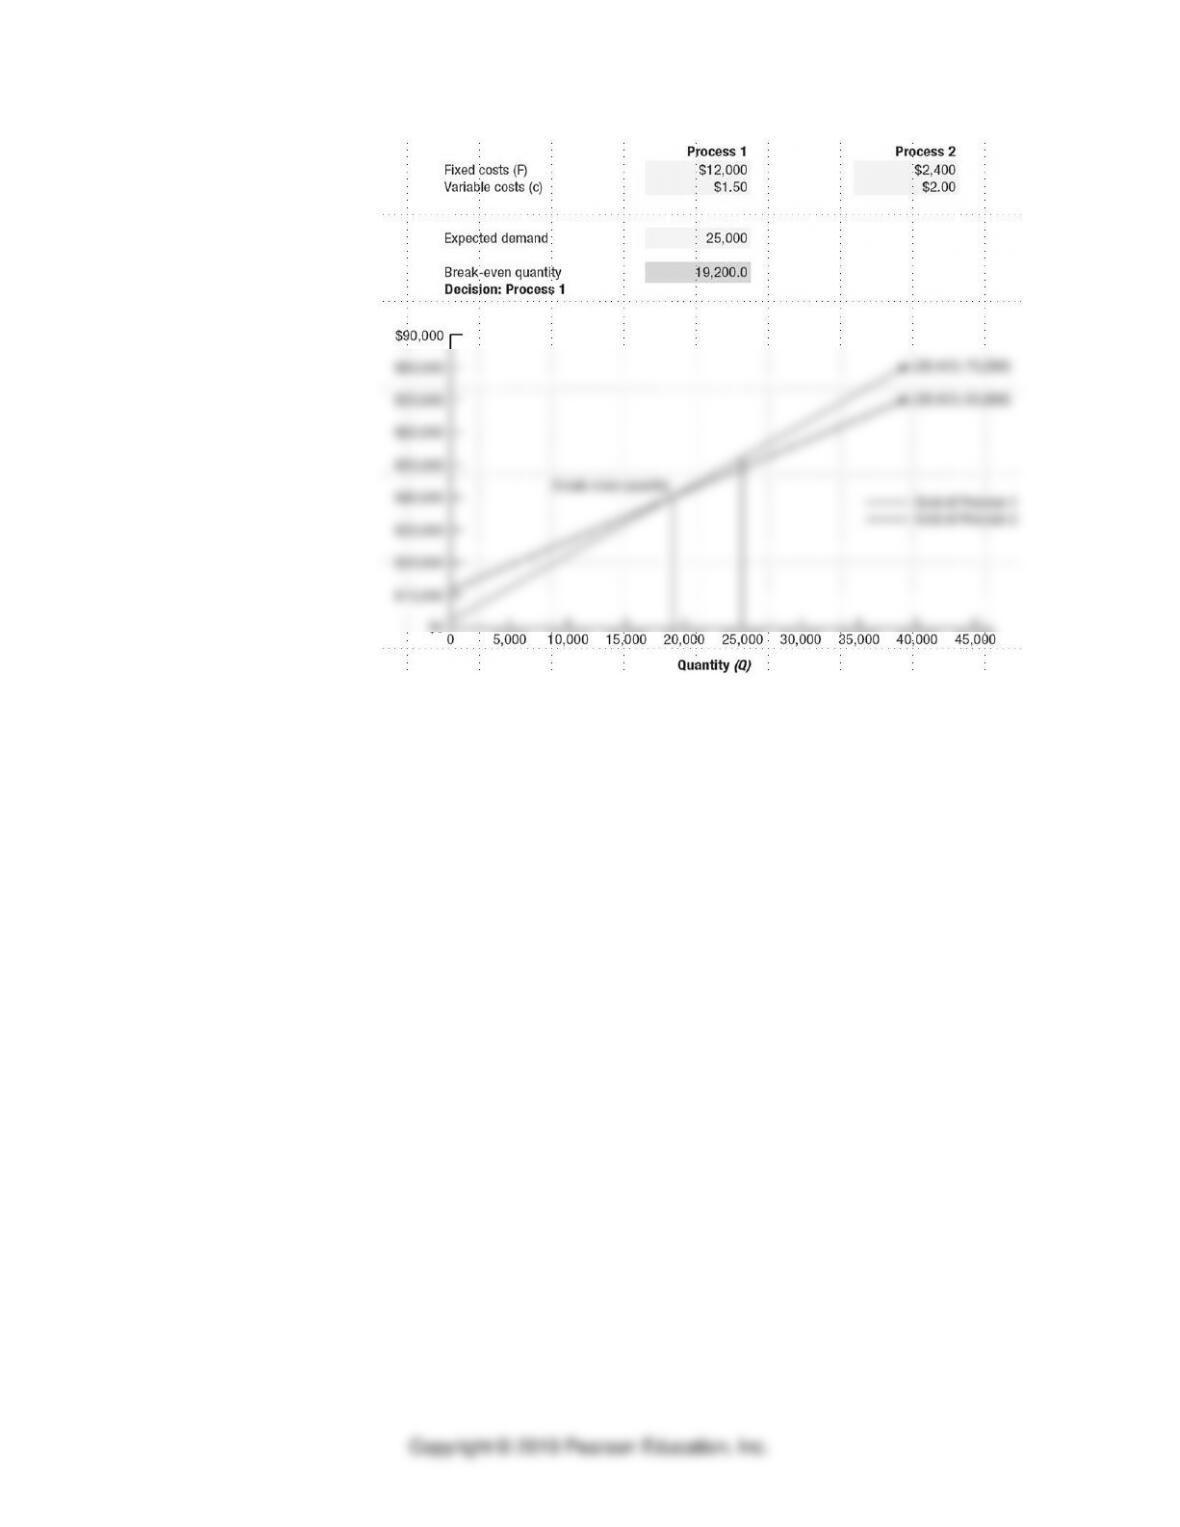
• Application A.2: Evaluating Processes: Make or Buy Example
At what volume should the Denver Zoo be indifferent between buying special sweatshirts from a
supplier or have zoo employees make them?
Buy
Make
Fixed costs
$0
$300,000
Variable costs
$9
$7
mb
bm
cc
FF
Q−
−
=
=
2. Preference Matrix
• The preference matrix is used where multiple criteria cannot be merged into a single measure such as
dollars.
• Approach:
• Use Example A.4: Evaluating an alternative with a Preference Matrix for a quick example of
evaluating a new product: a thermal storage air conditioner.
• Application A.3: Preference Matrix
Here we evaluate the advisability of adding a new service to our product line using the concept of a
weighted score.
Performance Criterion
Weight
Score
Weighted Score
Market potential
10
5
Unit profit margin
30
8
Operations compatibility
20
10
Competitive advantage
25
7
Investment requirements
10
3
Project risk
5
4
Total weighted score =
Repeat this process for each alternative — pick the one with the largest weighted score
• Possible criticism of preference matrix
3. Decision Theory
• Decision process
o Alternatives
o Events
o Payoff and payoff table
o Probabilities
o Decision rule
1. Decision making under certainty
a. Example A.5 Decisions Under Certainty
2. Decision making under uncertainty
a. Four decision rules
• Maximin –
• Maximax –
• Laplace –
• Minimax Regret –
b. Use Example A.6: Decisions Under Uncertainty to evaluate the best alternative for each
decision rule according to the payoff matrix in Example A.5:
• Maximin
• Maximax
• Laplace
• Minimax Regret
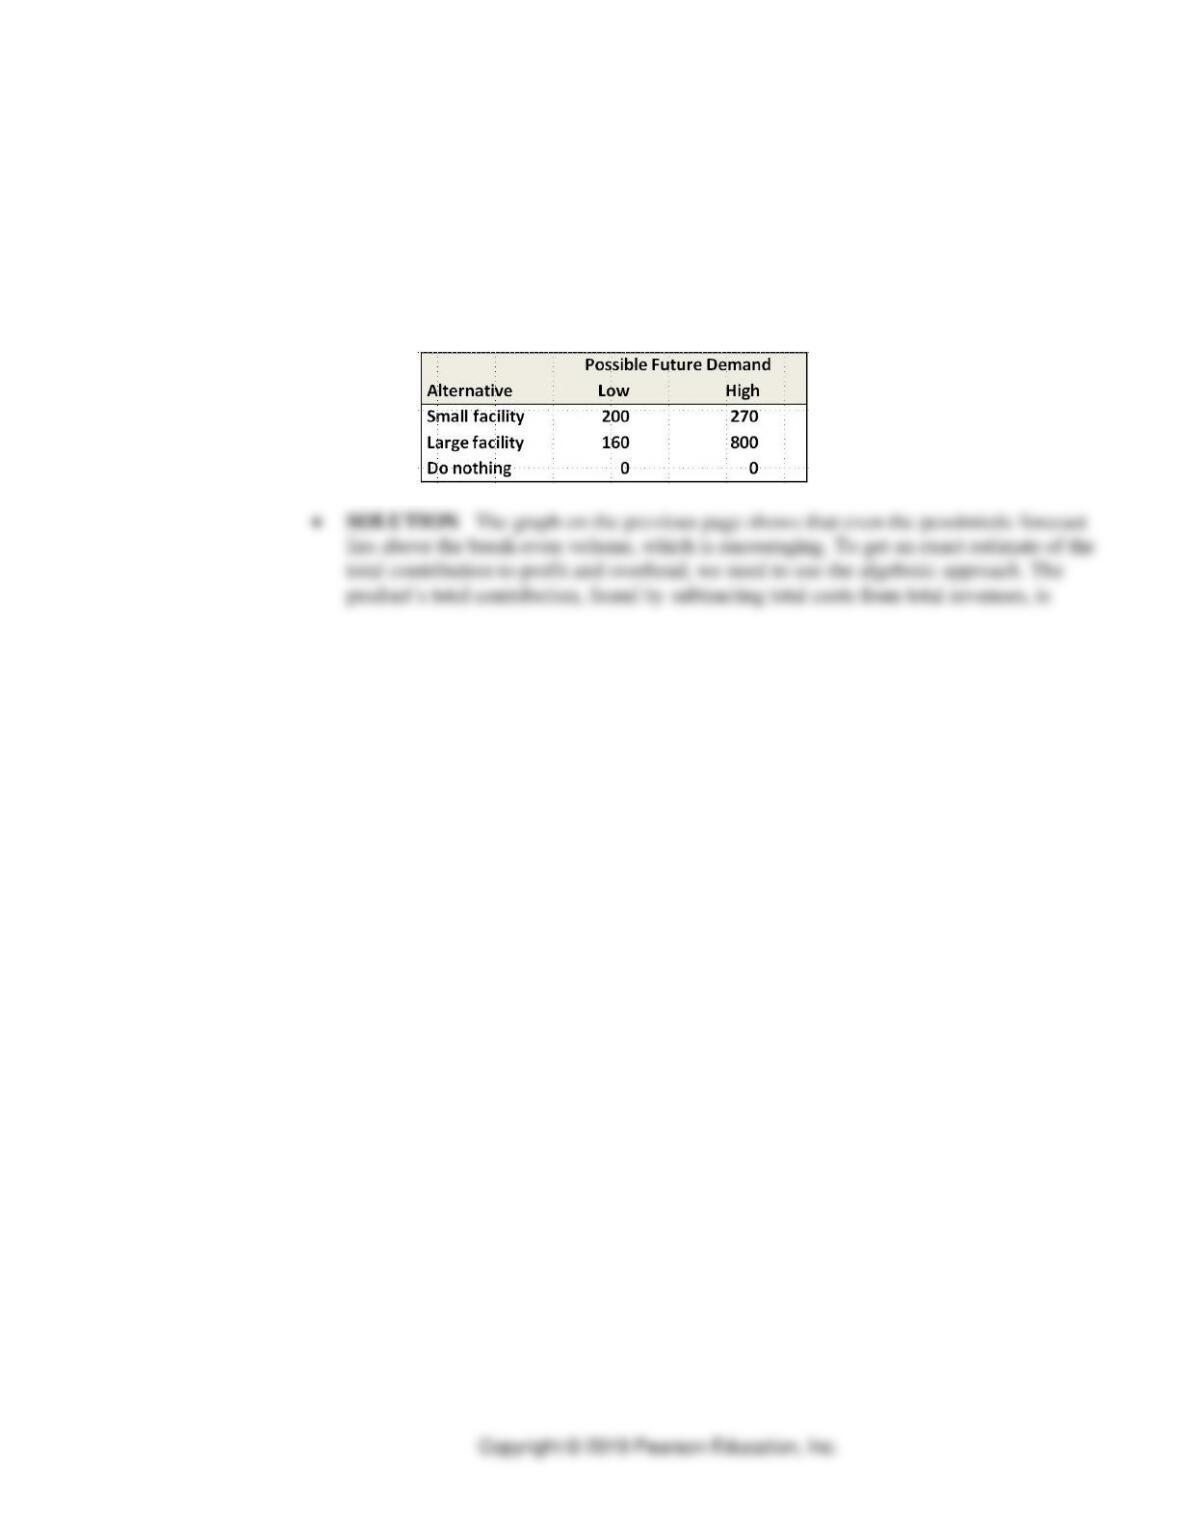
c. Application A.4: Decision Making Under Uncertainty
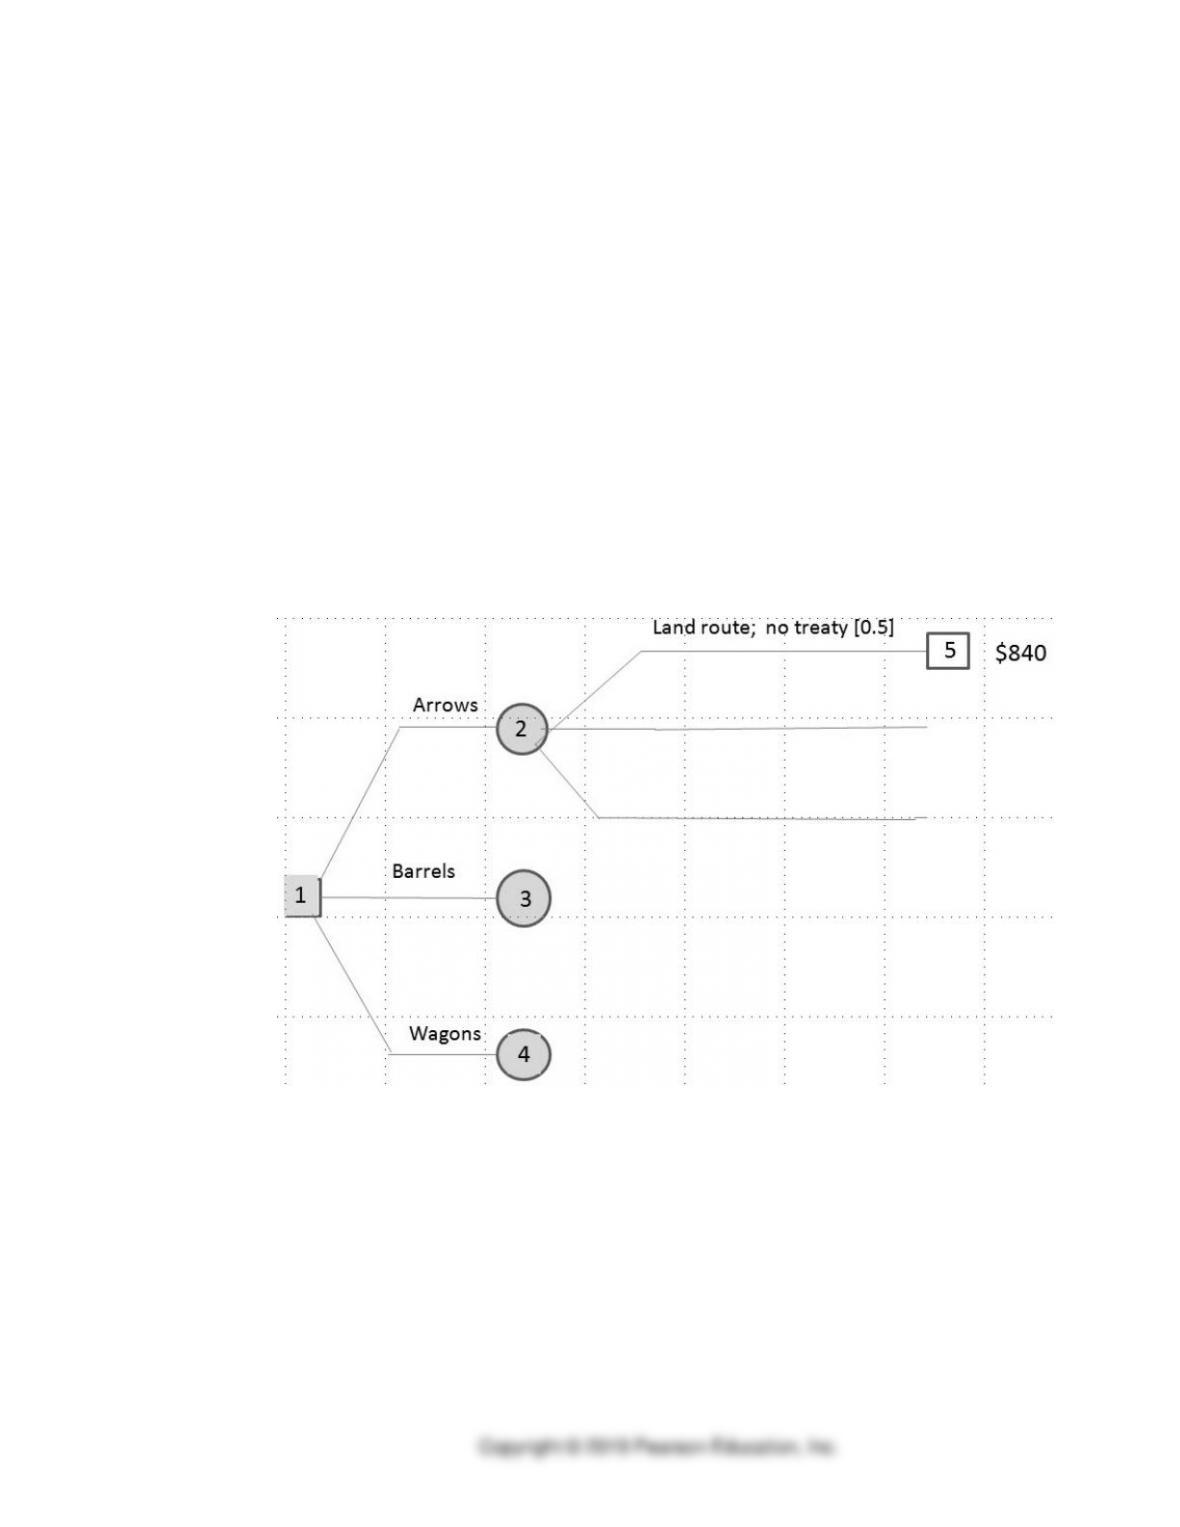
Fletcher (a realist), Cooper (a pessimist), and Wainwright (an optimist) are joint owners in a
company. They must decide whether to make Arrows, Barrels, or Wagons. The government is
about to issue a policy and recommendation on pioneer travel that depends on whether certain
treaties are obtained. The policy is expected to affect demand for the products; however, it is
impossible at this time to assess the probability of these policy “events.” The following data are
available:
Payoffs (Profits)
Alternative
Land Routes
No treaty
Land Routes
Treaty
Sea Routes
only
Arrows
$840,000
$440,000
$190,000
Barrels
$370,000
$220,000
$670,000
Wagons
$25,000
$1,150,000
($25,000)
• Which product would be favored by Fletcher?
Arrows:
Barrels:
Wagons:
• Which product would be favored by Cooper?
• Which product would be favored by Wainwright?
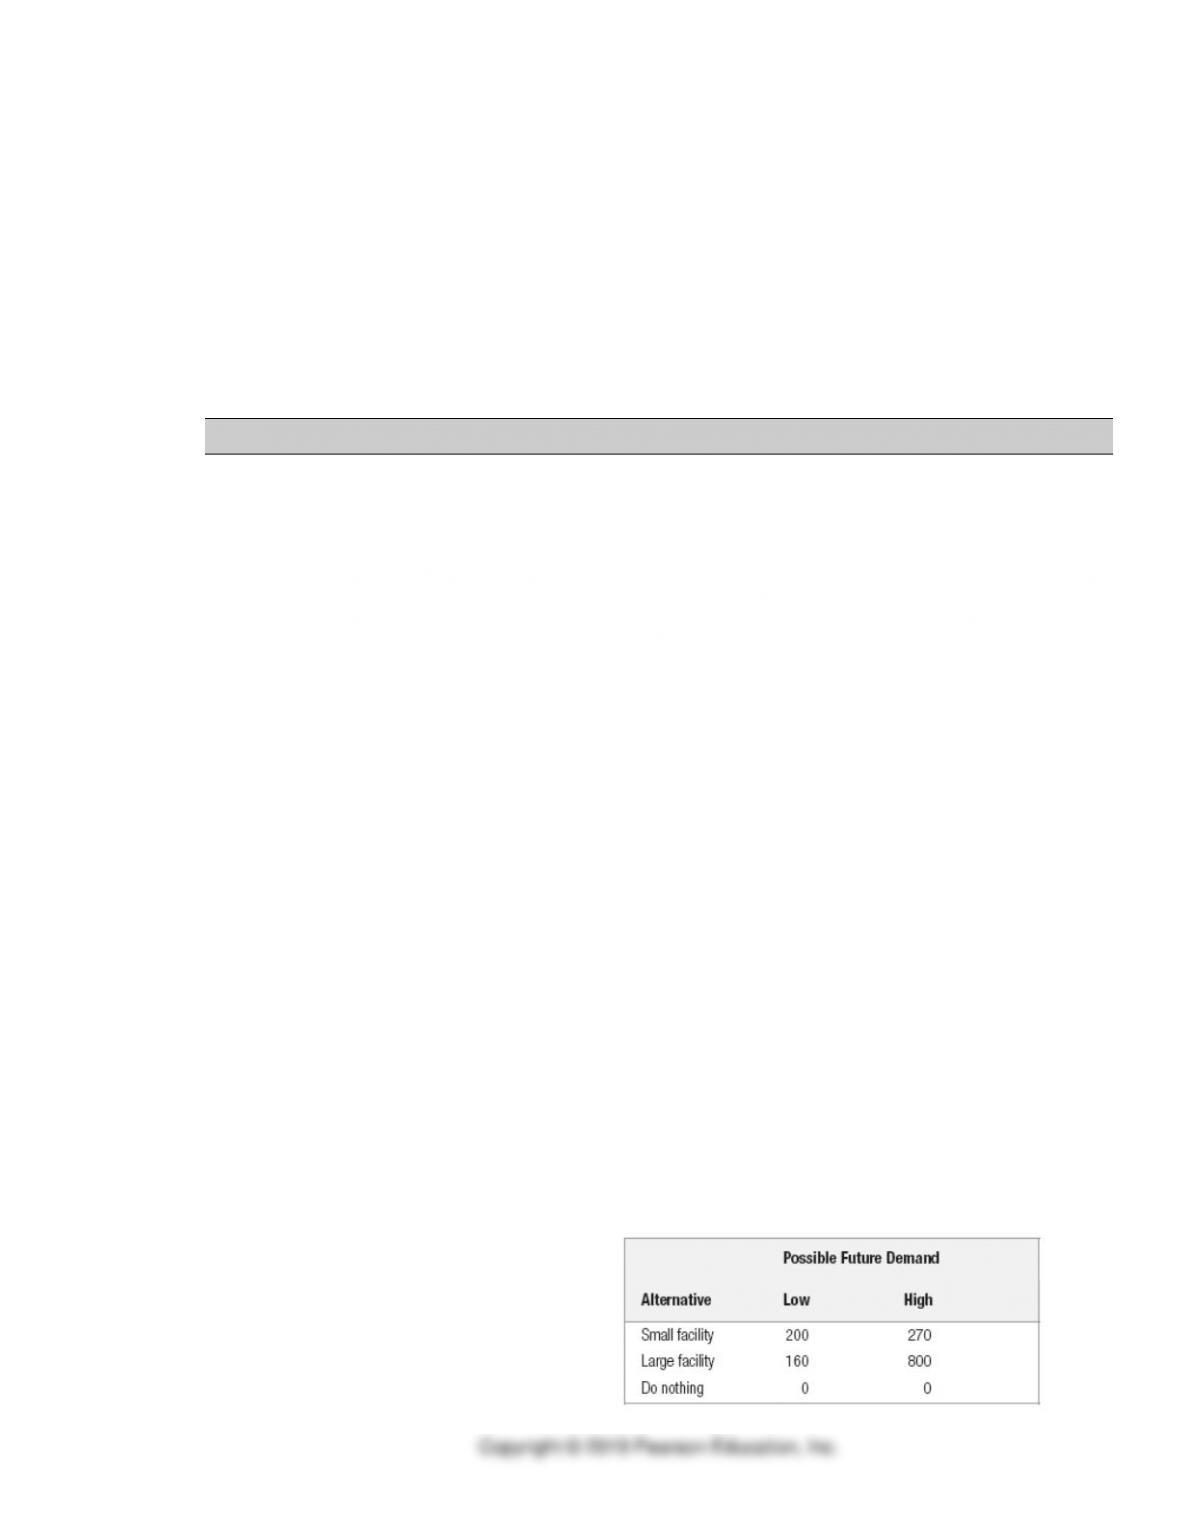
• What is the minimax regret solution?
Alternative
Land Routes
No treaty
Land Routes
Treaty
Sea Routes
only
Maximum Regret
Arrows
Barrels
Wagons
Conclusion:
3. Decision making under risk
a. Approach
b. Application A.5: Decision Making Under Risk.
For FC&W, find the best decision using the expected value rule. The probabilities for the events are
given below. What alternative has the best expected value?
Alternative
Land routes, No
Treaty (0.50)
Land Routes,
Treaty (0.30)
Sea routes
only (0.20)
Expected
Value
Arrows
(0.50)( )
+
(0.30)( )
+
(0.20)( )
=
Barrels
(0.50)( )
+
(0.30)( )
+
(0.20)( )
=
Wagons
(0.50)( )
+
(0.30)( )
+
(0.20)( )
=
Conclusion:
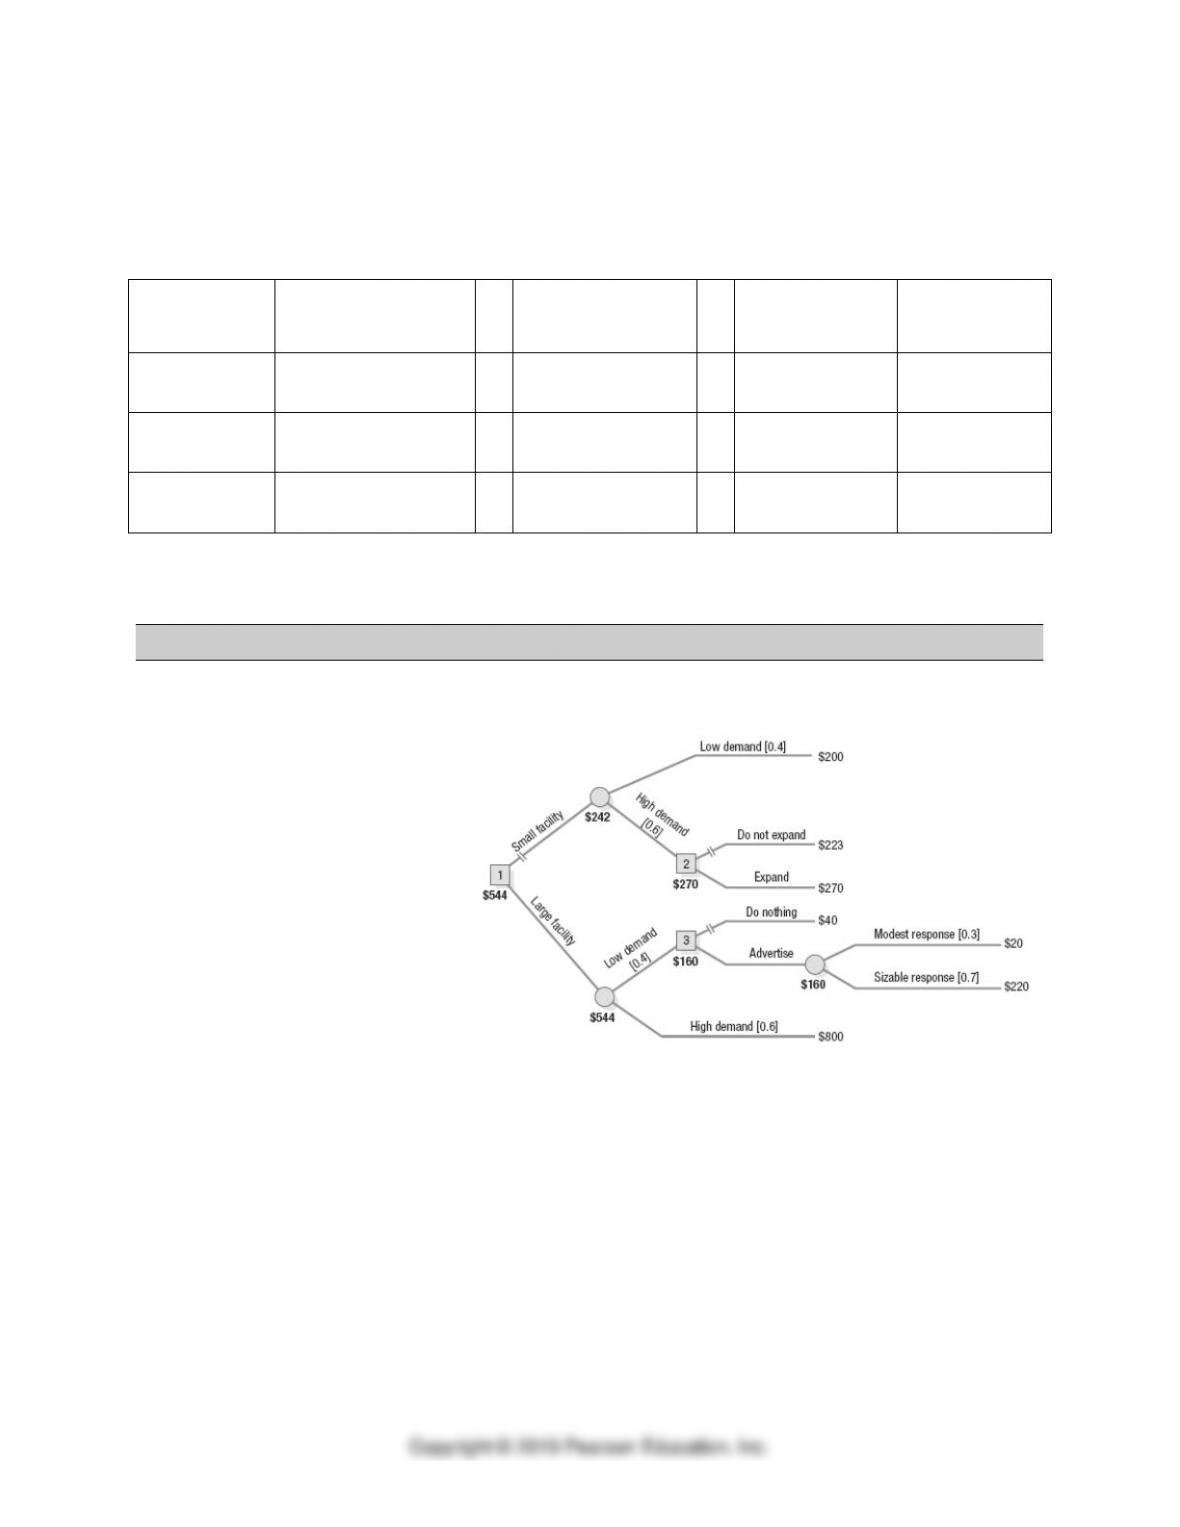
4. Decision Trees
• Describe the approach using decision trees:
o Definitions
o Steps
• Drawing the tree
• Analyzing the tree
• Use Example A.8: Analyzing a Decision Tree to practice drawing and analyzing a decision tree
• Application A.6: Decision Tree
o Draw the decision tree for the FC&W Application A.5.
o What is the expected payoff for the best alternative in the decision tree?