Unlock document.
This document is partially blurred.
Unlock all pages and 1 million more documents.
Get Access
PART 2 Managing Customer Demand
8-54
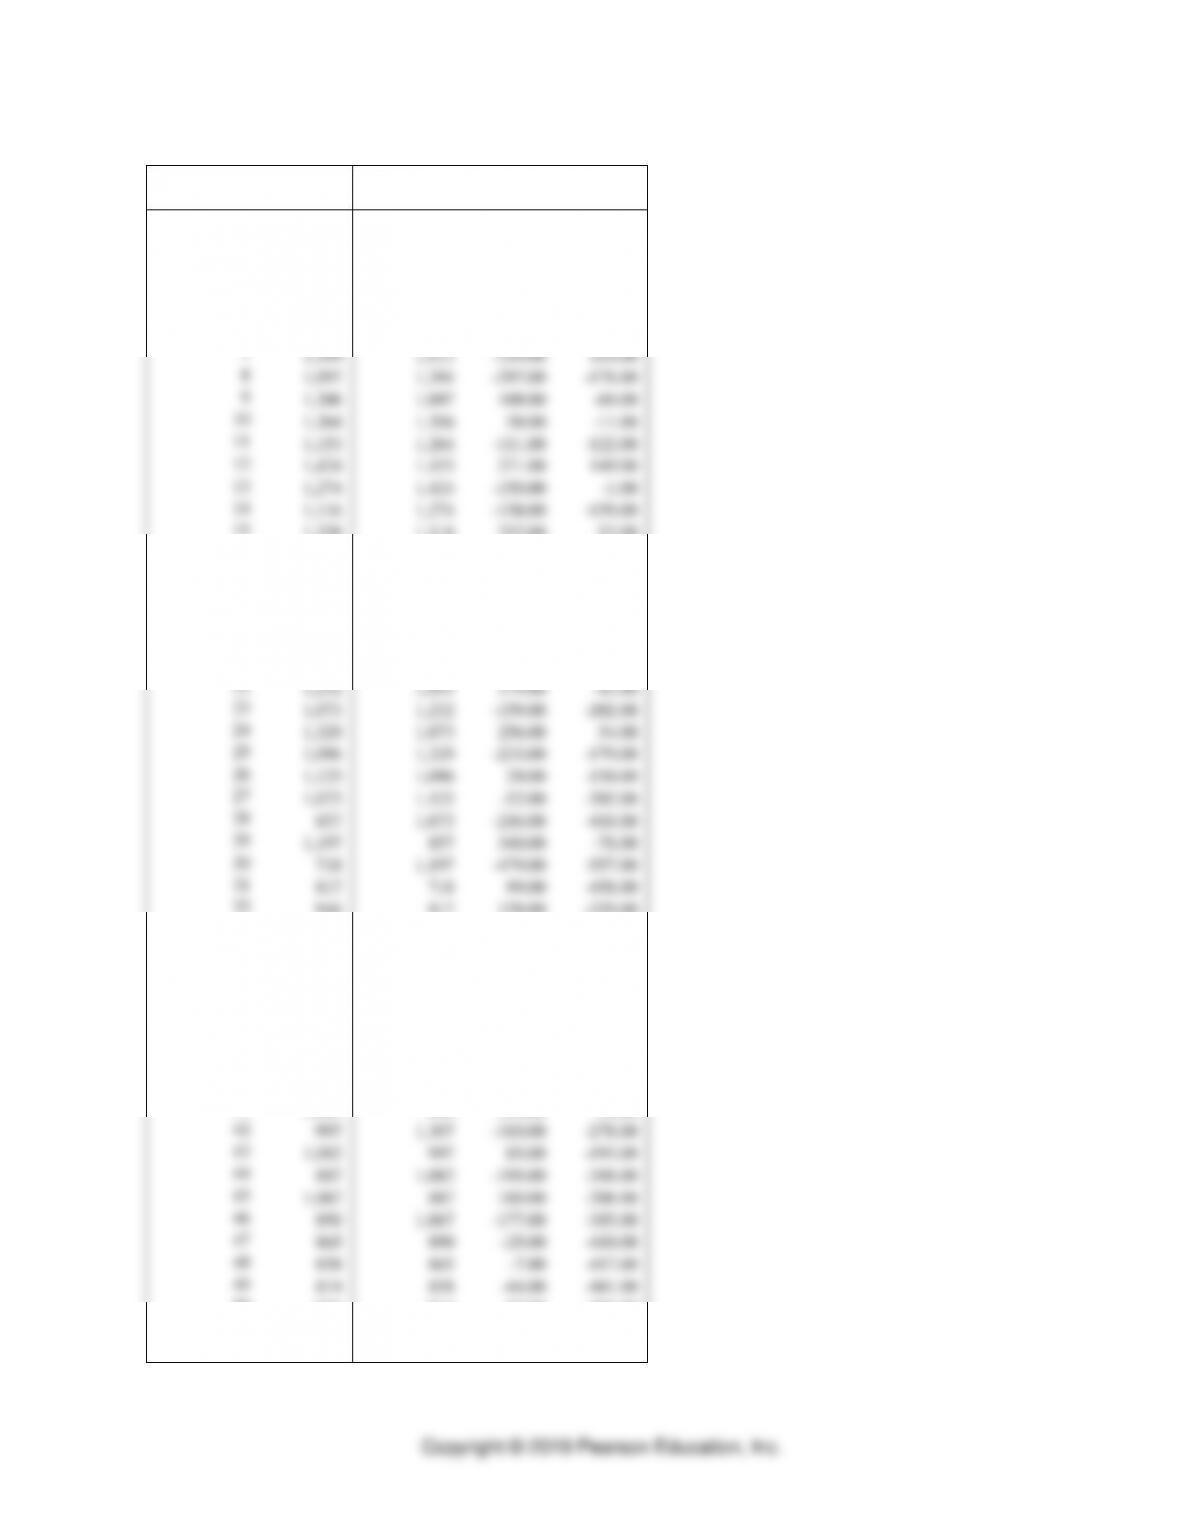
Naïve Forecast Worksheet
Actual Data
1-Period Moving Average
Period
Forecast
Error
CFE
1
1,160
2
779
1,160
3
1,134
779
4
1,275
1,134
5
1,355
1,275
80.00
80.00
6
1,513
1,355
158.00
238.00
7
1,394
1,513
-119.00
119.00
8
1,097
1,394
-297.00
-178.00
9
1,206
1,097
109.00
-69.00
10
1,264
1,206
58.00
-11.00
11
1,153
1,264
-111.00
-122.00
12
1,424
1,153
271.00
149.00
13
1,274
1,424
-150.00
-1.00
14
1,116
1,274
-158.00
-159.00
15
1,328
1,116
212.00
53.00
16
1,183
1,328
-145.00
-92.00
17
1,219
1,183
36.00
-56.00
18
1,132
1,219
-87.00
-143.00
19
1,094
1,132
-38.00
-181.00
20
1,040
1,094
-54.00
-235.00
21
1,053
1,040
13.00
-222.00
22
1,232
1,053
179.00
-43.00
23
1,073
1,232
-159.00
-202.00
24
1,329
1,073
256.00
54.00
25
1,096
1,329
-233.00
-179.00
26
1,125
1,096
29.00
-150.00
27
1,073
1,125
-52.00
-202.00
28
857
1,073
-216.00
-418.00
29
1,197
857
340.00
-78.00
30
718
1,197
-479.00
-557.00
31
817
718
99.00
-458.00
32
946
817
129.00
-329.00
33
725
946
-221.00
-550.00
34
748
725
23.00
-527.00
35
1,031
748
283.00
-244.00
36
1,061
1,031
30.00
-214.00
37
1,074
1,061
13.00
-201.00
38
941
1,074
-133.00
-334.00
39
994
941
53.00
-281.00
40
994
994
0.00
-281.00
41
1,307
994
313.00
32.00
42
997
1,307
-310.00
-278.00
43
1,082
997
85.00
-193.00
44
887
1,082
-195.00
-388.00
45
1,067
887
180.00
-208.00
46
890
1,067
-177.00
-385.00
47
865
890
-25.00
-410.00
48
858
865
-7.00
-417.00
49
814
858
-44.00
-461.00
50
871
814
57.00
-404.00
51
1,255
871
384.00
-20.00
52
980
1,255
-275.00
-295.00
Forecasting ⚫ CHAPTER 8 ⚫
8-55
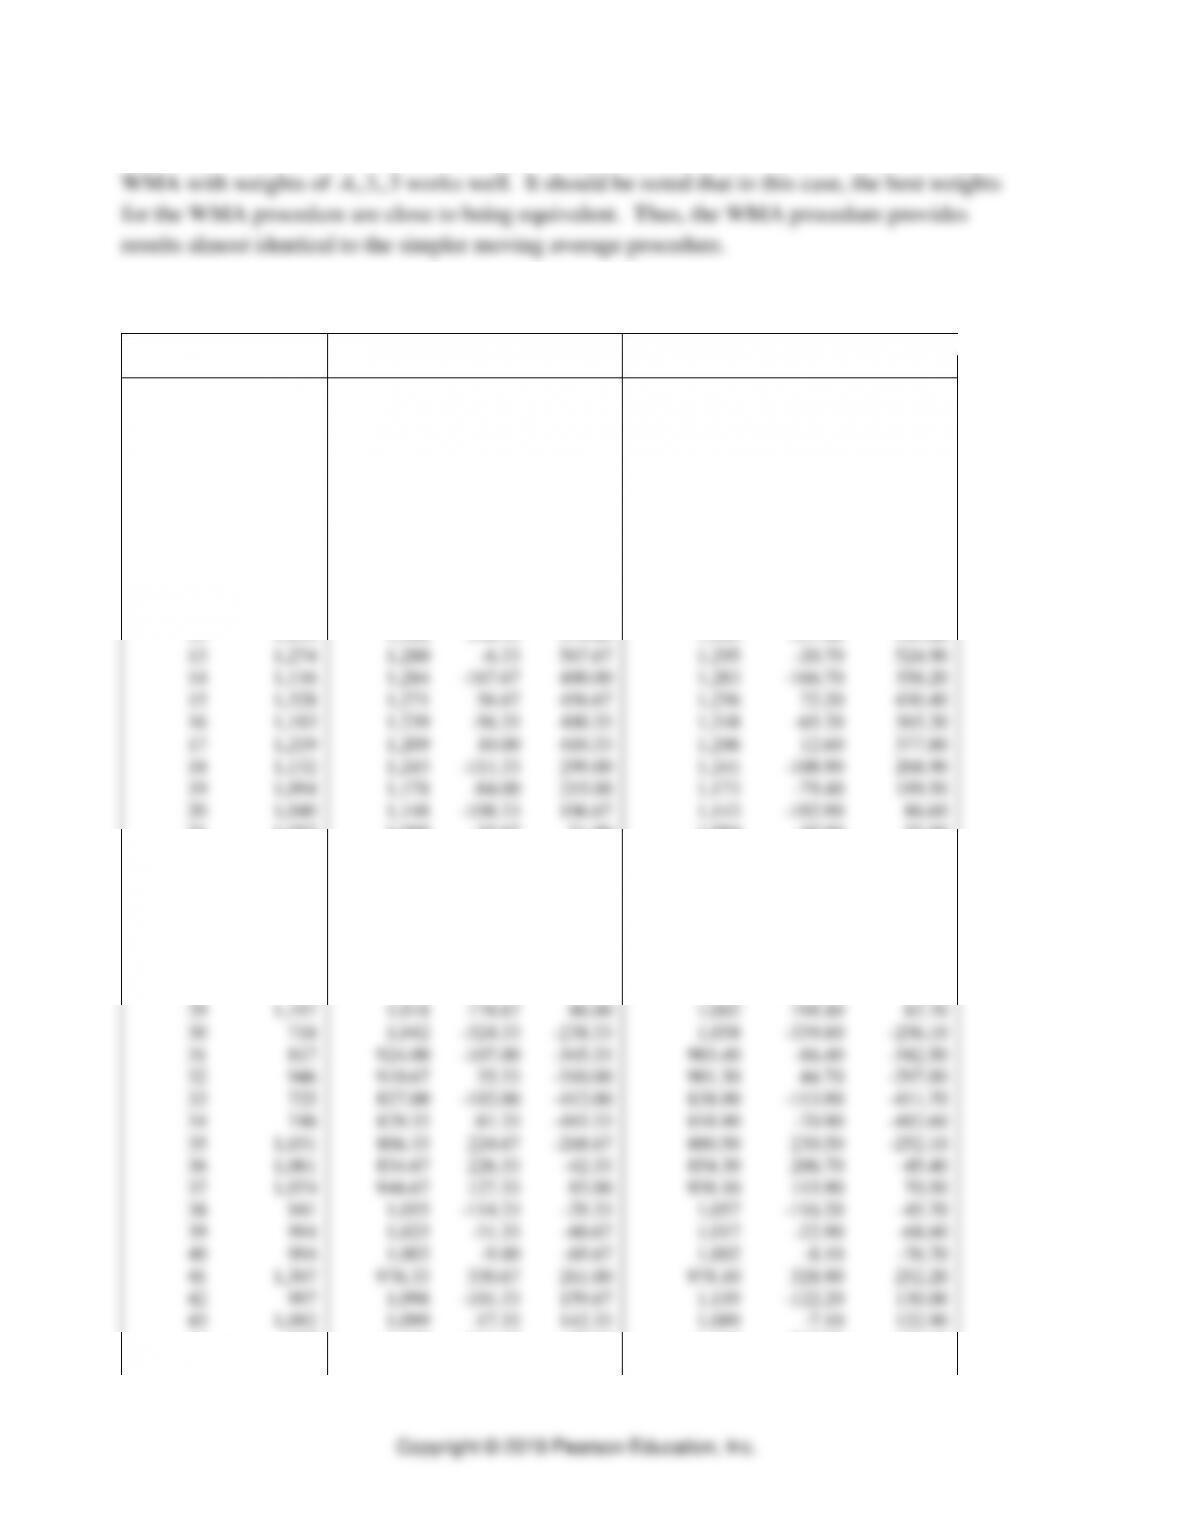
To minimize MAPE, a three-point moving average is a good choice. Additionally, a three-point
Moving Average (3-point) and Weighted Moving Average (3-point weights = .4, .3, .3) Forecast
Worksheets
Actual Data
3-Period Moving Average
3-Period Weighted Moving Average
Period
Data
Forecast
Error
CFE
Forecast
Error
CFE
1
1,160
2
779
3
1,134
4
1,275
1,024
250.67
250.67
1,035
239.70
239.70
5
1,355
1,063
292.33
543.00
1,084
271.10
510.80
6
1,513
1,255
258.33
801.33
1,265
248.30
759.10
7
1,394
1,381
13.00
814.33
1,394
-0.20
758.90
8
1,097
1,421
-323.67
490.67
1,418
-321.00
437.90
9
1,206
1,335
-128.67
362.00
1,311
-104.90
333.00
10
1,264
1,232
31.67
393.67
1,230
34.30
367.30
11
1,153
1,189
-36.00
357.67
1,197
-43.50
323.80
12
1,424
1,208
216.33
574.00
1,202
221.80
545.60
13
1,274
1,280
-6.33
567.67
1,295
-20.70
524.90
14
1,116
1,284
-167.67
400.00
1,283
-166.70
358.20
15
1,328
1,271
56.67
456.67
1,256
72.20
430.40
16
1,183
1,239
-56.33
400.33
1,248
-65.20
365.20
17
1,219
1,209
10.00
410.33
1,206
12.60
377.80
18
1,132
1,243
-111.33
299.00
1,241
-108.90
268.90
19
1,094
1,178
-84.00
215.00
1,173
-79.40
189.50
20
1,040
1,148
-108.33
106.67
1,143
-102.90
86.60
21
1,053
1,089
-35.67
71.00
1,084
-30.80
55.80
22
1,232
1,062
169.67
240.67
1,061
170.60
226.40
23
1,073
1,108
-35.33
205.33
1,121
-47.70
178.70
24
1,329
1,119
209.67
415.00
1,115
214.30
393.00
25
1,096
1,211
-115.33
299.67
1,223
-127.10
265.90
26
1,125
1,166
-41.00
258.67
1,159
-34.00
231.90
27
1,073
1,183
-110.33
148.33
1,178
-104.50
127.40
28
857
1,098
-241.00
-92.67
1,096
-238.50
-111.10
29
1,197
1,018
178.67
86.00
1,002
194.80
83.70
30
718
1,042
-324.33
-238.33
1,058
-339.80
-256.10
31
817
924.00
-107.00
-345.33
903.40
-86.40
-342.50
32
946
910.67
35.33
-310.00
901.30
44.70
-297.80
33
725
827.00
-102.00
-412.00
838.90
-113.90
-411.70
34
748
829.33
-81.33
-493.33
818.90
-70.90
-482.60
35
1,031
806.33
224.67
-268.67
800.50
230.50
-252.10
36
1,061
834.67
226.33
-42.33
854.30
206.70
-45.40
37
1,074
946.67
127.33
85.00
958.10
115.90
70.50
38
941
1,055
-114.33
-29.33
1,057
-116.20
-45.70
39
994
1,025
-31.33
-60.67
1,017
-22.90
-68.60
40
994
1,003
-9.00
-69.67
1,002
-8.10
-76.70
41
1,307
976.33
330.67
261.00
978.10
328.90
252.20
42
997
1,098
-101.33
159.67
1,119
-122.20
130.00
43
1,082
1,099
-17.33
142.33
1,089
-7.10
122.90
44
887
1,129
-241.67
-99.33
1,124
-237.00
-114.10
45
1,067
988.67
78.33
-21.00
978.50
88.50
-25.60

PART 2 Managing Customer Demand
8-56
46
890
1,012
-122.00
-143.00
1,018
-127.50
-153.10
47
865
948.00
-83.00
-226.00
942.20
-77.20
-230.30
48
858
940.67
-82.67
-308.67
933.10
-75.10
-305.40
49
814
871.00
-57.00
-365.67
869.70
-55.70
-361.10
50
871
845.67
25.33
-340.33
842.50
28.50
-332.60
51
1,255
847.67
407.33
67.00
850.00
405.00
72.40
52
980
980.00
0.00
67.00
1,008
-27.50
44.90
Forecasting ⚫ CHAPTER 8 ⚫
8-57
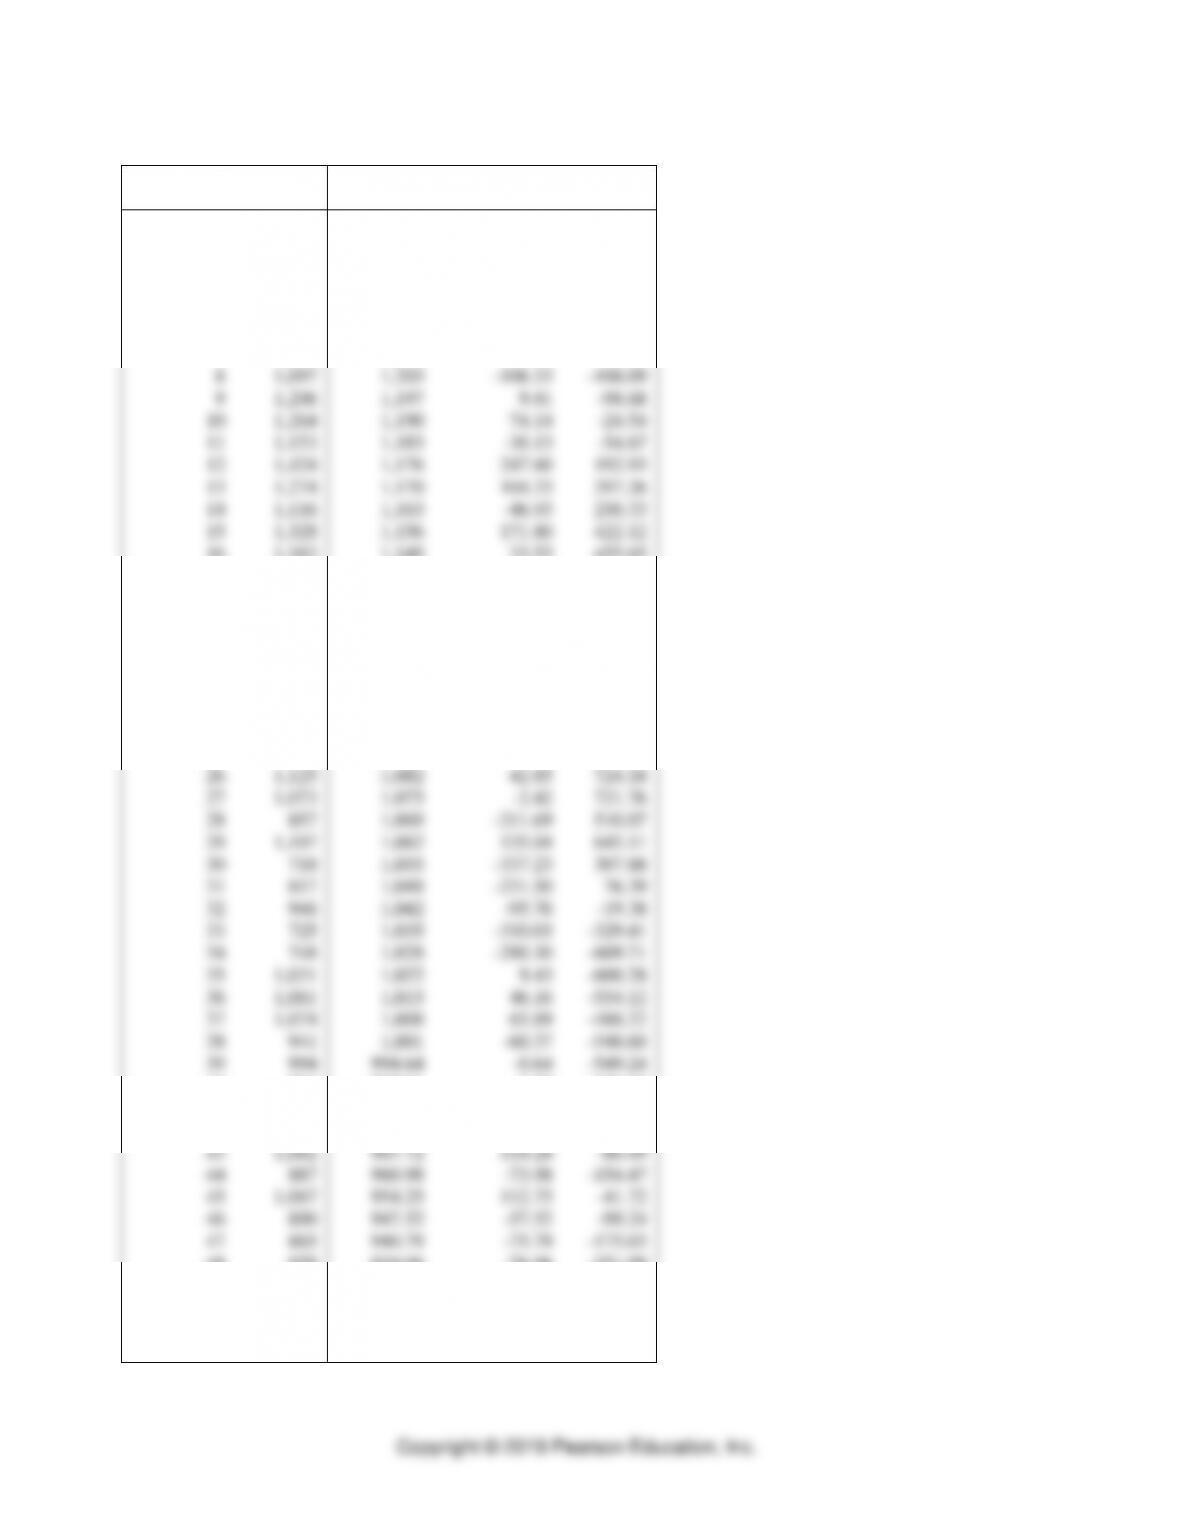
Trend Projection with Regression Forecast Worksheet
Actual Data
Trend Projection
Period
Forecast
Error
CFE
1
1,160
1,250
-90.45
-90.45
2
779
1,244
-464.72
-555.16
3
1,134
1,237
-102.98
-658.15
4
1,275
1,230
44.75
-613.40
5
1,355
1,224
131.48
-481.92
6
1,513
1,217
296.21
-185.71
7
1,394
1,210
183.94
-1.76
8
1,097
1,203
-106.33
-108.09
9
1,206
1,197
9.41
-98.68
10
1,264
1,190
74.14
-24.54
11
1,153
1,183
-30.13
-54.67
12
1,424
1,176
247.60
192.93
13
1,274
1,170
104.33
297.26
14
1,116
1,163
-46.93
250.33
15
1,328
1,156
171.80
422.12
16
1,183
1,149
33.53
455.65
17
1,219
1,143
76.26
531.91
18
1,132
1,136
-4.01
527.90
19
1,094
1,129
-35.28
492.63
20
1,040
1,123
-82.54
410.08
21
1,053
1,116
-62.81
347.27
22
1,232
1,109
122.92
470.19
23
1,073
1,102
-29.35
440.84
24
1,329
1,096
233.38
674.22
25
1,096
1,089
7.11
681.34
26
1,125
1,082
42.85
724.18
27
1,073
1,075
-2.42
721.76
28
857
1,069
-211.69
510.07
29
1,197
1,062
135.04
645.11
30
718
1,055
-337.23
307.88
31
817
1,048
-231.50
76.39
32
946
1,042
-95.76
-19.38
33
725
1,035
-310.03
-329.41
34
748
1,028
-280.30
-609.71
35
1,031
1,022
9.43
-600.28
36
1,061
1,015
46.16
-554.12
37
1,074
1,008
65.89
-488.22
38
941
1,001
-60.37
-548.60
39
994
994.64
-0.64
-549.24
40
994
987.91
6.09
-543.15
41
1,307
981.18
325.82
-217.33
42
997
974.45
22.55
-194.77
43
1,082
967.72
114.28
-80.49
44
887
960.98
-73.98
-154.47
45
1,067
954.25
112.75
-41.72
46
890
947.52
-57.52
-99.24
47
865
940.79
-75.79
-175.03
48
858
934.06
-76.06
-251.09
49
814
927.33
-113.33
-364.42
50
871
920.59
-49.59
-414.01
51
1,255
913.86
341.14
-72.87
52
980
907.13
72.87
0.00

PART 2 Managing Customer Demand
Copyright © 2019 Pearson Education, Inc.
8-58
Results screen for each method used indicate that:
Naïve forecasting method has the highest MAD,MSE and MAPE.
MA and WMA perform similarly in terms of MAPE
Method 1 - Moving Average (Naïve):
1
-Period Moving Average
Forecast for Period 53
980.00
CFE
-295.00
MAD
147.40
MSE
34,238
MAPE
14.02%
Method 2 - Moving Average:
3
-Period Moving Average
Forecast for Period 53
1,035
CFE
-183.67
MAD
124.31
MSE
25,643
MAPE
11.72%
Method 3 - Weighted Moving Average:
3
-Period Weighted Moving Average
Forecast for Period 53
1,030
CFE
-194.80
MAD
124.42
MSE
25,404
MAPE
11.75%
Method 4 – Trend Projection (using all of the data)
Intercept
1257
Slope
-6.73
r2
0.28
Forecast for Period 53
900.40
Forecast for Period 54
893.67
Forecast for Period 55
886.93
Forecast for Period 56
880.20
Forecast for Period 57
873.47
Forecast for Period 58
866.74
CFE
613.40
MAD
111.68
MSE
22,210
MAPE
10.85%
Moving Average and Weighted Moving Average provide very similar results. Trend Projection
using Regression provide better results.
Forecasting ⚫ CHAPTER 8 ⚫
8-59
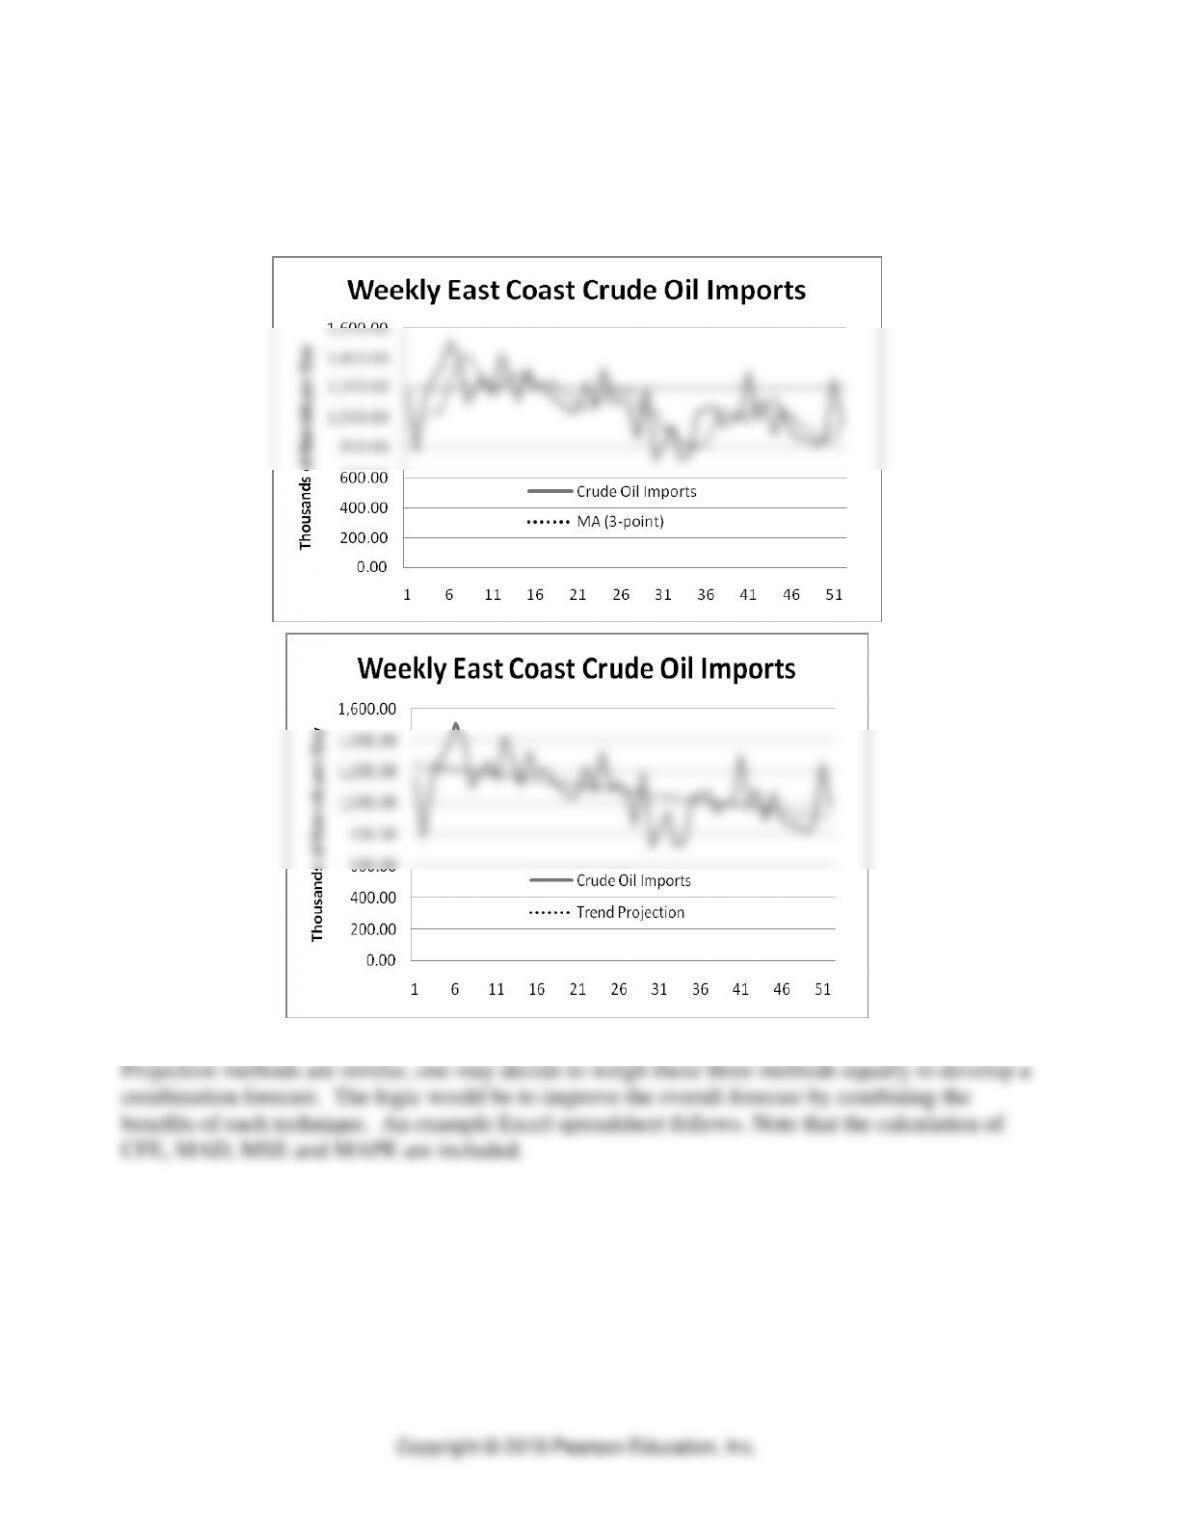
It is interesting to note, as seen in the following plots, that the MA and Trend models provide
somewhat similar results by forecasting in different ways. The MA and WMA methods attempt to
project the past forward while dampen random variation. The Trend Projection method attempts
to isolate and project a linear rise or fall in the data series.
b. Since the performance of the Moving Average, Weighted Moving Average and Trend
PART 2 Managing Customer Demand
8-60
Combination Forecast (MA,WMA, and Trend equally weighted)
Week (t)
Crude Oil
Imports
Forecast
Error
Absolute
Error
Squared
Error
Absolute
Percent
Error
1
1,160.00
1,250.45
-90.45
90.45
8,180.66
7.80
2
779.00
1,243.72
-464.72
464.72
215,960.30
59.66
3
1,134.00
1,236.98
-102.98
102.98
10,605.62
9.08
4
1,275.00
1,096.63
178.37
178.37
31,816.43
13.99
5
1,355.00
1,123.36
231.64
231.64
53,656.04
17.10
6
1,513.00
1,245.39
267.61
267.61
71,617.77
17.69
7
1,394.00
1,328.42
65.58
65.58
4,300.88
4.70
8
1,097.00
1,347.33
-250.33
250.33
62,665.39
22.82
9
1,206.00
1,280.72
-74.72
74.72
5,583.08
6.20
10
1,264.00
1,217.30
46.70
46.70
2,181.05
3.69
11
1,153.00
1,189.54
-36.54
36.54
1,335.41
3.17
12
1,424.00
1,195.42
228.58
228.58
52,248.07
16.05
13
1,274.00
1,248.23
25.77
25.77
663.92
2.02
14
1,116.00
1,243.10
-127.10
127.10
16,154.53
11.39
15
1,328.00
1,227.78
100.22
100.22
10,044.29
7.55
16
1,183.00
1,212.33
-29.33
29.33
860.54
2.48
17
1,219.00
1,186.05
32.95
32.95
1,085.93
2.70
18
1,132.00
1,206.75
-74.75
74.75
5,587.13
6.60
19
1,094.00
1,160.23
-66.23
66.23
4,385.81
6.05
20
1,040.00
1,137.93
-97.93
97.93
9,589.49
9.42
21
1,053.00
1,096.09
-43.09
43.09
1,857.02
4.09
22
1,232.00
1,077.60
154.40
154.40
23,837.87
12.53
23
1,073.00
1,110.46
-37.46
37.46
1,403.32
3.49
24
1,329.00
1,109.88
219.12
219.12
48,011.96
16.49
25
1,096.00
1,174.44
-78.44
78.44
6,152.80
7.16
26
1,125.00
1,135.72
-10.72
10.72
114.88
0.95
27
1,073.00
1,145.42
-72.42
72.42
5,244.46
6.75
28
857.00
1,087.40
-230.40
230.40
53,082.76
26.88
29
1,197.00
1,027.50
169.50
169.50
28,731.10
14.16
30
718.00
1,051.79
-333.79
333.79
111,413.72
46.49
31
817.00
958.63
-141.63
141.63
20,059.60
17.34
32
946.00
951.24
-5.24
5.24
27.50
0.55
33
725.00
900.31
-175.31
175.31
30,733.87
24.18
34
748.00
892.18
-144.18
144.18
20,787.29
19.28
35
1,031.00
876.13
154.87
154.87
23,983.45
15.02
36
1,061.00
901.27
159.73
159.73
25,514.32
15.05
37
1,074.00
970.96
103.04
103.04
10,617.78
9.59
38
941.00
1,037.97
-96.97
96.97
9,403.00
10.30
39
994.00
1,012.29
-18.29
18.29
334.59
1.84
40
994.00
997.67
-3.67
3.67
13.47
0.37
41
1,307.00
978.54
328.46
328.46
107,887.72
25.13
42
997.00
1,063.99
-66.99
66.99
4,488.12
6.72
43
1,082.00
1,052.05
29.95
29.95
897.03
2.77
44
887.00
1,071.22
-184.22
184.22
33,935.81
20.77
45
1,067.00
973.81
93.19
93.19
8,685.09
8.73
Forecasting ⚫ CHAPTER 8 ⚫
8-61
46
890.00
992.34
-102.34
102.34
10,473.48
11.50
47
865.00
943.66
-78.66
78.66
6,187.84
9.09
48
858.00
935.94
-77.94
77.94
6,074.82
9.08
49
814.00
889.34
-75.34
75.34
5,676.37
9.26
50
871.00
869.59
1.41
1.41
2.00
0.16
51
1,255.00
870.51
384.49
384.49
147,833.01
30.64
52
980.00
964.88
15.12
15.12
228.72
1.54
984.88
78.31
115.55
21,992.79
10.99
PART 2 Managing Customer Demand
8-62
In-Class Exercise
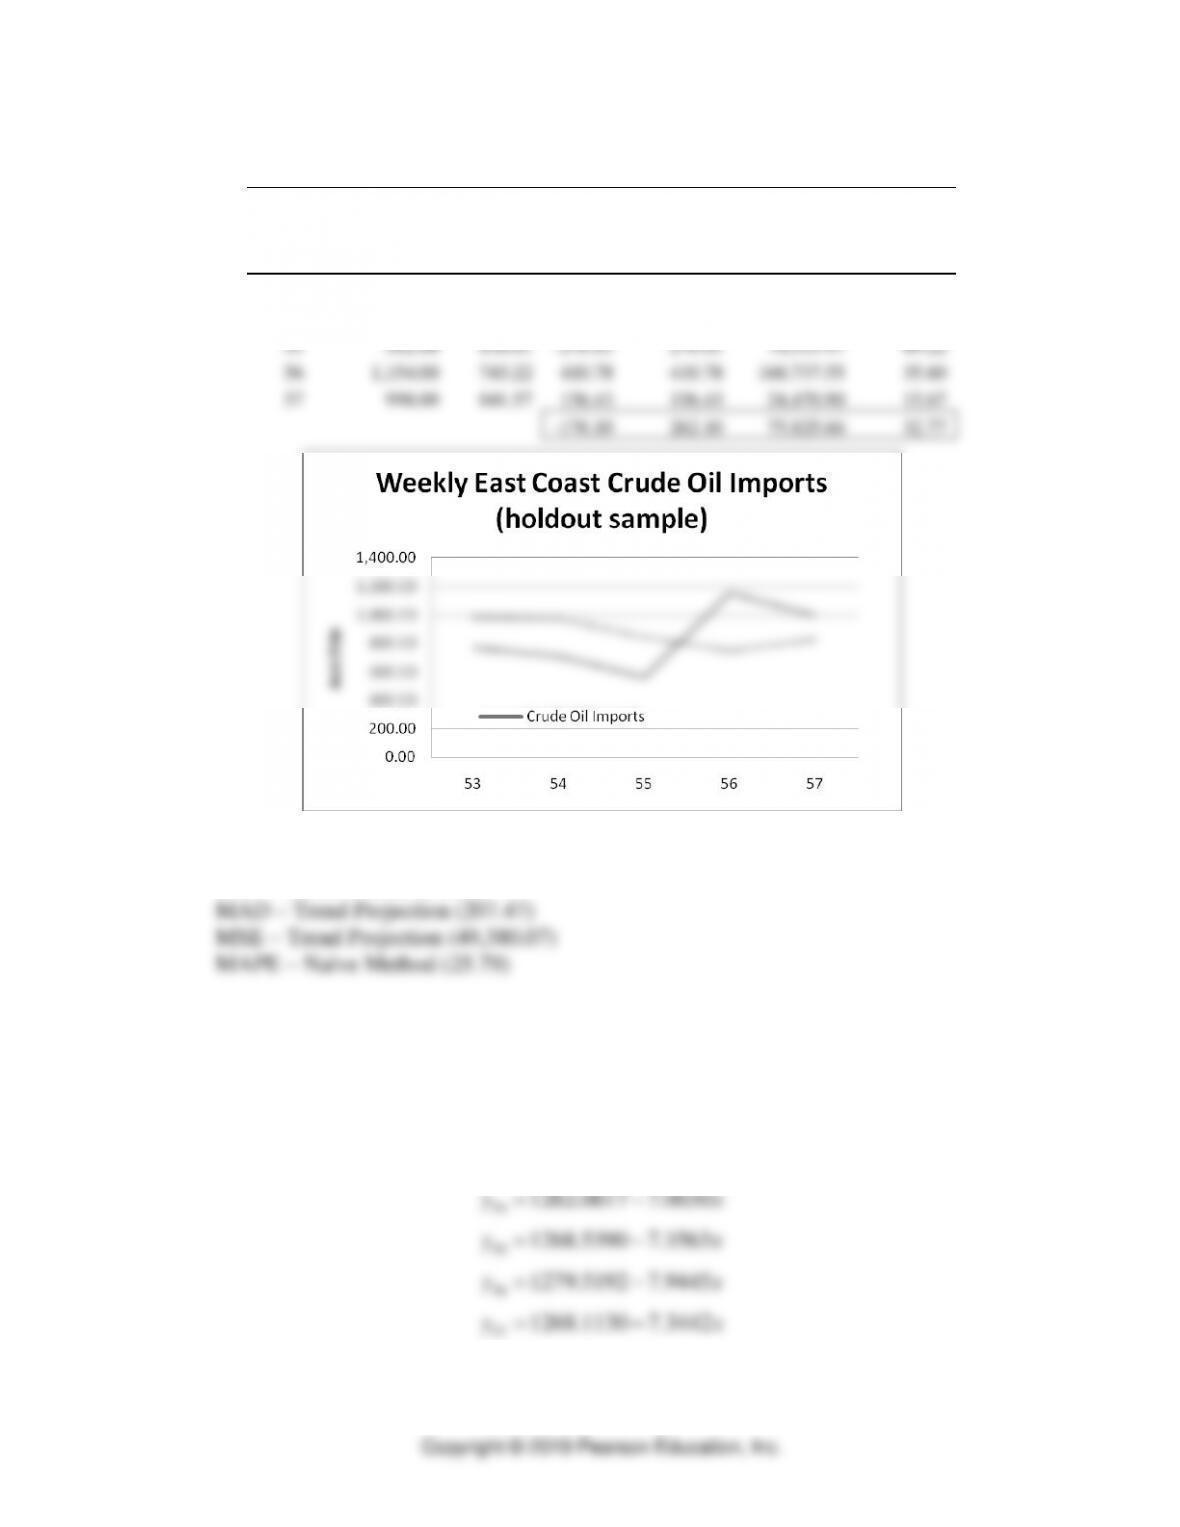
The following spreadsheets and plots provide the forecasts and the performance of the Naive,
MA, Trend Projection and Combination Forecasts as new data are added.
1-Period Moving Average (Naïve) Forecast
Week (t)
Crude Oil
Imports
Forecast
Error
Absolute
Error
Squared Error
Absolute
Percent
Error
53
771.00
980.00
-209.00
209.00
43,681.00
27.11
54
709.00
771.00
-62.00
62.00
3,844.00
8.74
55
562.00
709.00
-147.00
147.00
21,609.00
26.16
56
1,154.00
562.00
592.00
592.00
350,464.00
51.30
57
998.00
1,154.00
-156.00
156.00
24,336.00
15.63
18.00
233.20
88,786.80
25.79
3-Period Moving Average Forecast
Week (t)
Crude Oil
Imports
Forecast
Error
Absolute
Error
Squared Error
Absolute
Percent
Error
53
771.00
1,035.33
-264.33
264.33
69,872.11
34.28
54
709.00
1,002.00
-293.00
293.00
85,849.00
41.33
55
562.00
820.00
-258.00
258.00
66,564.00
45.91
56
1,154.00
680.67
473.33
473.33
224,044.44
41.02
57
998.00
808.33
189.67
189.67
35,973.44
19.00
-152.33
295.67
96,460.60
36.31
Forecasting ⚫ CHAPTER 8 ⚫
8-63
Trend Projection with Regression Forecast
Week (t)
Crude Oil
Imports
Forecast
Error
Absolute
Error
Squared Error
Absolute
Percent
Error
53
771.00
900.40
-129.40
129.40
16,743.89
16.78
54
709.00
893.67
-184.67
184.67
34,101.70
26.05
55
562.00
886.93
-324.93
324.93
105,582.60
57.82
56
1,154.00
880.20
273.80
273.80
74,964.77
23.73
57
998.00
873.47
124.53
124.53
15,507.39
12.48
-240.67
207.47
49,380.07
27.37
PART 2 Managing Customer Demand
8-64
Combination Forecast (MA,WMA, and Trend equally weighted)
Week (t)
Crude Oil
Imports
Forecast
Error
Absolute
Error
Squared
Error
Absolute
Percent
Error
53
771.00
988.51
-217.51
217.51
47,310.82
28.21
54
709.00
958.19
-249.19
249.19
62,095.07
35.15
55
562.00
838.61
-276.61
276.61
76,513.97
49.22
56
1,154.00
743.22
410.78
410.78
168,737.55
35.60
57
998.00
841.57
156.43
156.43
24,470.90
15.67
-176.10
262.10
75,825.66
32.77
In terms of the overall best-performing methods given the holdout data:
CFE – Naive Method (18.00)
The intercept and slope parameters calculated with the Trend Projection with Regression method
were not updated after each holdout data point was provided. Students may be interested in
examining the effectiveness of recalibrating the regression equation each period.
Recalibrated regression equations are as follows:
53
54
55
56
57
1257.1787 6.7317
1262.0617 7.0030
1268.5390 7.3563
1279.5192 7.9445
1268.1130 7.3442
yx
yx
yx
yx
yx
=−
=−
=−
=−
=−

Forecasting ⚫ CHAPTER 8 ⚫
8-65
Parameter recalibration provides the following forecast performance for Trend Projection:
Trend Projection with Regression Forecast - updated each holdout period
Week
(t)
Crude Oil
Imports
Forecast
Error
Absolute
Error
Squared
Error
Absolute
Percent
Error
53
771.00
900.40
-129.40
129.40
16,743.89
16.78
54
709.00
883.90
-174.90
174.90
30,590.21
24.67
55
562.00
863.94
-301.94
301.94
91,168.61
53.73
56
1,154.00
834.63
319.37
319.37
101,999.58
27.68
57
998.00
849.49
148.51
148.51
22,053.98
14.88
-138.36
214.82
52,511.25
27.55
Comparing Results of History File vs. Holdout File
The following table addresses the reason for doing a holdout sample. We want to see if the error
measures found for the history file give an overly optimistic picture of how well the forecasting
techniques will do on data that was not considered when the models were developed.
Forecasting
CFE
MAD
Technique
History File
Holdout Sample
History File
Holdout Sample
Naive
-295.00
18.00
147.40
233.20
Moving Average
-183.67
-152.33
124.31
295.67
Trend Progression
613.40
-240.67
111.68
207.47
Combination
78.31
-176.10
115.55
262.10
These results show surprisingly that the techniques generally do better on the holdout sample than
the history file with respect to CFE. Unfortunately, it is a different story with regard to MAD.
MAD errors are roughly double those experienced with the history file. Developing models using
demand data on which their performance is evaluated may indeed overstate the accuracy of the
models in forecasting future demand, as opposed to explaining past demand.

PART 2 Managing Customer Demand
8-66
ILLUSTRATIVE GRADED HOMEWORK ASSIGNMENT
Shown below is one way to make graded homework assignments, using Problem 12 as a
case in point.
Name ____________________________________________
Graded Homework #6: Time-series Forecasting
Due on Tuesday 11/27 on Blackboard at 1:45 pm and on paper in class.
See Problem 12 in Chapter 8 of your textbook. The problem lists five forecasting methods (i through v). Using the
OM Explorer’s Time Series Forecasting solver, answer the below questions only for methods i, ii, and v.
1.
What is the forecast for the next period using method i?
___________
2.
What is the forecast for the next period using method ii?
___________
3
What is the forecast for the next period using method iii?
___________
3.
What is the forecast for the next period using method v?
___________
4
If MAD is the performance criterion chosen by the administration,
which forecasting method should it choose?
___________
5.
If MSE is the performance criterion chosen by the administration,
which forecasting method should it choose?
___________
6.
If bias is the performance criterion chosen by the administration,
which forecasting method should it choose?
Hint: “Bias” is CFE or CFE / n.
___________
• Submit your answers in Blackboard ASSIGNMENTS at “Time-series Forecasting Submission” by the required
time above.
• In addition, submit your paper answer in class as follows:
a. This page with answers entered above.
b. Attach printouts of “Details and Error Analysis” page from POM for Windows for each of the three
forecasting methods with your name clearly identified on each.
NOTE: You have to solve the problem three times – once for each method. Recall that you can put your name in the
data set “title” field so it appears on the printouts.
Source: This assignment was prepared by Dr. Daniel Steele, University of South Carolina, and illustrates one way to
convert homework problems into graded homework assignments. The assessment components in MyLab Operations
Management also offer powerful options.


