Chapter
7
Project Management
DISCUSSION QUESTIONS
1. Software is an essential element for successful management of complex projects. It
can provide information on completion performance of critical activities, highlight
2. Slack in a project is determined by calculating the early start time (ES) and the
latest start time (LS) for each activity. The ES time for an activity is found by
moving forward through the project network from the Start activity along the
longest time path to that activity. Using the project’s targeted completion date, the
3 Risk is a measure of the probability and consequence of not reaching a project goal.
There are four major sources of risk in a project: (1) Strategic fit, which reflects the
bad estimates for activity times.
Part I Managing Processes
7-2
PROBLEMS
Developing the Project Schedule
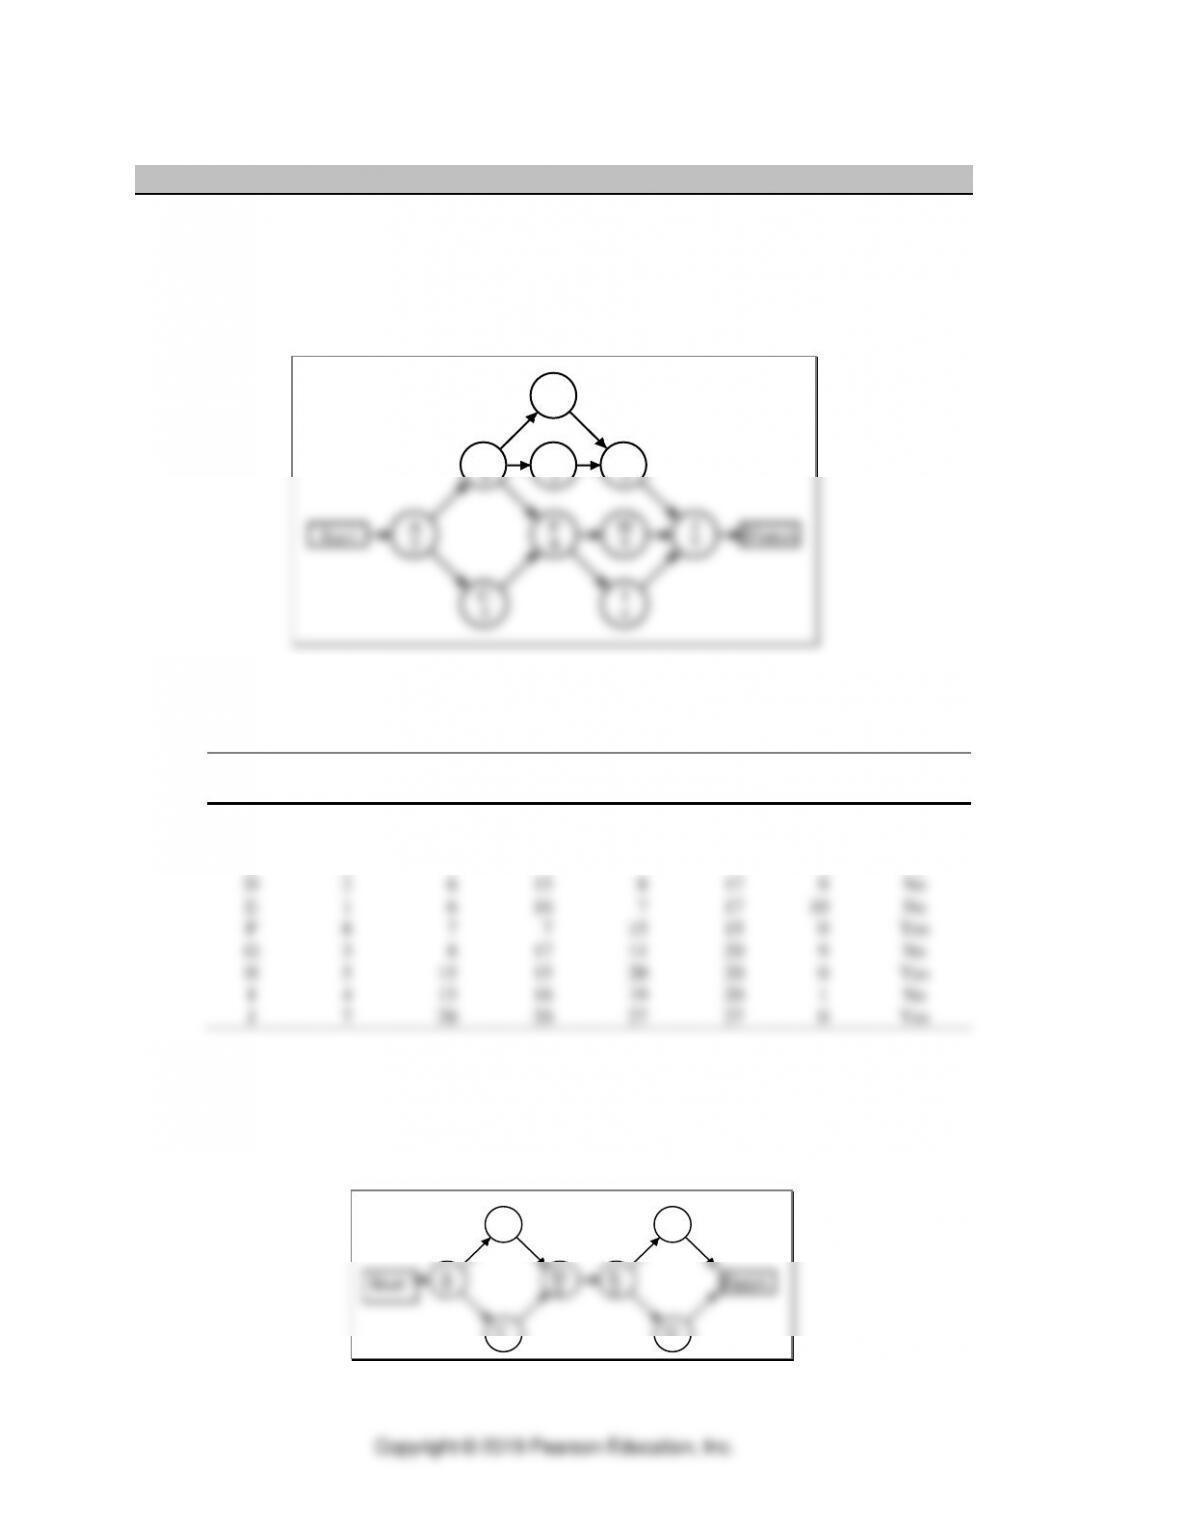
1. Northland Pines High School
a. AON network diagram
D
2
E
1
F
8
G
3
B
4
H
5J
7
I
4
C
5
A
2
Start Finish
b. The critical path is A–C–F–H–J with a completion time of 27 days.
c.
Earliest
Latest
Earliest
Latest
On Critical
Activity
Duration
Start
Start
Finish
Finish
Slack
Path?
A
2
0
0
2
2
0
Yes
B
4
2
3
6
7
1
No
C
5
2
2
7
7
0
Yes
D
2
6
15
8
17
9
No
E
1
6
16
7
17
10
No
F
8
7
7
15
15
0
Yes
G
3
8
17
11
20
9
No
H
5
15
15
20
20
0
Yes
I
4
15
16
19
20
1
No
J
7
20
20
27
27
0
Yes
2. Kids and Tots Apparel
a. AON diagram
D
4
B
2
C
4
A
7
Start
F
3
G
5
E
4 Finish
Project Management ⚫ CHAPTER 7 ⚫
7-3
b. The critical path is A–C–D–E–G with a completion time of 24 days.
Earliest
Latest
Earliest
Latest
On Critical
Activity
Duration
Start
Start
Finish
Finish
Slack
Path?
A
7
0
0
7
7
0
Yes
B
2
7
9
9
11
2
No
C
4
7
7
11
11
0
Yes
D
4
11
11
15
15
0
Yes
E
4
15
15
19
19
0
Yes
F
3
19
21
22
24
2
No
G
5
19
19
24
24
0
Yes
c. Activities B and F are the only ones to have slack.
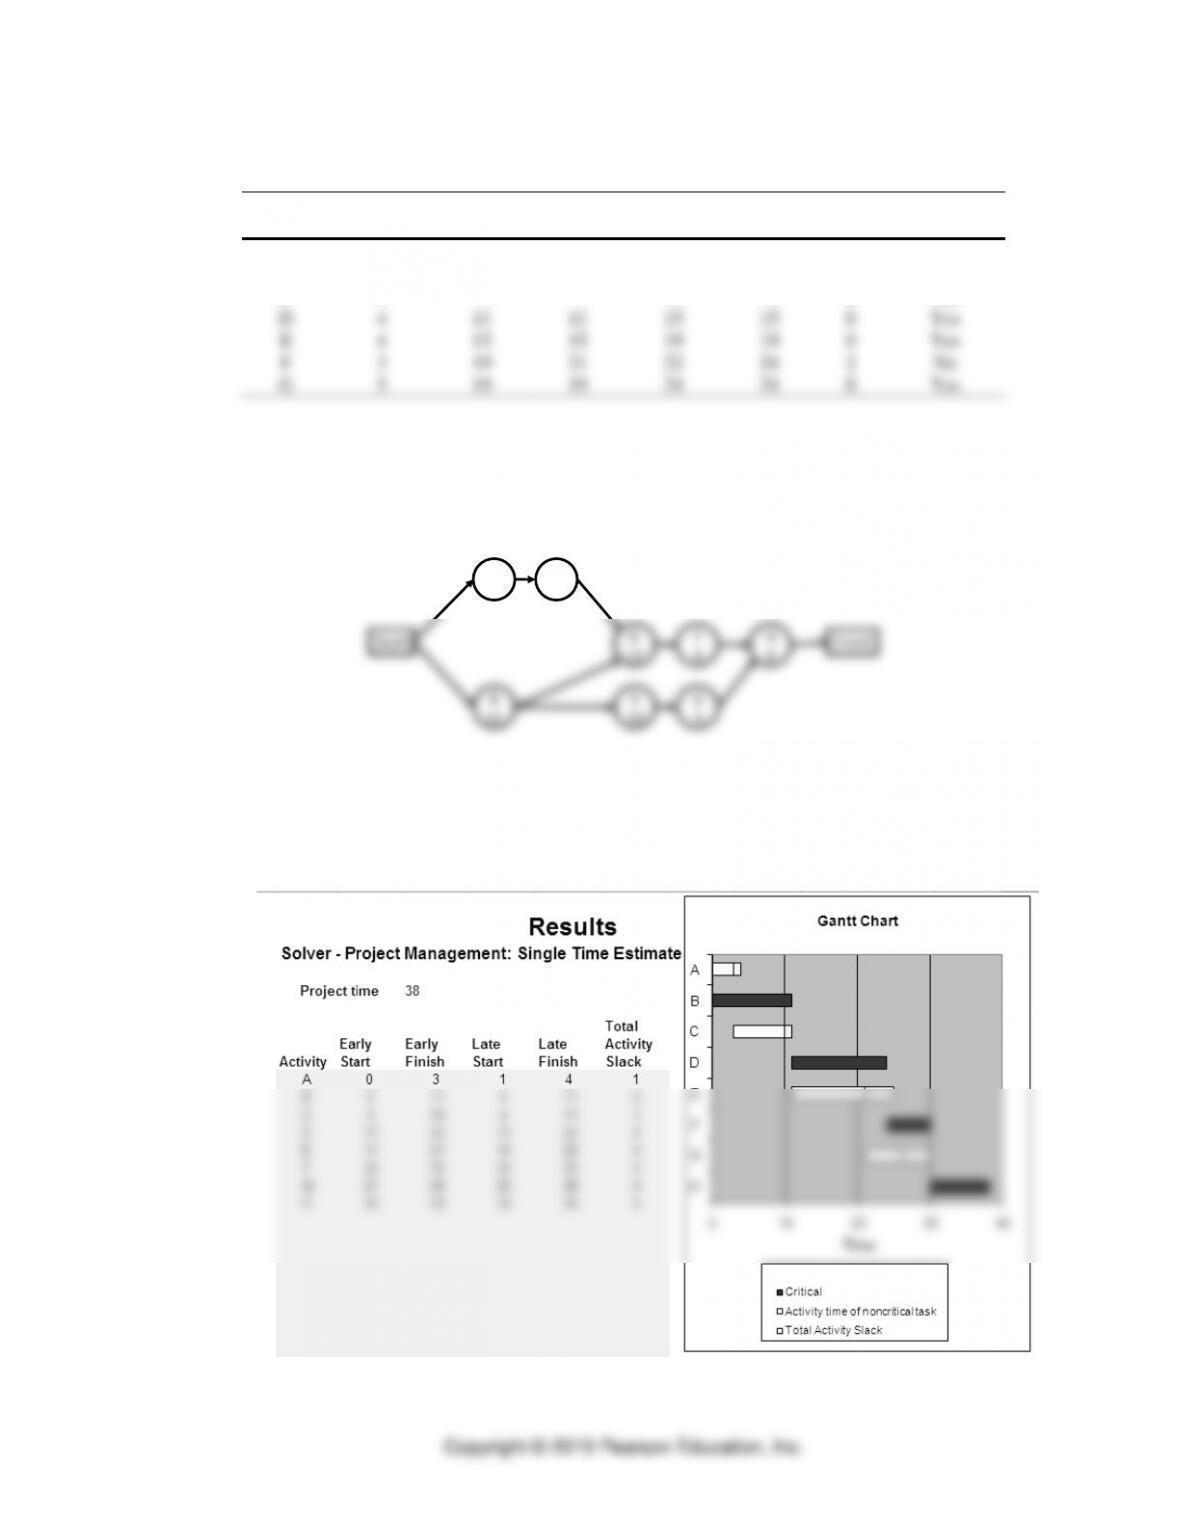
3. Billing process.
a. AON diagram
Start
A
3
C
7
B
11
D
13
F
6
H
8
E
10
G
5
Finish
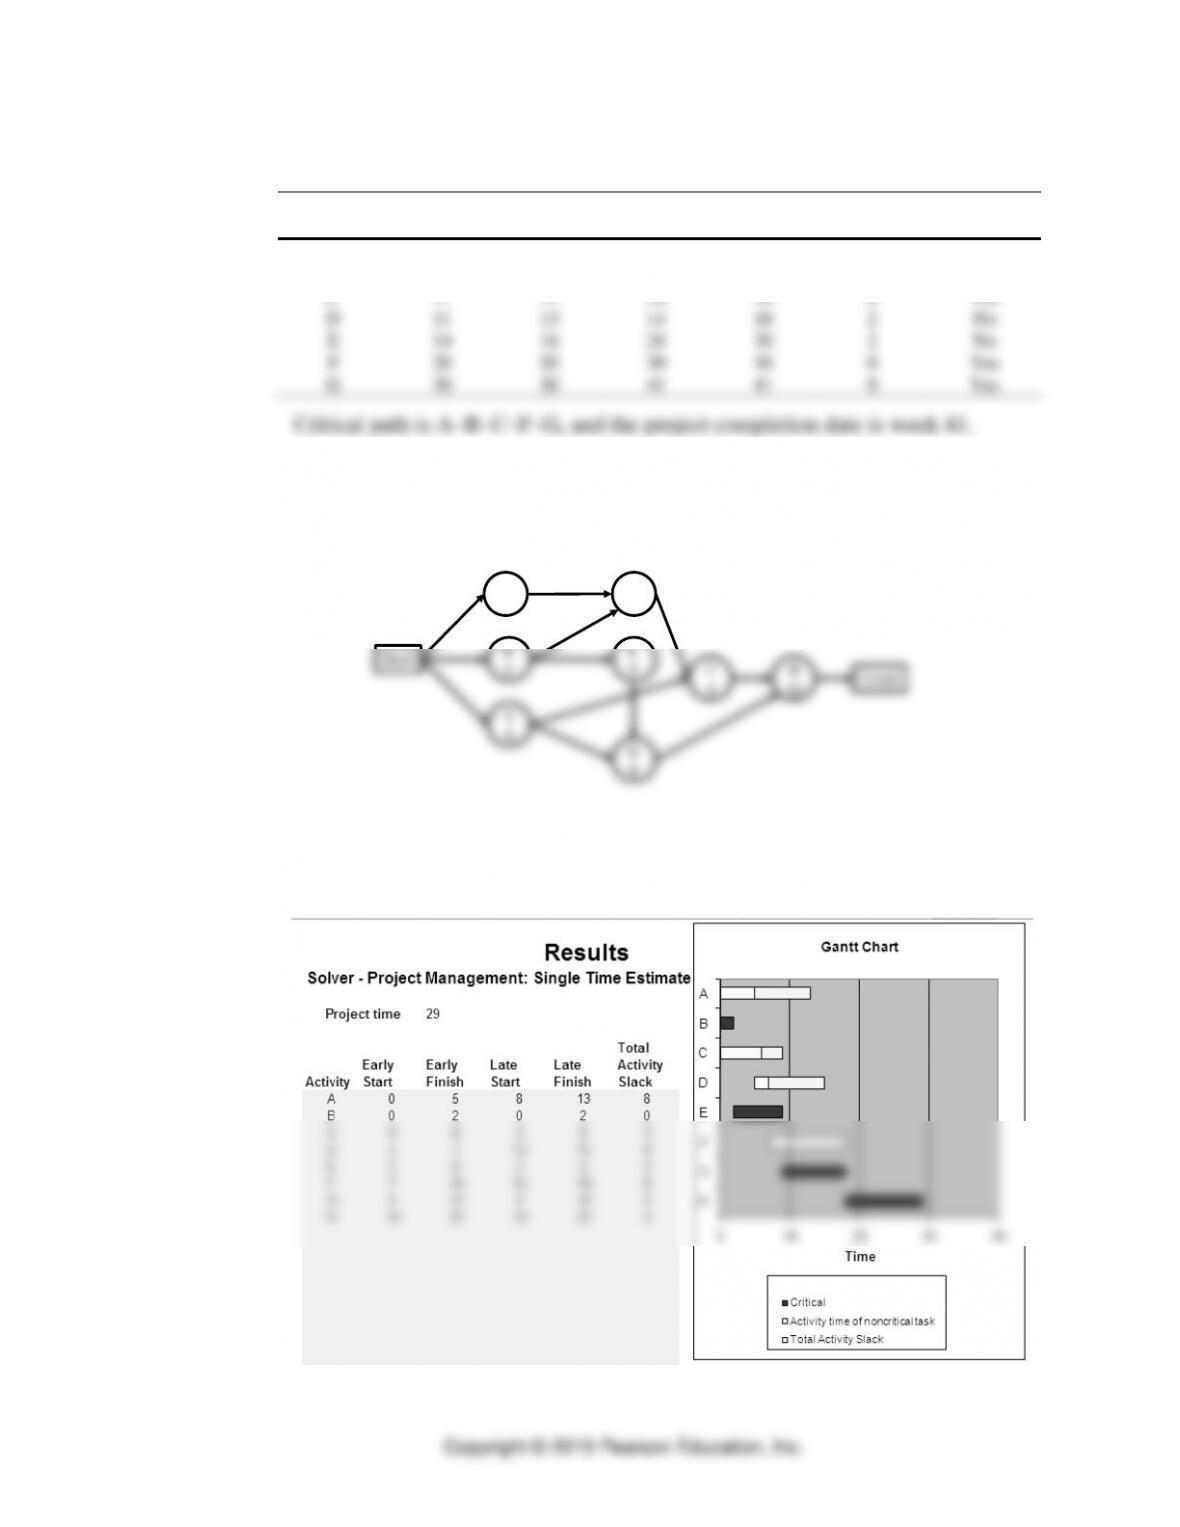
b. The critical path is B-D-F-H with a completion time of 38 weeks. The
computation of slack is provided in the following output from Project
Management Solver of OM Explorer.
Part I Managing Processes
7-4
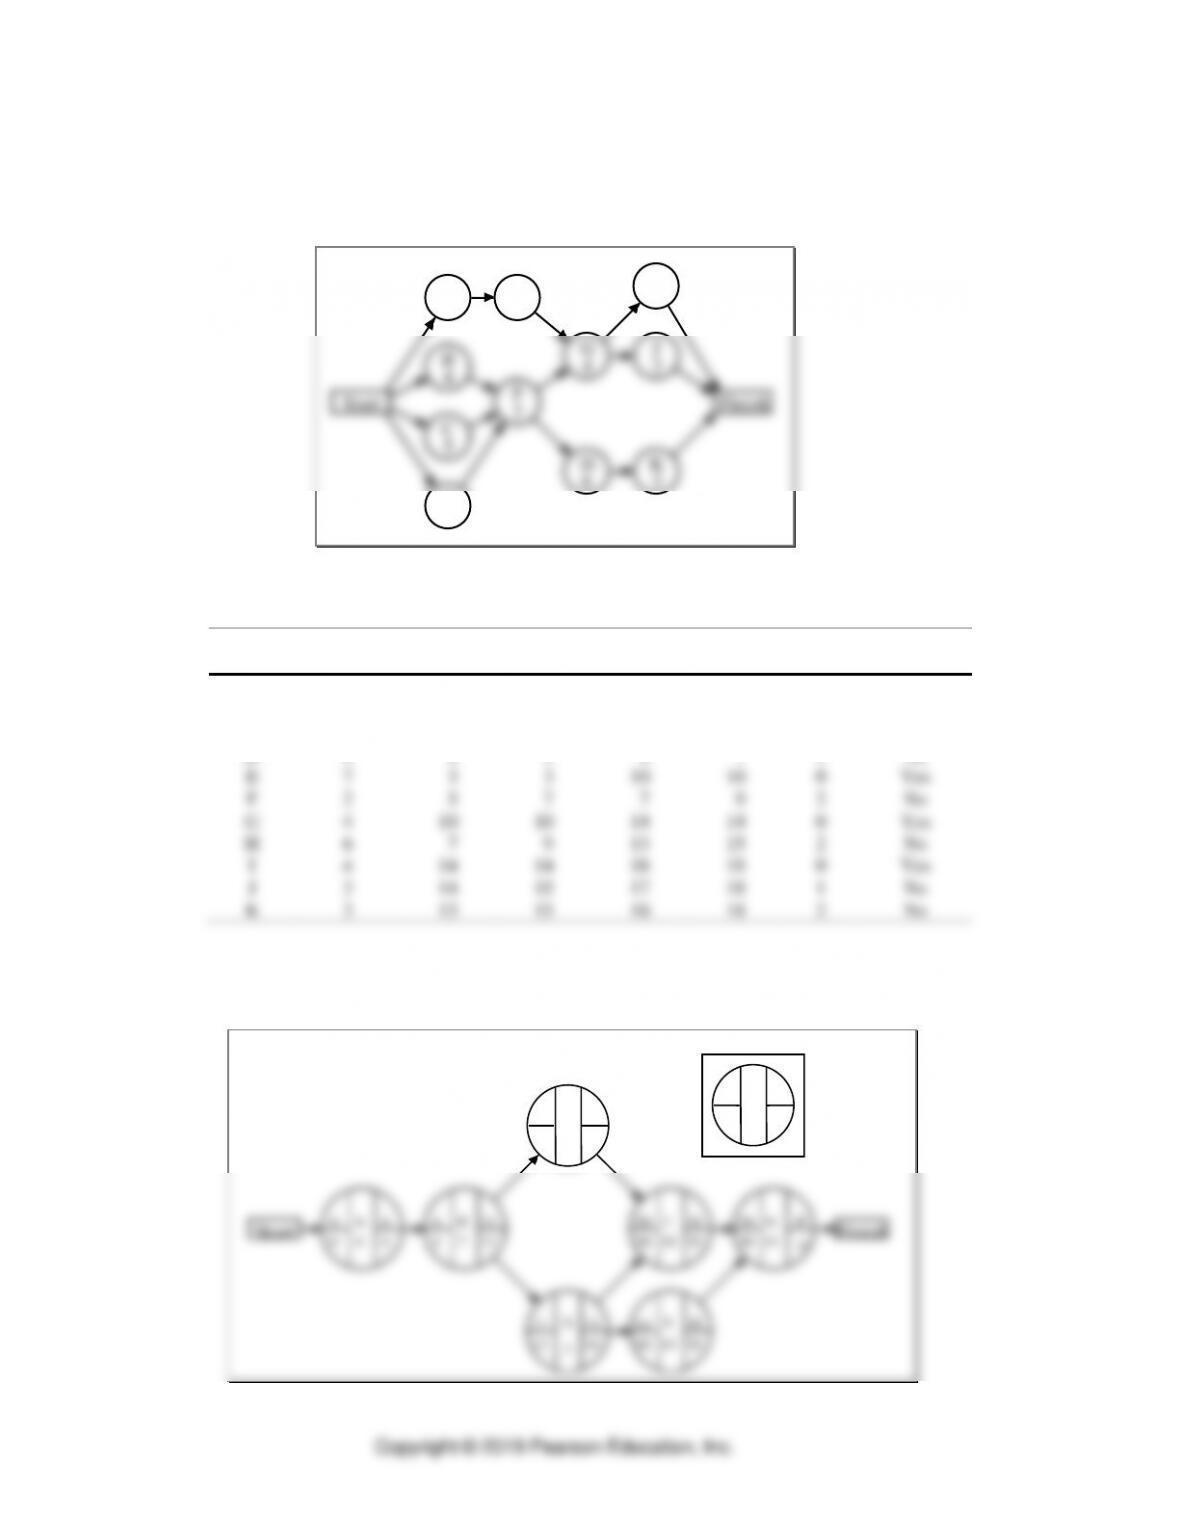
4. Nathan Hale High School
a. AON diagram
F
2
B
4
C
5
G
4
E
7
Finish
Start
J
3
K
3
H
6
D
4
A
3
I
4
b. The critical path is A–E–G–I with a completion time of 18 days.
Earliest
Latest
Earliest
Latest
On Critical
Activity
Duration
Start
Start
Finish
Finish
Slack
Path?
A
3
0
0
3
3
0
Yes
B
4
0
3
4
7
3
No
C
5
0
2
5
7
2
No
D
4
0
3
4
7
3
No
E
7
3
3
10
10
0
Yes
F
2
5
7
7
9
2
No
G
4
10
10
14
14
0
Yes
H
6
7
9
13
15
2
No
I
4
14
14
18
18
0
Yes
J
3
14
15
17
18
1
No
K
3
13
15
16
18
2
No
5. Diamond Manufacturing Inc.
a. The AON network is:
30
30 G
11 41
41
20
20 F
10 30
30
11
11 C
9 20
20
0
0 A
4 4
4 FinishStart 4
4 B
7 11
11
ES
LS ID
DUR
EF
LF
Project Management ⚫ CHAPTER 7 ⚫
7-5
b. Activity slacks for the project:
Start
Finish
Critical
Activity
Earliest
Latest
Earliest
Latest
Slack
Path?
A
0
0
4
4
0
Yes
B
4
4
11
11
0
Yes
C
11
11
20
20
0
Yes
D
11
13
14
16
2
No
E
14
16
28
30
2
No
F
20
20
30
30
0
Yes
G
30
30
41
41
0
Yes
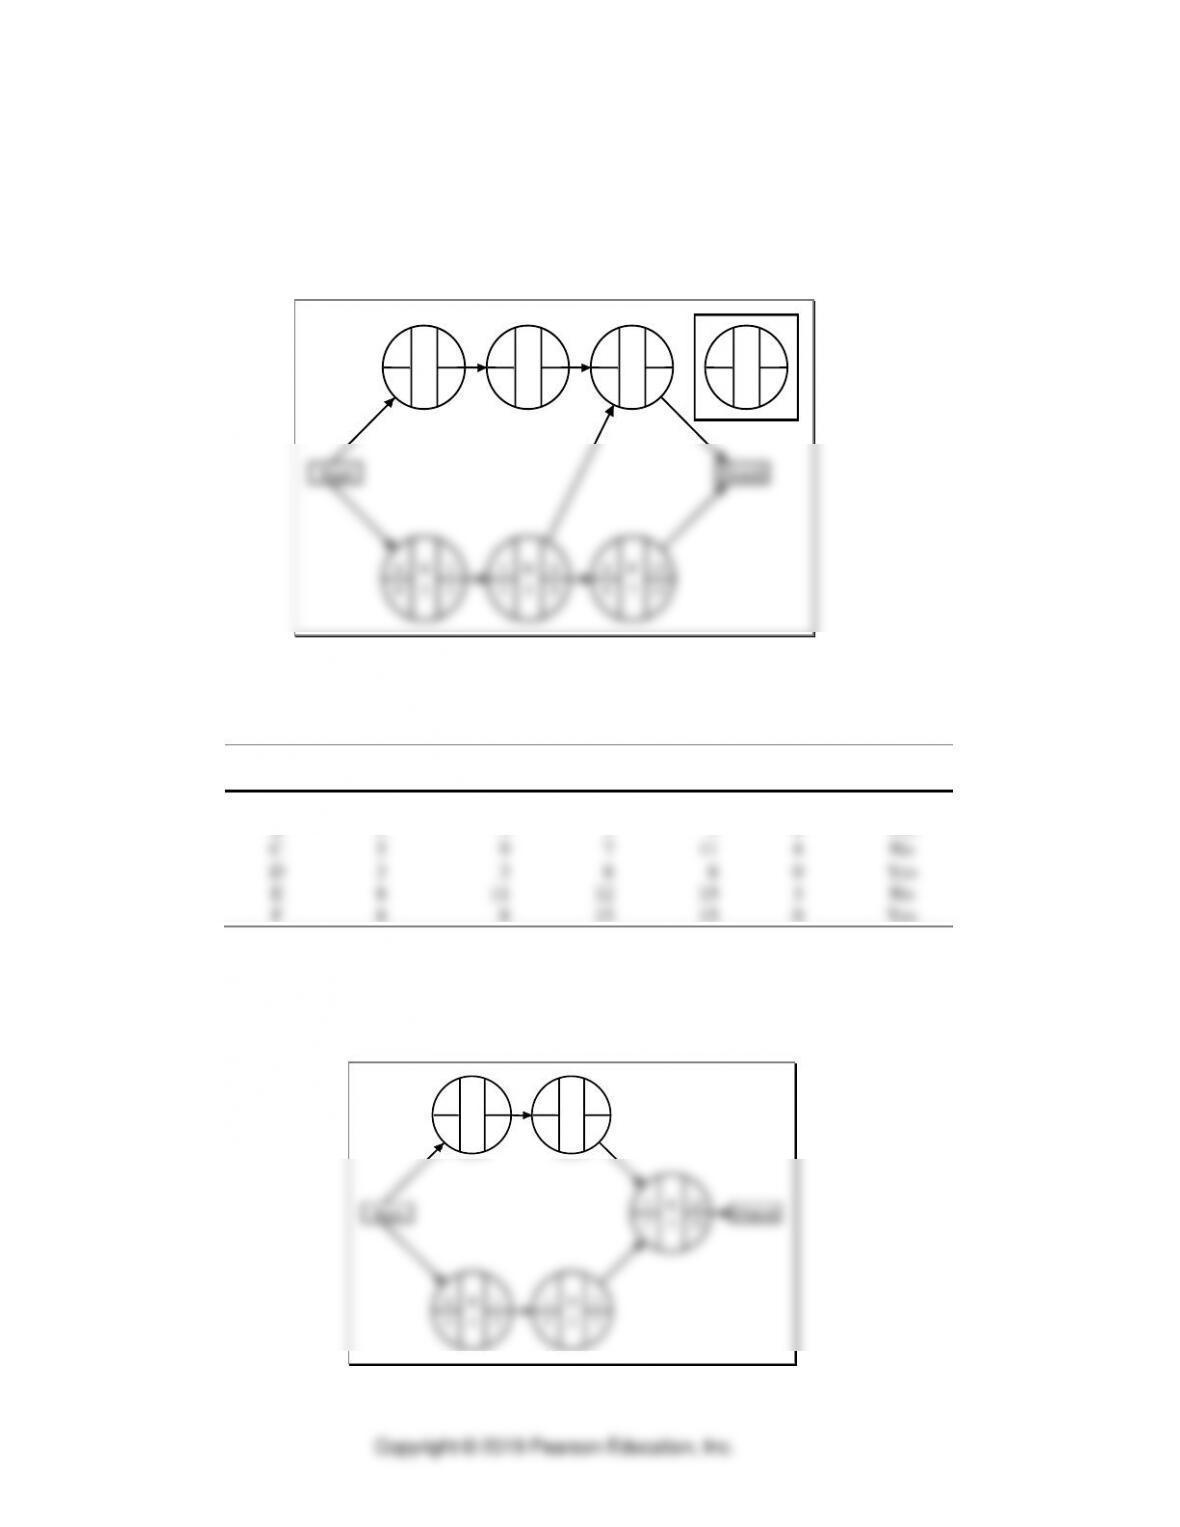
6. Crestview Bank.
a. The AON diagram is:
Start
A
5
C
6
B
2
D
2
F
3
H
11
E
7
G
9
Finish
b. The critical path is B-E-G-H with a completion time of 29 weeks.
c. The computation of slack is provided in the following output from Project
Management Solver of OM Explorer.
Part I Managing Processes
7-6
The slack for activity A = 13 – 5 = 8 weeks.
The slack for activity D = 15 – 7 = 8 weeks.
7. Platinum Financial Advisors
a. The AON diagram is:
0
0
B
3
3
3
0
4
A
5
5
9
5
9
C
2
7
11
Start
ES
LS
ID
DUR
EF
LF
8
11
E
4
12
15
3
3
D
5
8
8
8
8
F
7
15
15
Finish
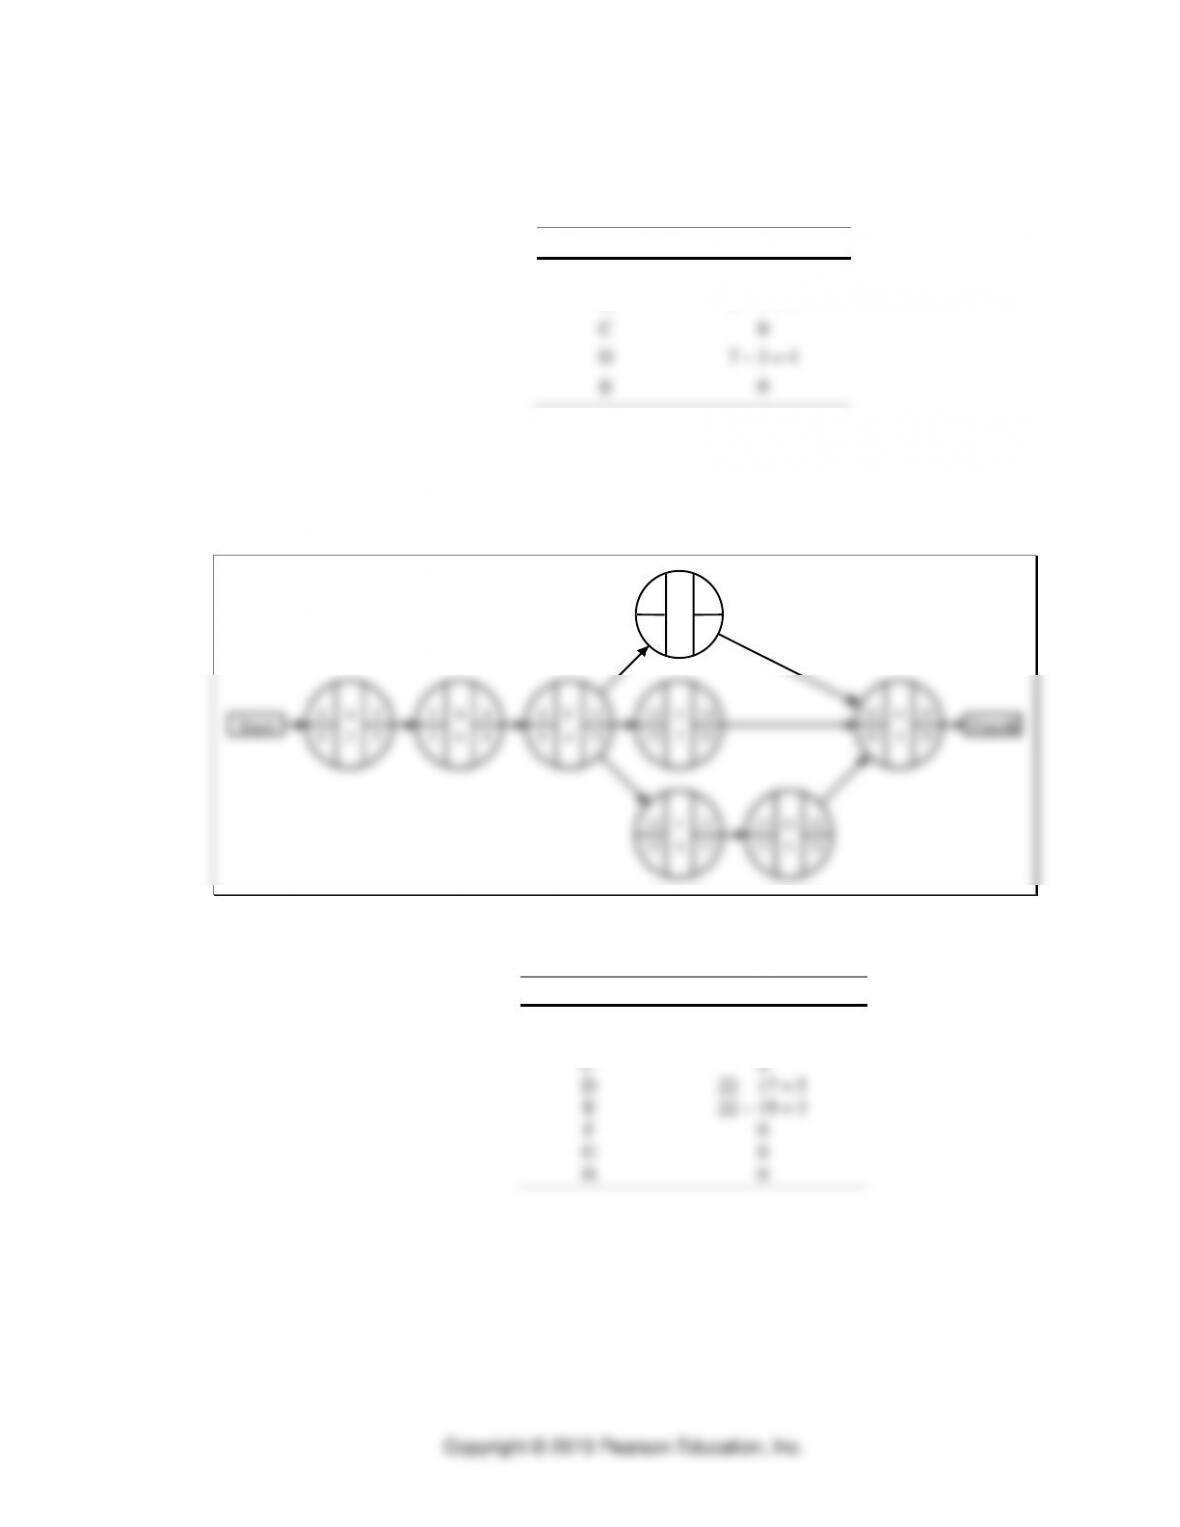
b. Critical path is B–D–F. Expected duration of the project is 15 weeks.
c. Activity slacks for the project are:
Start
Finish
Critical
Activity
Earliest
Latest
Earliest
Latest
Slack
Path?
A
0
4
5
9
4
No
B
0
0
3
3
0
Yes
C
5
9
7
11
4
No
D
3
3
8
8
0
Yes
E
8
11
12
15
3
No
F
8
8
15
15
0
Yes
8. Sculptures International
a. The AON diagram for this project is:
1
5
D
2
3
7
4
4
C
3
7
7
0
4
B
1
1
5
0
0
A
4
4
4
FinishStart 7
7
E
3
10
10
Project Management ⚫ CHAPTER 7 ⚫
7-7
b. The critical path is A–C–E, and the project duration is 10 days.
c.
Activity
Activity Slack
A
0
B
5 – 1 = 4
C
0
D
7 – 3 = 4
E
0
9. Reliable Garage
a. The AON diagram is:
12
12
F
5
17
17
12
17
D
5
17
22
2
2
B
6
8
8
0
0
A
2
2
2
8
8
C
4
12
12 FinishStart 12
15
E
7
19
22
17
17
G
5
22
22
22
22
H
3
25
25
b. Critical Path is A–B–C–F–G–H, and the duration is 25 days.
c.
Activity
Activity Slack
A
0
B
0
C
0
D
22 – 17 = 5
E
22 – 19 = 3
F
0
G
0
H
0
10. Kids Against Crime Foundation
a. The AON diagram is shown below.
Part I Managing Processes
7-8
E
8
I
6
F
13
Finish
Start
A
10
D
5
B
11
C
9
G
5 H
10
J
9
K
11
b. The critical path is B–C–G–H–J–K, and the expected project duration is 55
days.
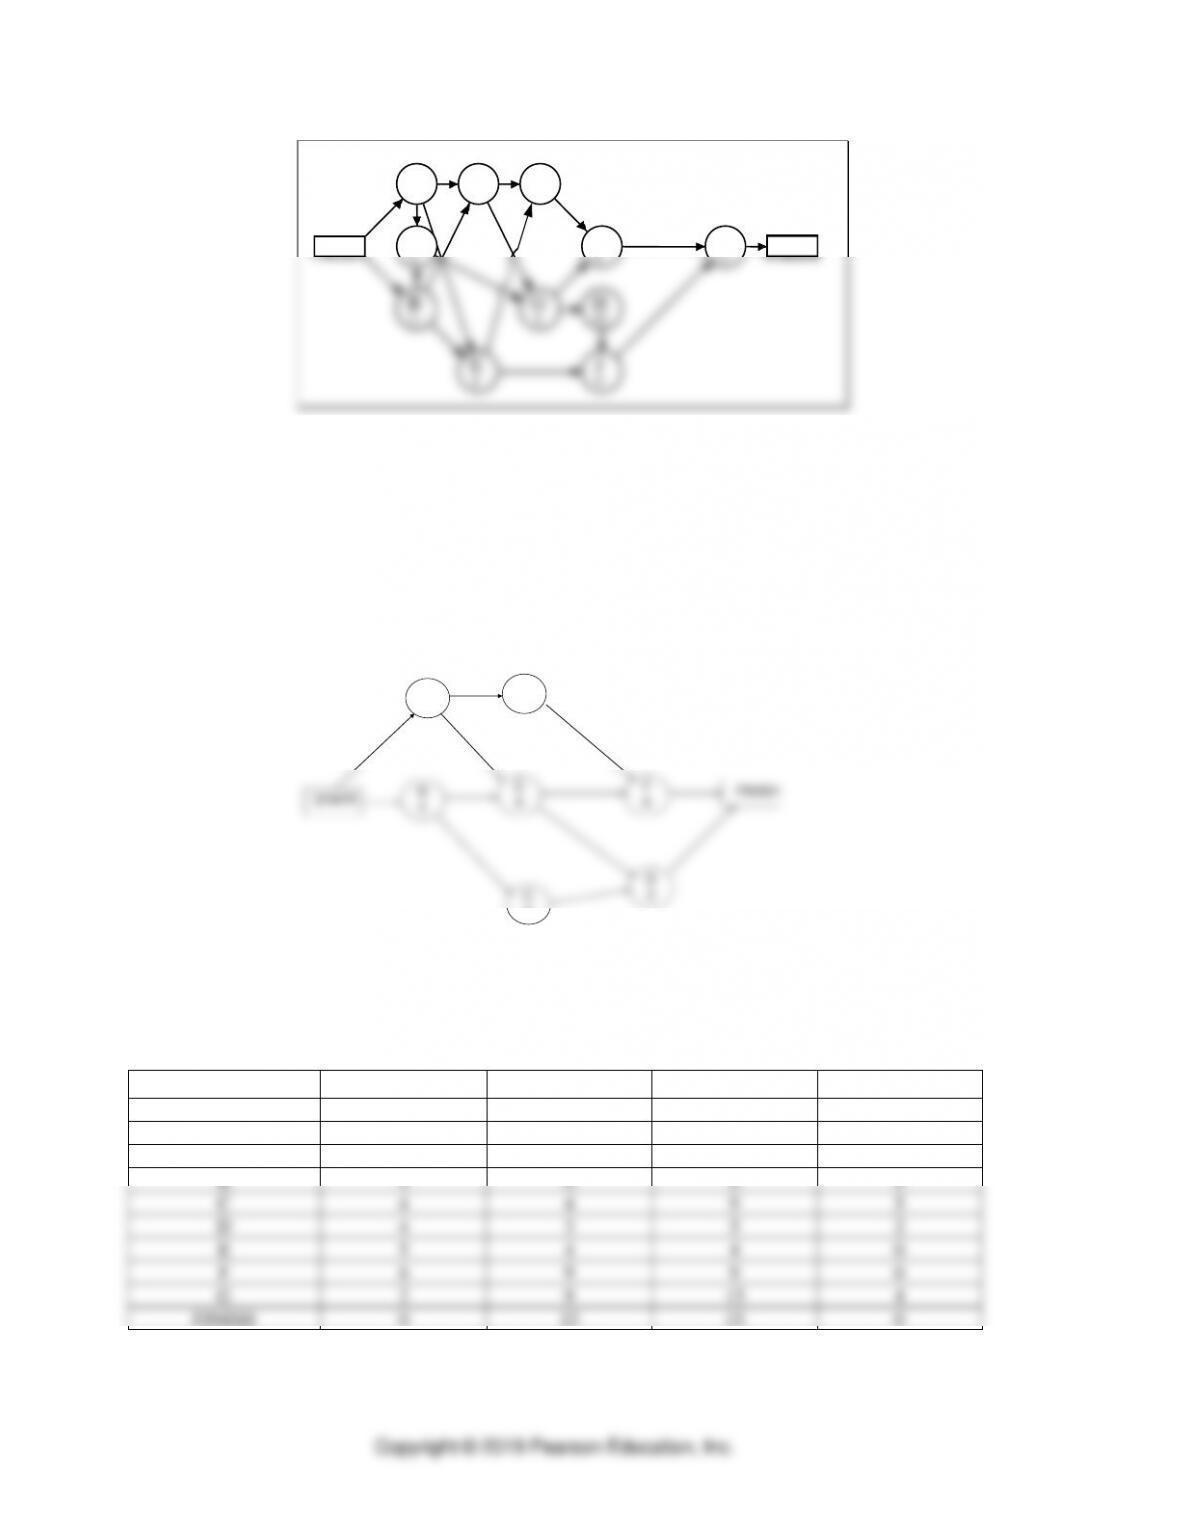
11. GMC Acadia
The AON diagram for the project is below.
B
4
D
4
F
6
A
3
G
2
C
4
E
5
START FINISH
Additional data for the project are contained in the following table.
Activity
Time (weeks)
Early Start
Late Start
Slack
START
0
0
0
0
A
3
0
1
1
B
4
0
0
0
C
4
4
9
5
D
4
3
5
2
E
5
4
4
0
F
6
9
9
0
G
2
9
4
0
0
Project Management ⚫ CHAPTER 7 ⚫
7-9
b. Activity G is on a path with 4 weeks of slack; however each week Employee A
Analyzing Cost–Time Trade-offs
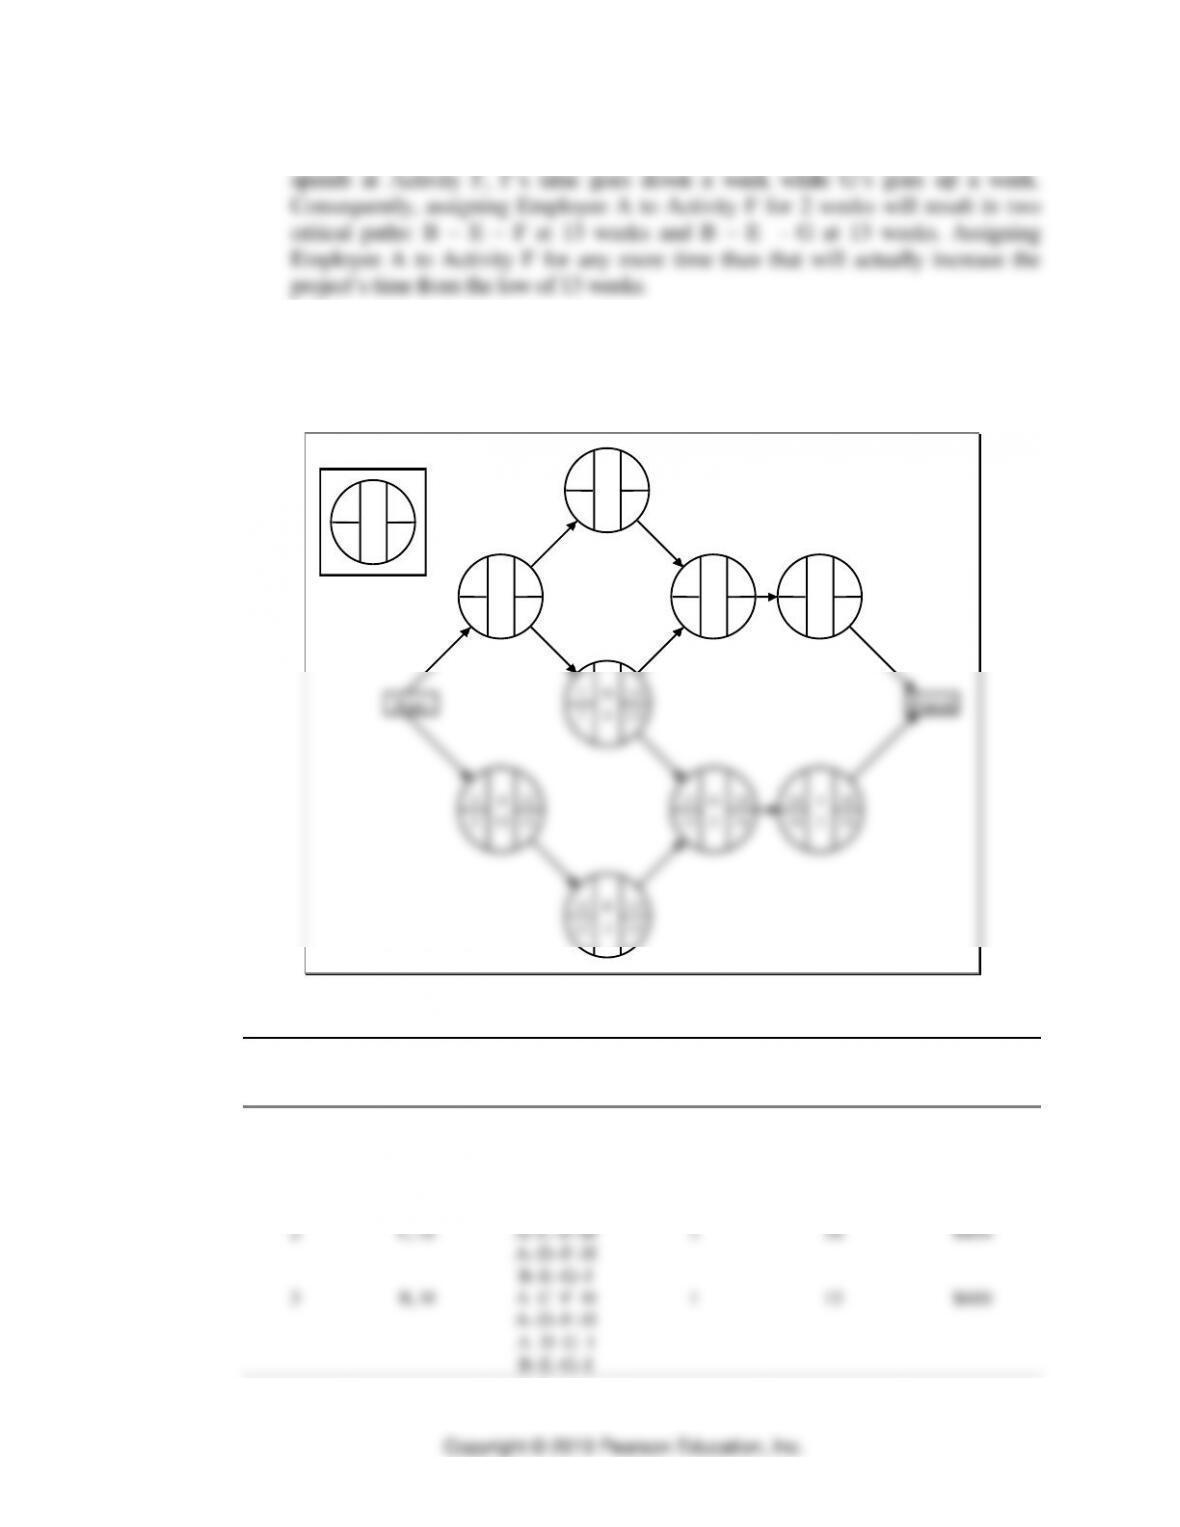
12. AON Diagram for the environmental project:
13
13
G
3
16
16
14
14
F
1
15
15
12
12
E
1
13
13
7
7
D
6
13
13
7
7
C
7
14
14
0
0
B
12
12
12
0
0
A
7
7
7
15
15
H
3
18
18
Start
ES
LS
ID
DUR
EF
LF
16
16
I
2
18
18
Finish
Resulting
Time
Project
Crash
Critical
Reduction
Duration
Crash
Trial
Activity
Path
(weeks)
(weeks)
Cost
0
—
A–C–F–H
—
18
0
A–D–G–I
B–E–G–I
1
A, G
A–C–F–H
1
17
$400
B–E–G–I
2
C, G
A–C–F–H
1
16
$450
A–D–F–H
B–E–G–I
3
B, H
A–C–F–H
1
15
$600
A–D–F–H
A–D–G–I
Part I Managing Processes
7-10
Total crash costs = $1450
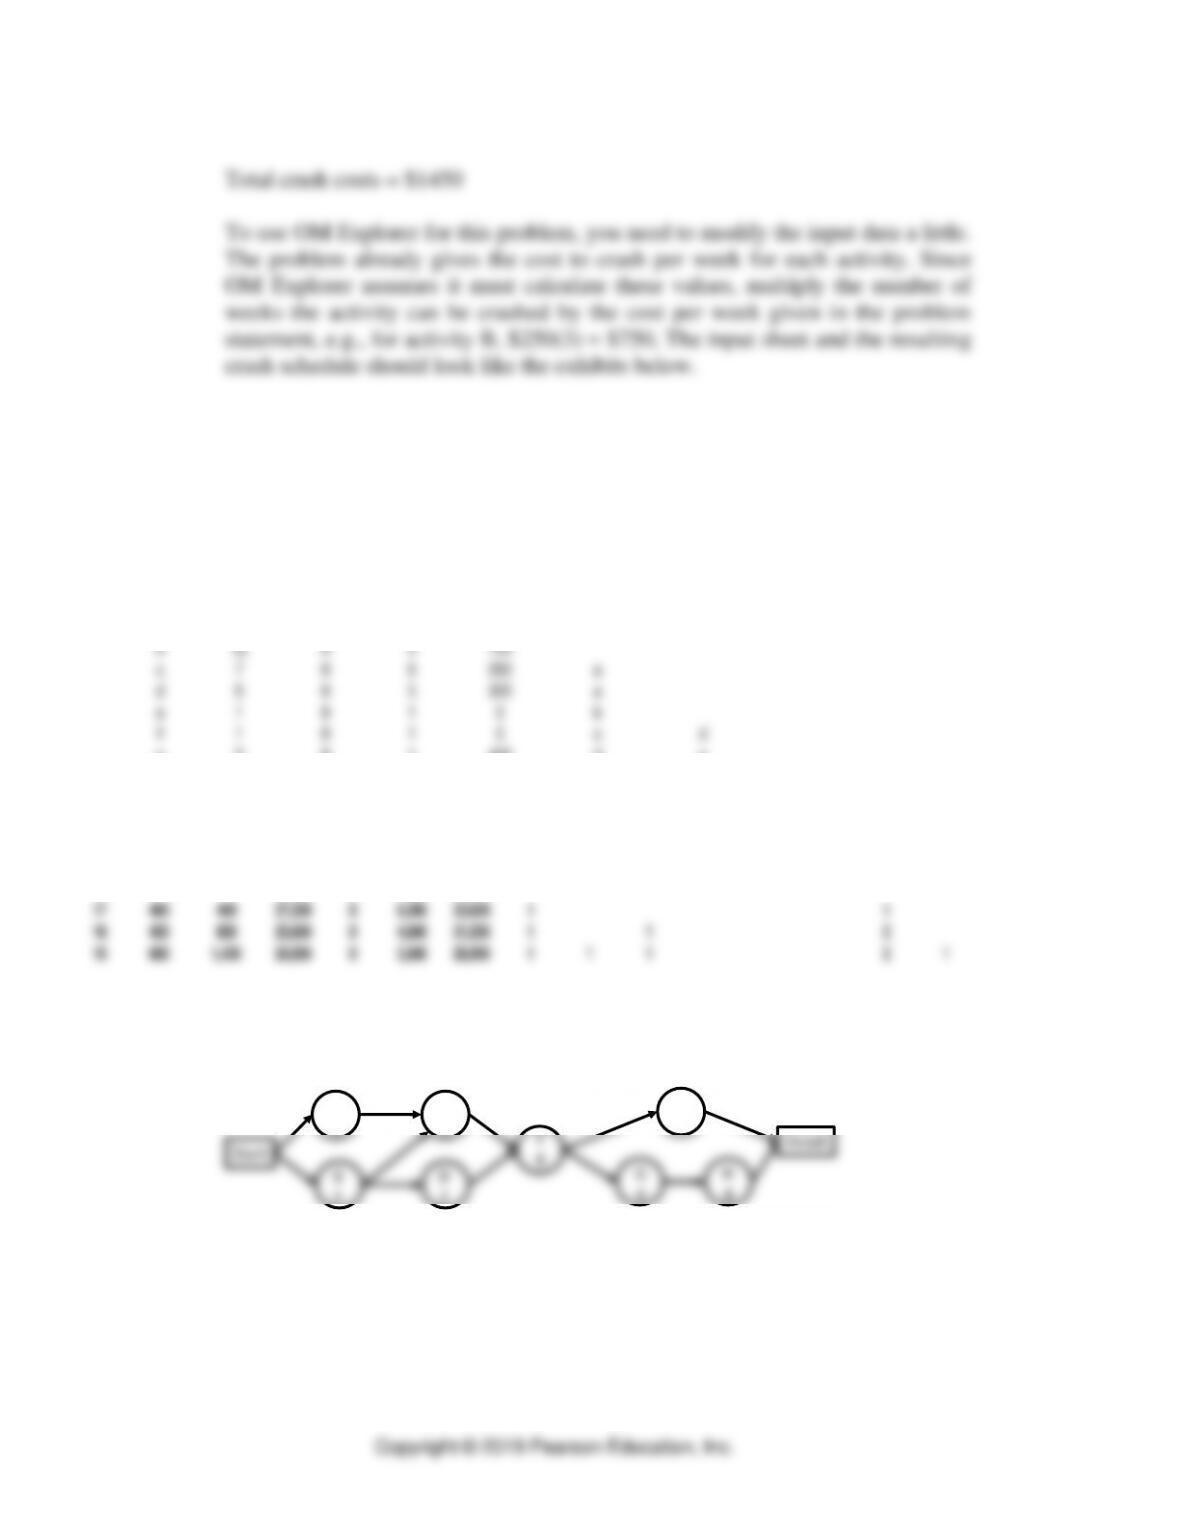
To use OM Explorer for this problem, you need to modify the input data a little.
The problem already gives the cost to crash per week for each activity. Since
OM Explorer assumes it must calculate these values, multiply the number of
weeks the activity can be crashed by the cost per week given in the problem
statement, e.g., for activity B, $250(3) = $750. The input sheet and the resulting
crash schedule should look like the exhibits below.
Solver – Crashing
Enter data in yellow shaded areas.
Indirect cost 1,600$ per week
Penalty cost 1,200$ per week after week 12
Activity
Normal
Time
Normal
Cost
Crash Time Crash Cost Precedence 1 Precedence 2 Precedence 3 Precedence 4
a 7 0 6 200
b12 0 9 750
c 7 0 6 250 a
d 6 0 5 300 a
e 1 0 1 0 b
f 1 0 1 0 c d
g 3 0 1 400 d e
CRASH SCHEDULE
(Reduction in Time Periods)
Time
Period
crash
cost
Cumulative
crash cost
Indirect
costs
Direct
costs
Penalty
costs
Total
costs
a b c d e f g h i
18 28,800 07,200 36,000
17 400 400 27,200 06,000 33,600 1 1
16 450 850 25,600 04,800 31,250 1 1 2
15 600 1,450 24,000 03,600 29,050 1 1 1 2 1
13. Advanced Tech
a. The AON diagram, with all task durations at Normal Time, for the project is:
Start
A
6
F
2
B
4
C
3E
6
G
4
D
2
H
4
Finish
The critical path is A-C-E-G-H and the project duration is 23 days.
b. The computation of minimum-cost schedule is provided in the following output
from POM for Windows software.
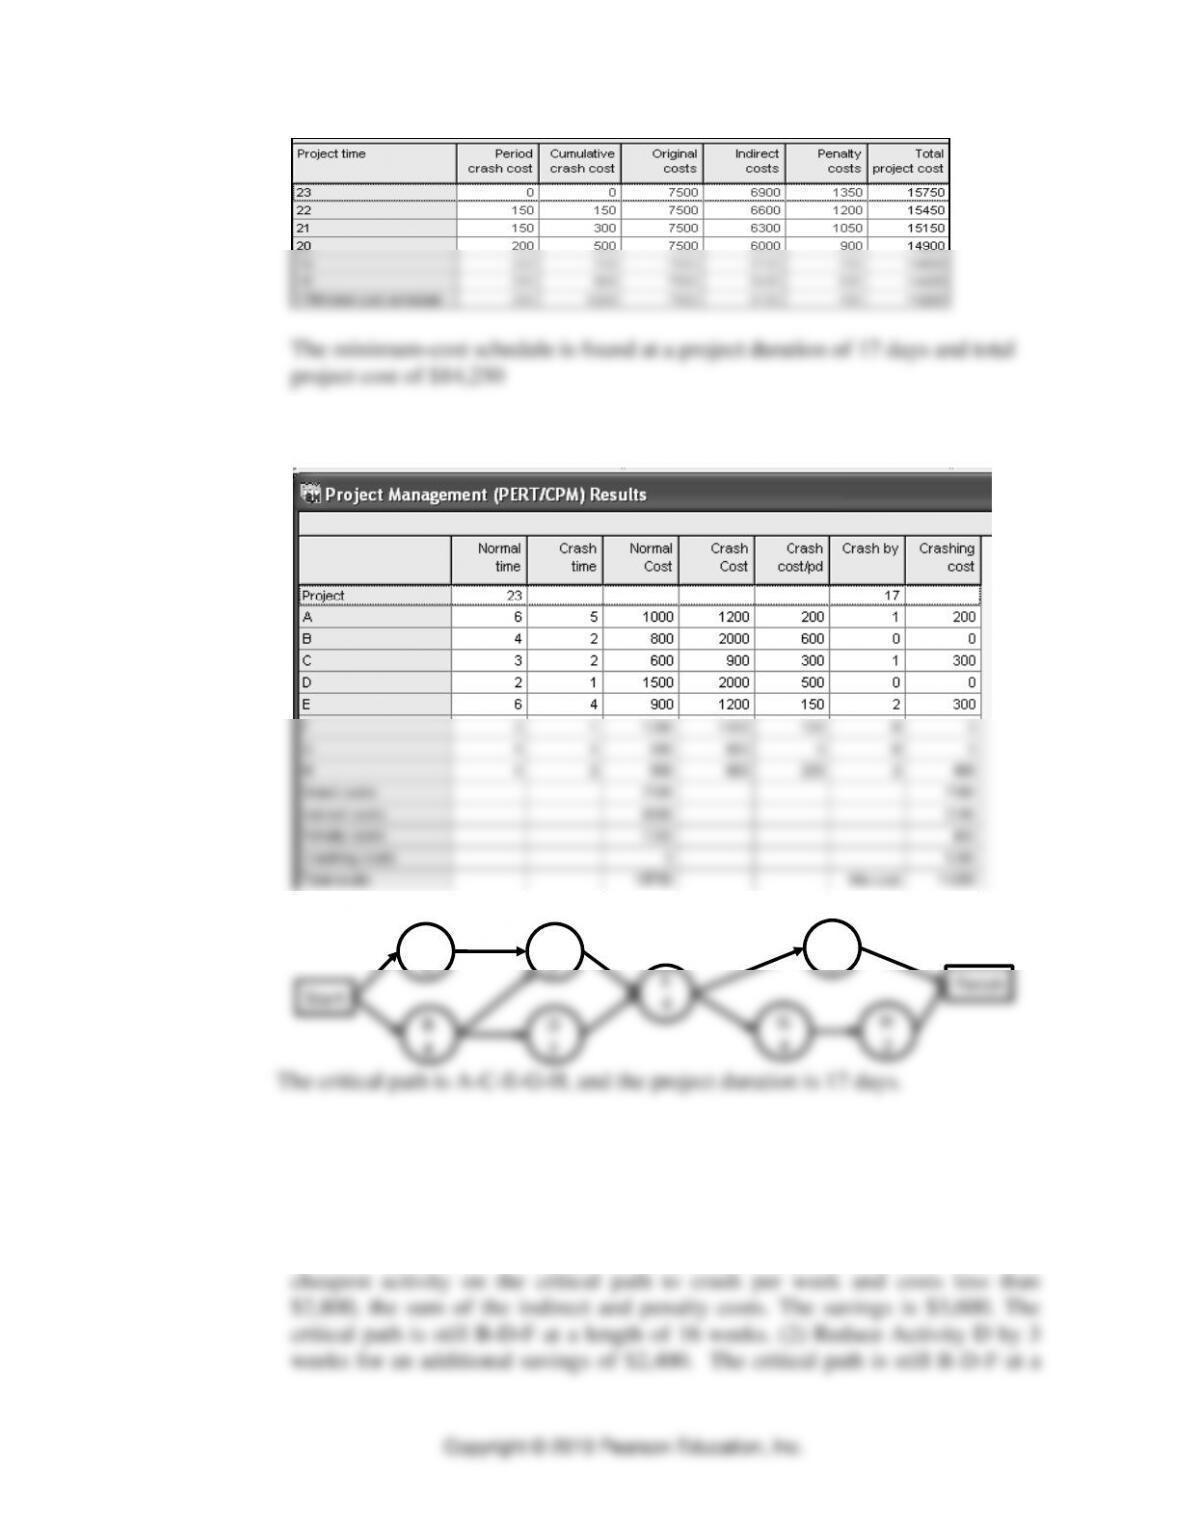
Project Management ⚫ CHAPTER 7 ⚫
7-11
c. The activities crashed to arrive at the minimum-cost schedule are provided in the
following output from POM for Windows software.
Start
A
5
F
2
B
4
C
2E
4
G
4
D
2
H
2
Finish
The critical path is A-C-E-G-H, and the project duration is 17 days.
14. Billing process.
a. The critical path at the start is B-D-F at a duration of 18 weeks. We proceed as
follows: (1) Crash Activity B to its maximum reduction because it is the
Part I Managing Processes
7-12
duration of 13 weeks. No further reductions will lower total costs because the
cost to crash the other activities (that is, Activity F) exceeds the potential
reduction in indirect costs. Therefore, the minimum-cost schedule is 13 weeks.
b. The “normal” direct cost is $31,000, the “normal” indirect costs are $28,800, the
15. Excello Corporation.
a. The shortest project duration time would be 7 weeks (path B-D-F), using the
crash times.
b. AON diagram with all task durations at Normal Time
Start
A
2
G
3
B
2
C
3
E
1
F
5
D
3
Finish
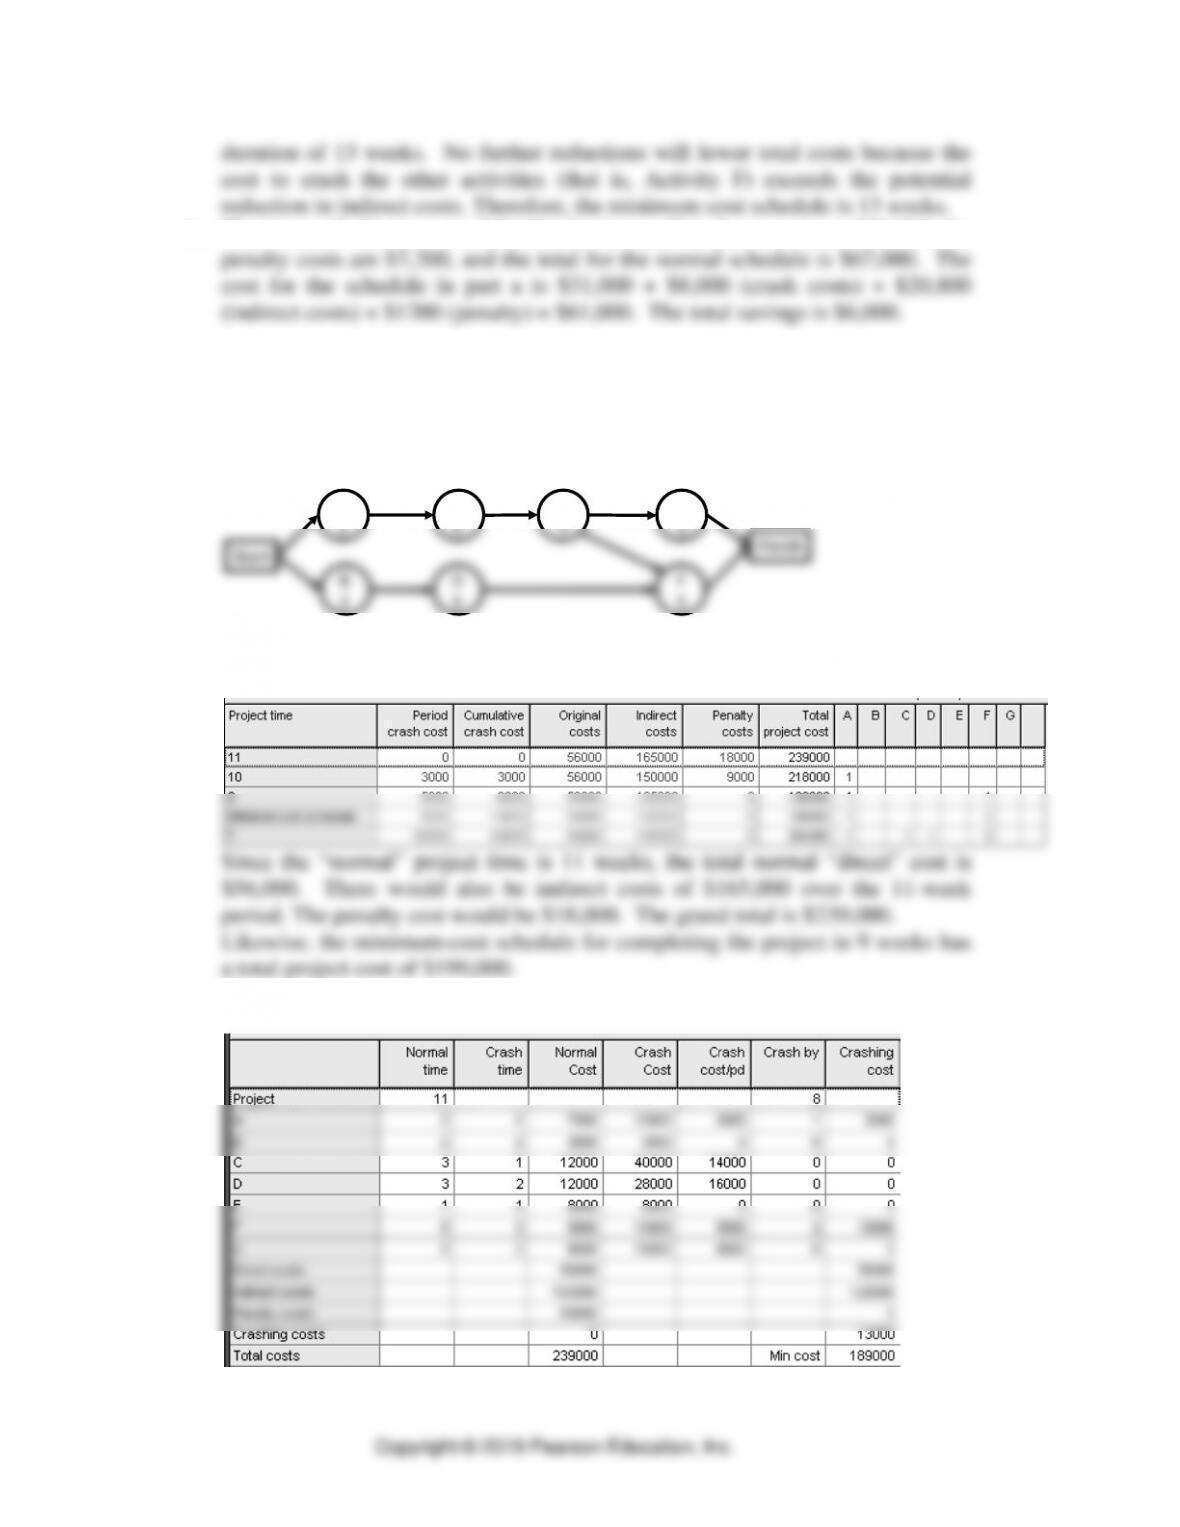
The critical path is A-C-E-F with a project completion time of 11 weeks. The
computation of minimum-cost schedule is provided in the following output from
POM for Windows software.
c. The crashing required to arrive at the minimum-cost schedule is provided in the
following output from POM for Windows software.
Project Management ⚫ CHAPTER 7 ⚫
7-13
The minimum-cost schedule would take 8 weeks. This can be found in the
following way: (1) the starting critical path is A-C-E-F at 11 weeks. Since
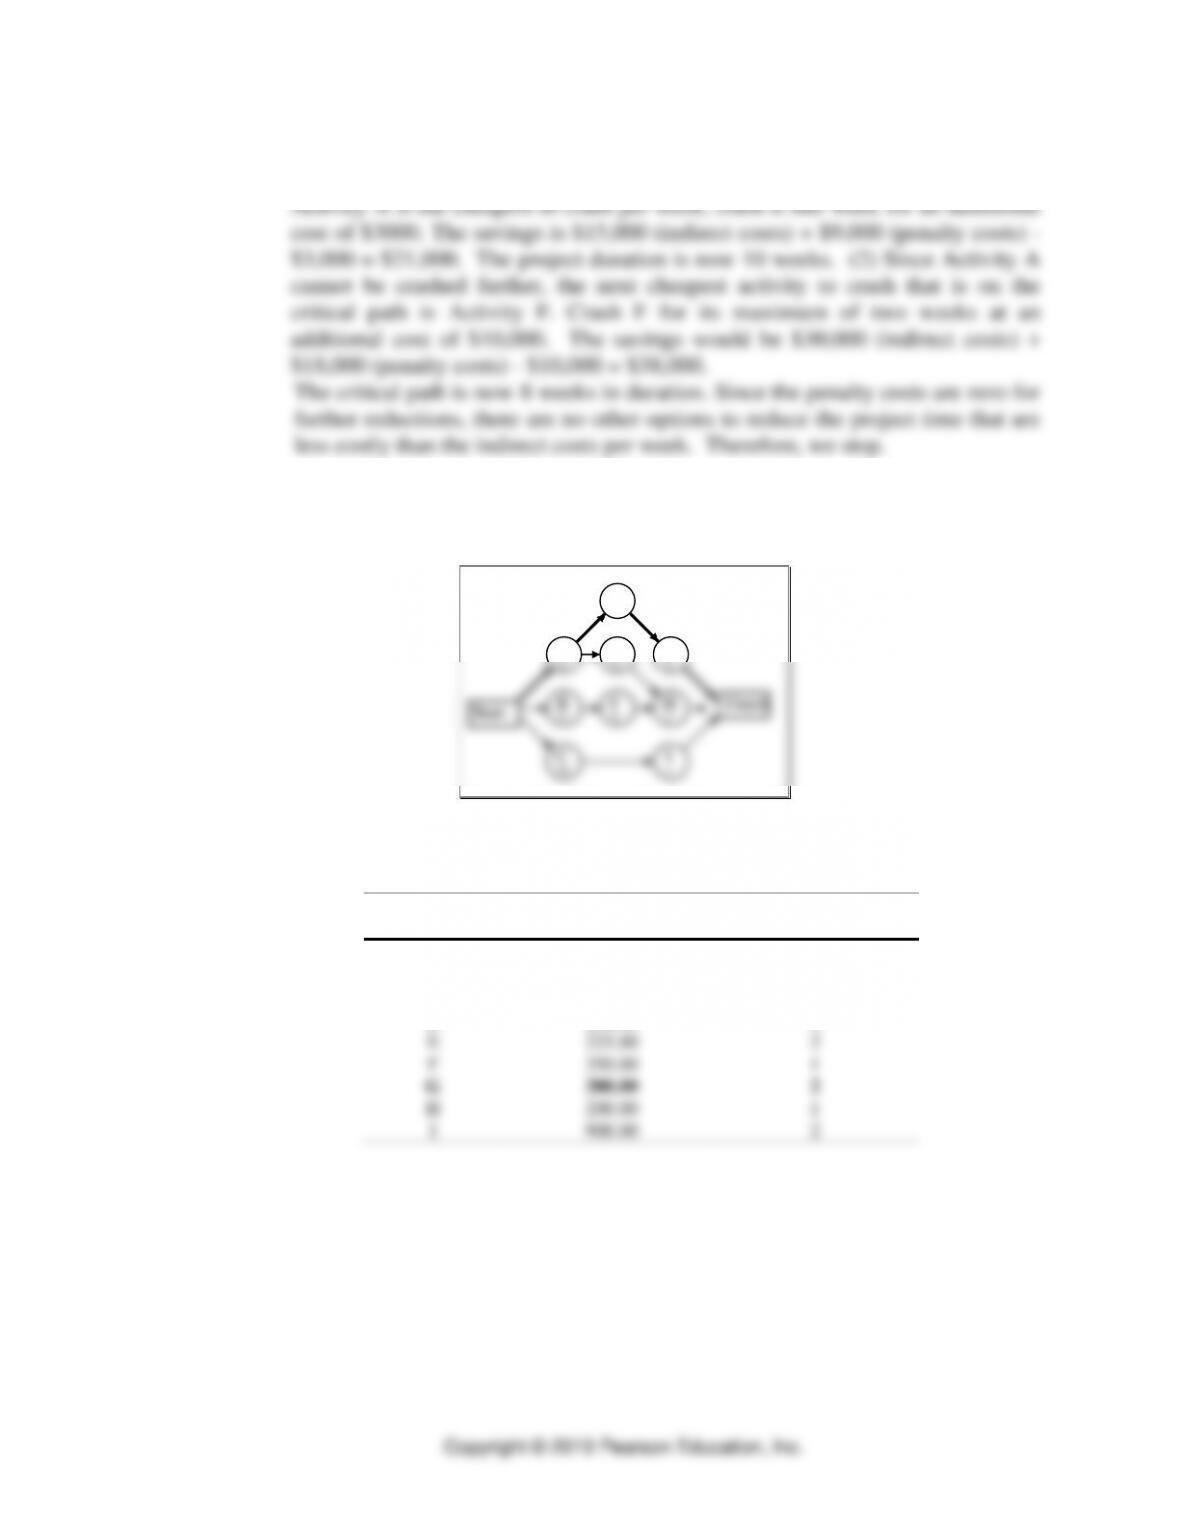
16. Kitty Condo
An AON diagram using the Alternative 1 (or “normal”) times follows.
D
9
H
2
I
4
G
8
Start
A
12
B
13
C
18
E
12
F
8
Finish
The critical path is A–D–G, and the project duration is 29 days.
Direct cost and time data:
Maximum Crash
Activity
Crash Cost/Day
Time (days)
A
$600.00
1
B
112.50
4
C
750.00
2
D
250.00
4
E
225.00
2
F
350.00
1
G
200.00
2
H
200.00
1
I
900.00
2
Part I Managing Processes
7-14
Cost analysis for the project:
Resulting
Time
Project
Crash
Critical
Reduction
Duration
Crash
Trial
Activity
Path
(weeks)
(weeks)
Cost
0
—
A–D–G
–
29
—
1
G
A–D–G
2
27
400
2
D
A–D–G
A–E–H
1
26
250
3
D, H
A–D–G
1
25
450
A–E–H
The total cost for this project is:
$13,050 + $400 + $250 + $450 = $14,150.00
The activity times with crashing are:
A: 12 B: 13 C: 18 D: 7 E: 12
F: 8 G: 6 H: 1 I: 4
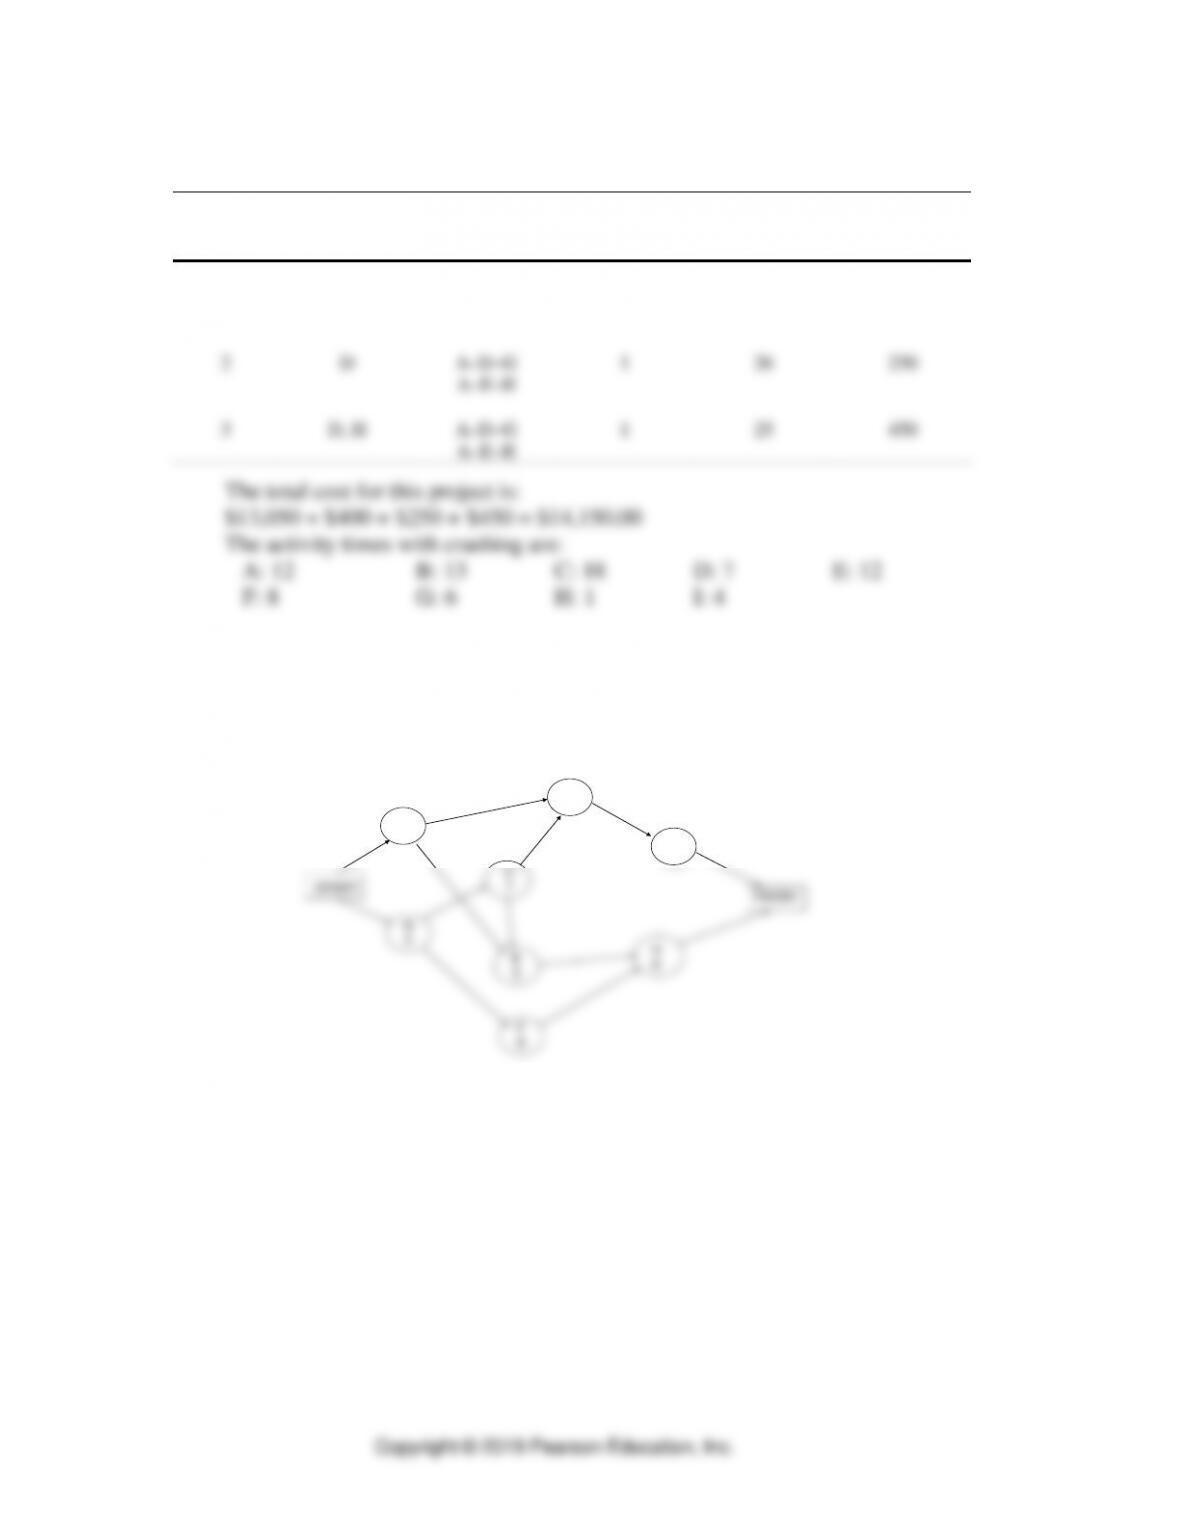
17. Community Center
The AON diagram for the community center project is below.
.
D
2
C
7
A
10 G
5
B
4
F
8
E
3
H
6
START FINISH
Project Management ⚫ CHAPTER 7 ⚫
7-15
The crashing data are given in the following table.
Normal
Crash
Maximum
Activity
Time (days)
Cost ($)
Time (days)
Cost ($)
Reduction
$ per Day
START
0
0
0
0
——
——-
A
10
50
8
150
2
50
B
4
40
2
200
2
80
C
7
70
6
160
1
90
D
2
20
1
50
1
30
E
3
30
NONE
NONE
NONE
NONE
F
8
80
5
290
3
70
G
5
50
4
180
1
130
H
6
60
3
180
3
40
FINISH
0
0
0
0
——
——
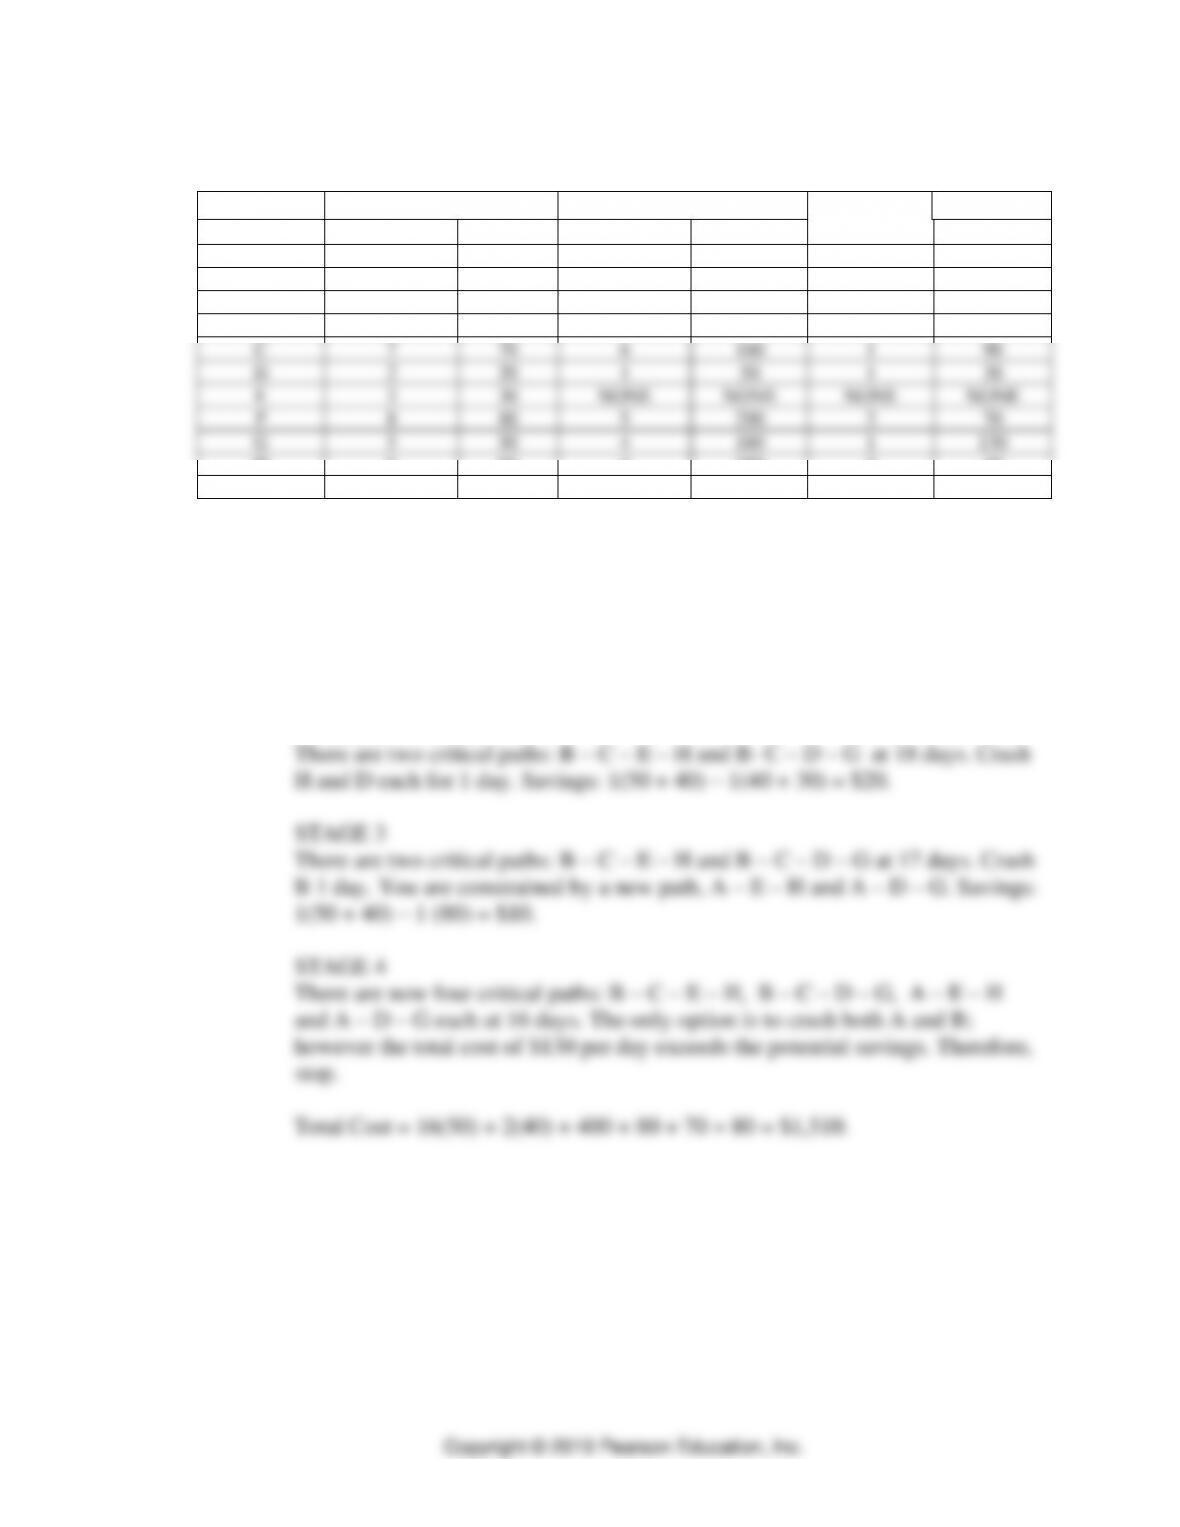
a. The critical path is B – C – E – H at 20 days.
b. STAGE 1
Critical path is B – C – E – H at 20 days. Crash H for 2 days. You are stopped
by path B – C – D – G.
Savings: 2 (50 + 40) – 2 (40) = $100.
STAGE 2
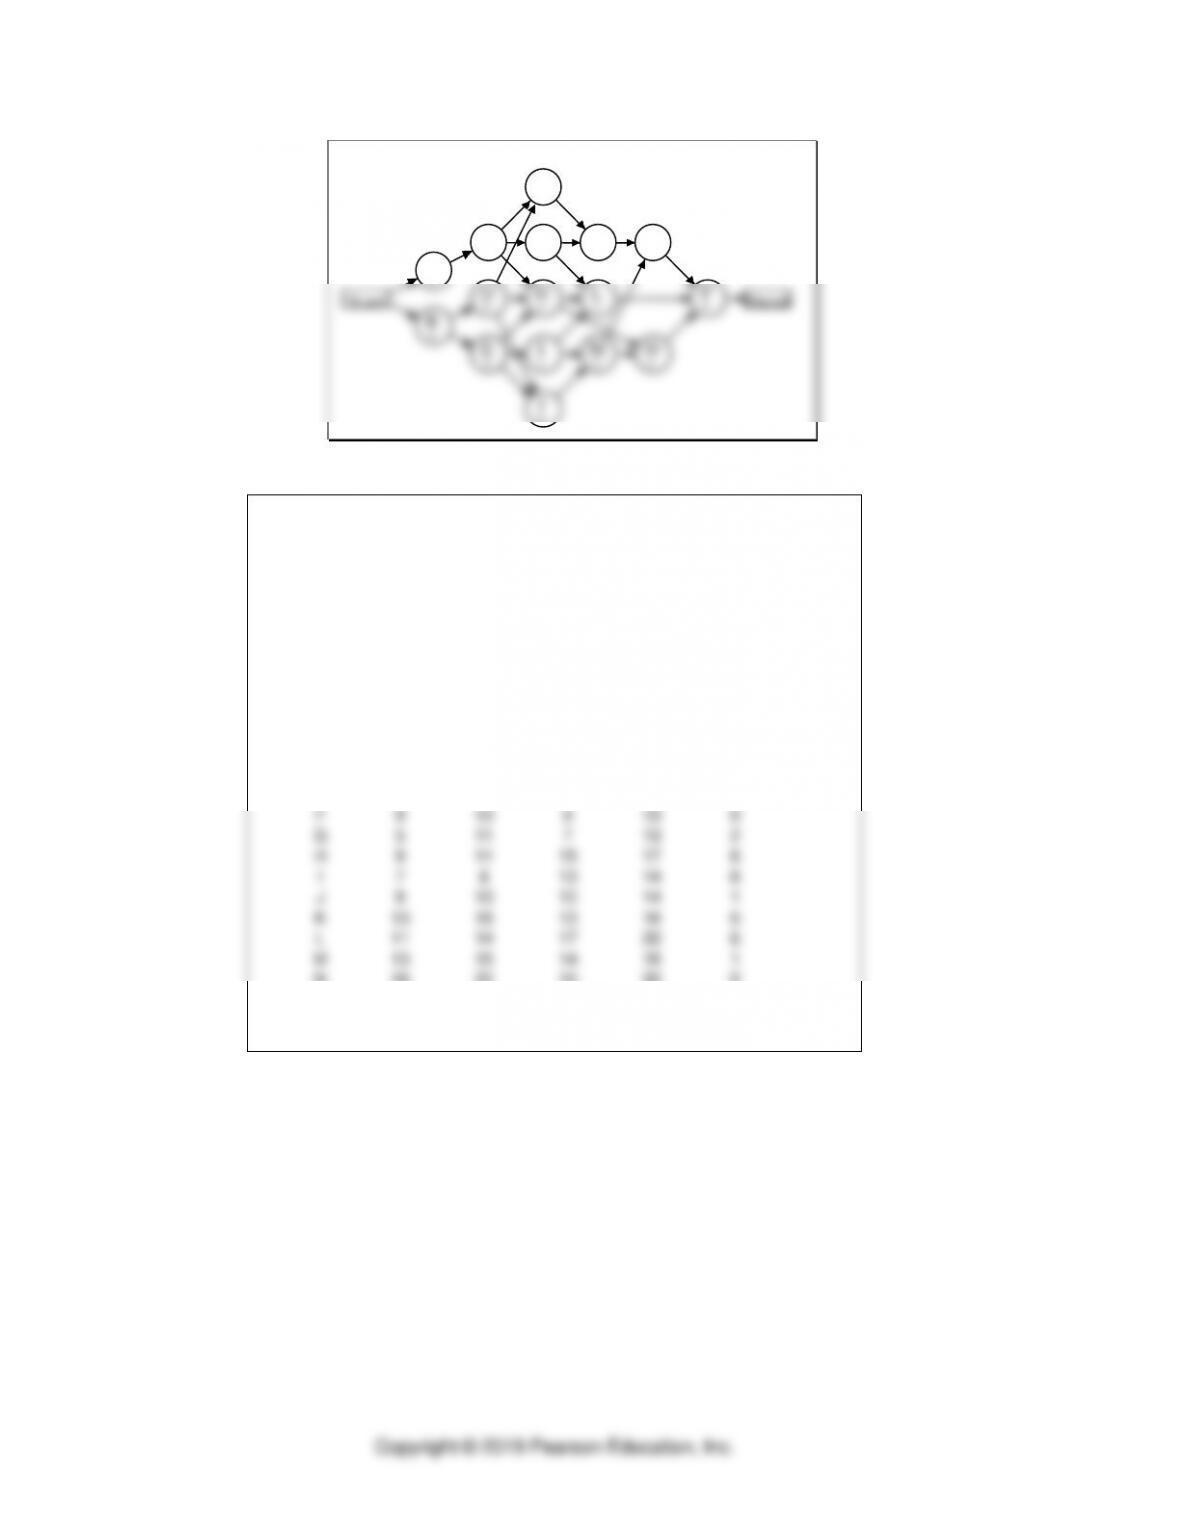
18. Fund-raising project
a. AON diagram for the fund-raising project
Part I Managing Processes
7-16
Finish
F
4
G
6
H
2
I
1
J
4
K
3
L
3
M
2
C
2
D
5
E
3
N
4
P
5
O
1
A
3
B
4
Start
Activity slacks for the project:
Results
Solver – Project Budgeting
25 $2,125
Activity
Early
Start
Early
Finish
Late
Start
Late
Finish
Total
Activity
Slack
A 0 3 2 5 2
B 0 4 0 4 0
C 3 5 5 7 2
D 4 9 4 9 0
E 4 7 7 10 3
F 9 13 913 0
G 5 11 713 2
H 9 11 15 17 6
I 7 8 13 14 6
J 9 13 10 14 1
K13 16 13 16 0
L11 14 17 20 6
M13 15 14 16 1
N16 20 16 20 0
O15 16 19 20 4
P20 25 20 25 0
Project time
Project Budget
The critical path is B–D–F–K–N–P, and the expected completion time is 25
days.