Unlock document.
This document is partially blurred.
Unlock all pages and 1 million more documents.
Get Access
Chapter
6 Lean Systems
TEACHING TIP
Open with Aldi, a discount supermarket chain whose products due to the use of lean initiatives
can be as much as 30% cheaper than its competitors. At the same time, strong focus on the
customer’s needs allows Aldi to be ranked in the top three supermarket chains in customer
satisfaction in North America.
Lean systems affect a firm’s internal linkages between its core and supporting processes and its
external linkages with its customers and suppliers.
1. Marketing relies on lean systems to deliver high-quality services or products on time and at
reasonable prices.
1. Continuous Improvement Using a Lean Systems Approach
One of the most popular systems that incorporate the generic elements of lean systems is the just-
in-time (JIT) system.
The Japanese term for this approach is Kaizen. The key to kaizen is the understanding that excess
capacity or inventory hides process problems.
The goal is to eliminate the eight types of waste
Overproduction: manufacturing an item before it is needed.
Inappropriate processing: using expensive high precision equipment when simpler machines
would suffice.
and creativity.
Lean systems provide the mechanism for management to reveal the problems by systematically
lowering capacities or inventories until the problem is exposed
Philosophy (characterized in Figure 6.1)
In services, the water surface represents service system capacity, such as staff levels
2. Strategic Characteristics of Lean Systems
1. Supply Chain Considerations in Lean Systems
a. Close supplier ties
• Because lean systems operate with low levels of capacity slack or inventory, firms
that use them need to have a close relationship with their suppliers.
• More on supplier relationship in Chapter 14, “Supply Chain Integration.”
b. Small lot sizes
• Advantage
reduces the average level of inventory
2. Process Considerations in Lean Systems
a. Pull method of work flow
• Push method
Production of items begins in advance of customer needs.
Geared to make sure that an adequate inventory is available.
TEACHING TIP
Use the restaurant or cafeteria buffet example to illustrate push systems
• Pull method
Customer demand activates the production of the service or the item.
TEACHING TIP
Use a five-star restaurant example to illustrate the pull system
• The choice between the push and pull methods is often situational
Firms with highly repetitive processes and well-defined work flows of
standardized items often use the pull method because it allows closer control of
inventory and output at the workstations
Push systems typically used when processes have long lead times, there is
reasonable accurate forecasts of demand, a variety of products that require
common processes, and customer who will not wait long.
Firms with assemble-to-order strategy sometimes use both.
b. Quality at the source
• Jidoka represents a visual management system whereby status of the system in terms
of safety, quality, delivery, and cost
• Employees also have option to signal a need for help without stopping the line
TEACHING TIP
Use Managerial Practice 6.1 to illustrate how Alcoa achieved leaner systems by utilizing process
improvement tools and continuous improvement to build quality at the source.
c. Uniform workstation loads
• Takt time is the cycle time needed to match the rate of production to the rate of sales
or consumption
d. Standardized components and work methods
e. Flexible Workforce
f. Automation
g. Five S (5S) Practices
• Sort: separate needed items from unneeded items.
h. Total Preventive Maintenance (TPM)
• Can reduce the frequency and duration of machine downtime
• Data can also provide failure history and costs incurred to maintain the systems.
3. Toyota Production System
a. The famed Toyota Production System (TPS) is one of the most admired lean
manufacturing systems in existence.
b. Through the process of continuous improvement, Toyota built a learning organization
over the course of 50 years.
c. Four principles form the basis of the TPS.
• All work must be completely specified as to content, sequence, timing, and outcome.
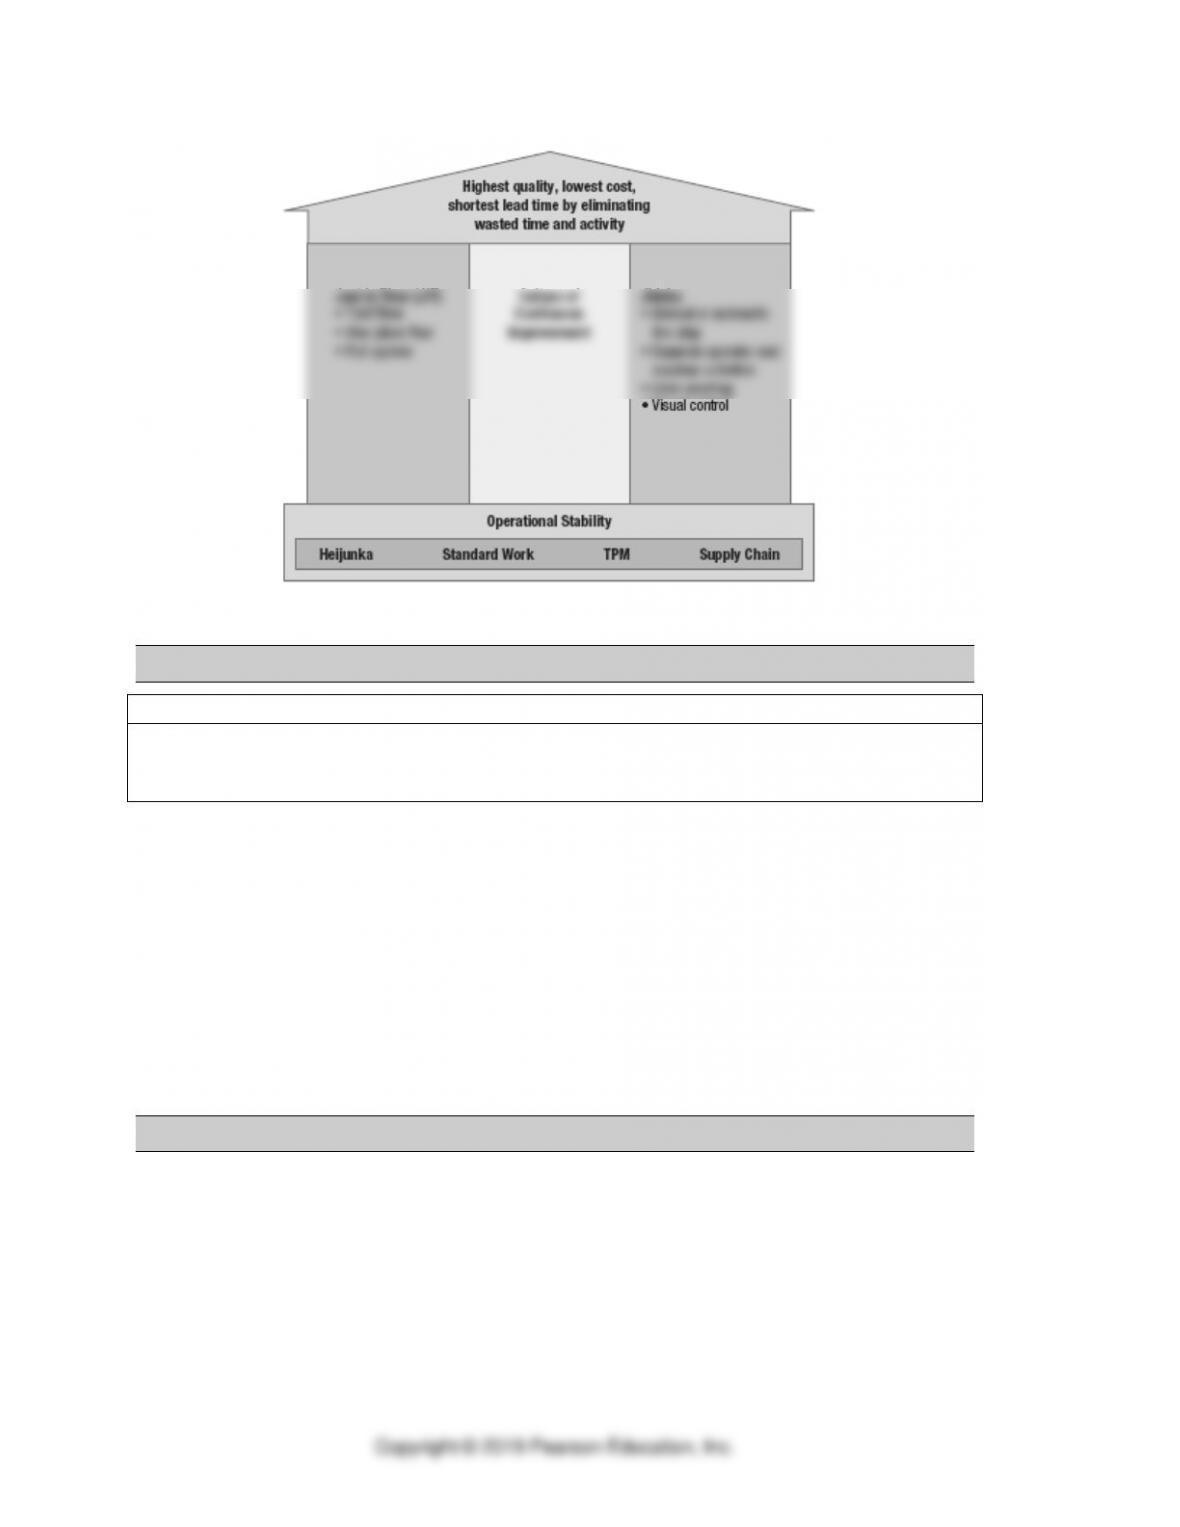
d. House of Toyota: A key challenge to managers seeking to implement lean systems in
their organizations is to bring its underlying philosophy to their employees in an easy-to-
understand fashion.
• The house conveys stability
3. Designing Lean System Layouts
TEACHING TIP
Line flows are recommended in the designing lean systems layouts because they eliminate waste
by reducing the frequency of setups. Banks use strategy in their check-processing operations and
UPS in its parcel-sorting process
1. One worker, multiple machines (OWMM)
a. If volumes are not sufficient to keep several workers busy on one production line, the
manager might set up a line small enough to keep one worker busy.
b. Manufacturers apply the OWMM concept widely because of their desire to achieve low
inventories.
2. Group technology
a. Group parts or products with similar characteristics into families. The goal is to identify a
set of products with similar processing requirements and minimize the machine
changeover or setup time.
4. The Kanban System
One of the most publicized aspects of lean systems, and the TPS in particular, is the Kanban
system developed by Toyota.
1. Kanban
a. A Japanese word for “card” or “visible record”
b. Used to control the flow of production
2. General operating rules
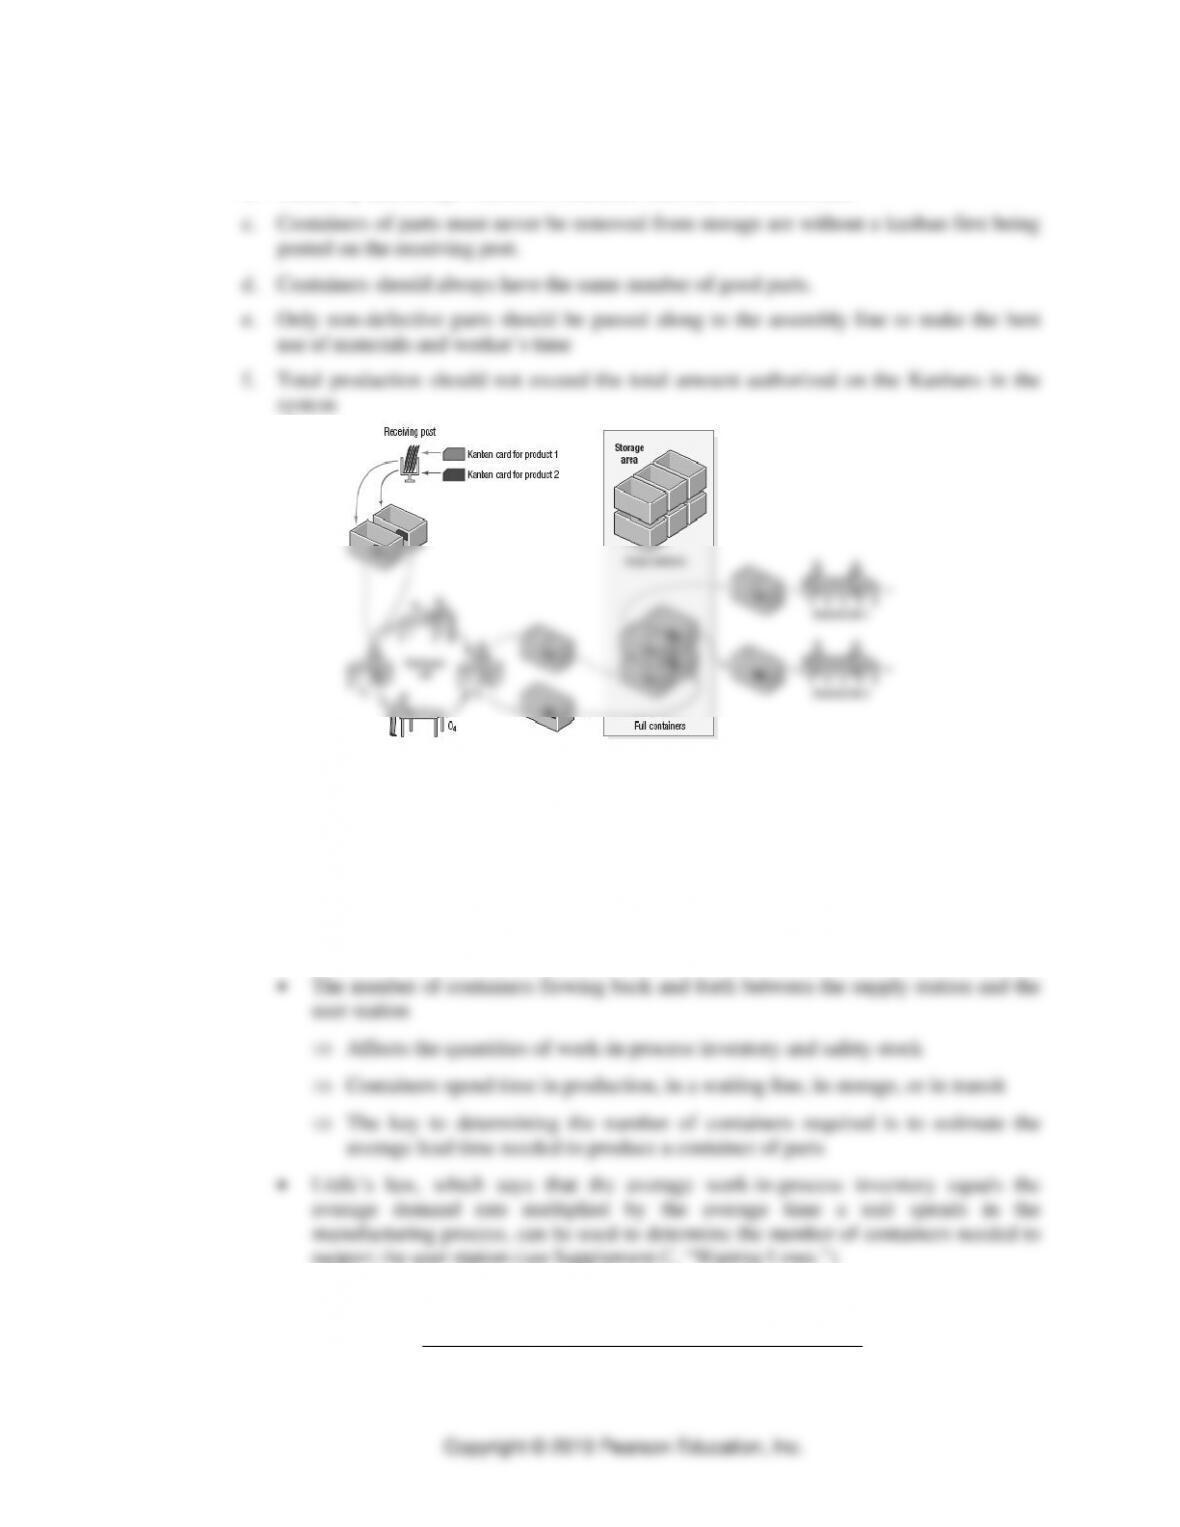
a. Each container must have a card
b. Assembly line always withdraws materials from the fabrication cell.
3. Determining the number of containers
a. Management must make two determinations
• The number of units to be held by each container
Amounts to determining lot size
Requires balancing the cost of setup with the cost of holding inventory
support the user station (see Supplement C, “Waiting Lines.”).
b. Formula for the number of containers
containerper units ofNumber
stocksafety timelead during demand Average +
=k

Copyright © 2019 Pearson Education, Inc.
( )
( )
c
d
++
=1
The number of containers must (of course) be an integer
The container quantity,
c
, and the efficiency factor,
, are variables that
management can control
Safety stock and their use are discussed in more detail in chapters 9, “Supply
Chain Design,” and Chapter 12, “Inventory Management.”
c. Use Example 6.1
d. Determining the Number of Containers. Use Application 6.1:
Item B52R has an average daily demand of 1000 units. The average waiting time per
container of parts (which holds 100 units) is 0.5 day. The processing time per container is
0.1 day. If the policy variable is set at 10 percent, how many containers are required?
( )
( ) ( )( )
6.6
100
1.011.05.0000,11 =
++
=
++
=c
d
k
, or 7 containers
e. Tutor 6.1 in MyLab Operations Management provides a new example of using the model
to determine the number of containers.
4. Other Kanban Signals
a. Container System: empty container signals the need to fill it.
b. Containerless System: such as painted squares on a workbench
5. Value Stream Mapping
1. Value stream mapping (VSM) is a widely used qualitative lean tool aimed at eliminating
waste (or muda).
2. VSM is helpful because it creates a visual “map” of every process involved in the flow of
materials and information in a product’s value chain
3. The first step is to focus on one product family, and followed by
a. Current state drawing
b. A future state drawing
c. Work plan and implementation
where
=k
number of containers for a part
=d
expected daily demand for the part, in units
=
average waiting time during the production process plus materials handling time per
container, in fractions of a day
=
average processing time per container, in fractions of a day
=c
quantity in a standard container of the part
=
a policy variable that adds safety stock to cover for unexpected circumstances
4. The process flows are similar to the flowcharts discussed in Chapter 4, “Process Analysis,
except that VSM spans the entire supply chain from the receipt of raw materials to the
delivery of the finished goods to the customer.
5. The value stream maps are more comprehensive than process flowcharts, and meld together
planning and control systems, discussed in detail in Chapter 11, “Resource Planning.”
6. Determining the Value Stream Map, Takt Time and Total Capacity
a. Introduce with Example 6.2
b. Use Application 6.2
The manager at Gilman’s Inc. collected the value stream mapping data from the
plant’s most problematic manufacturing cell that fabricates parts for vending
machines. This data is shown below. Using this data, calculate the current state
performance of the cell and answer the following questions.
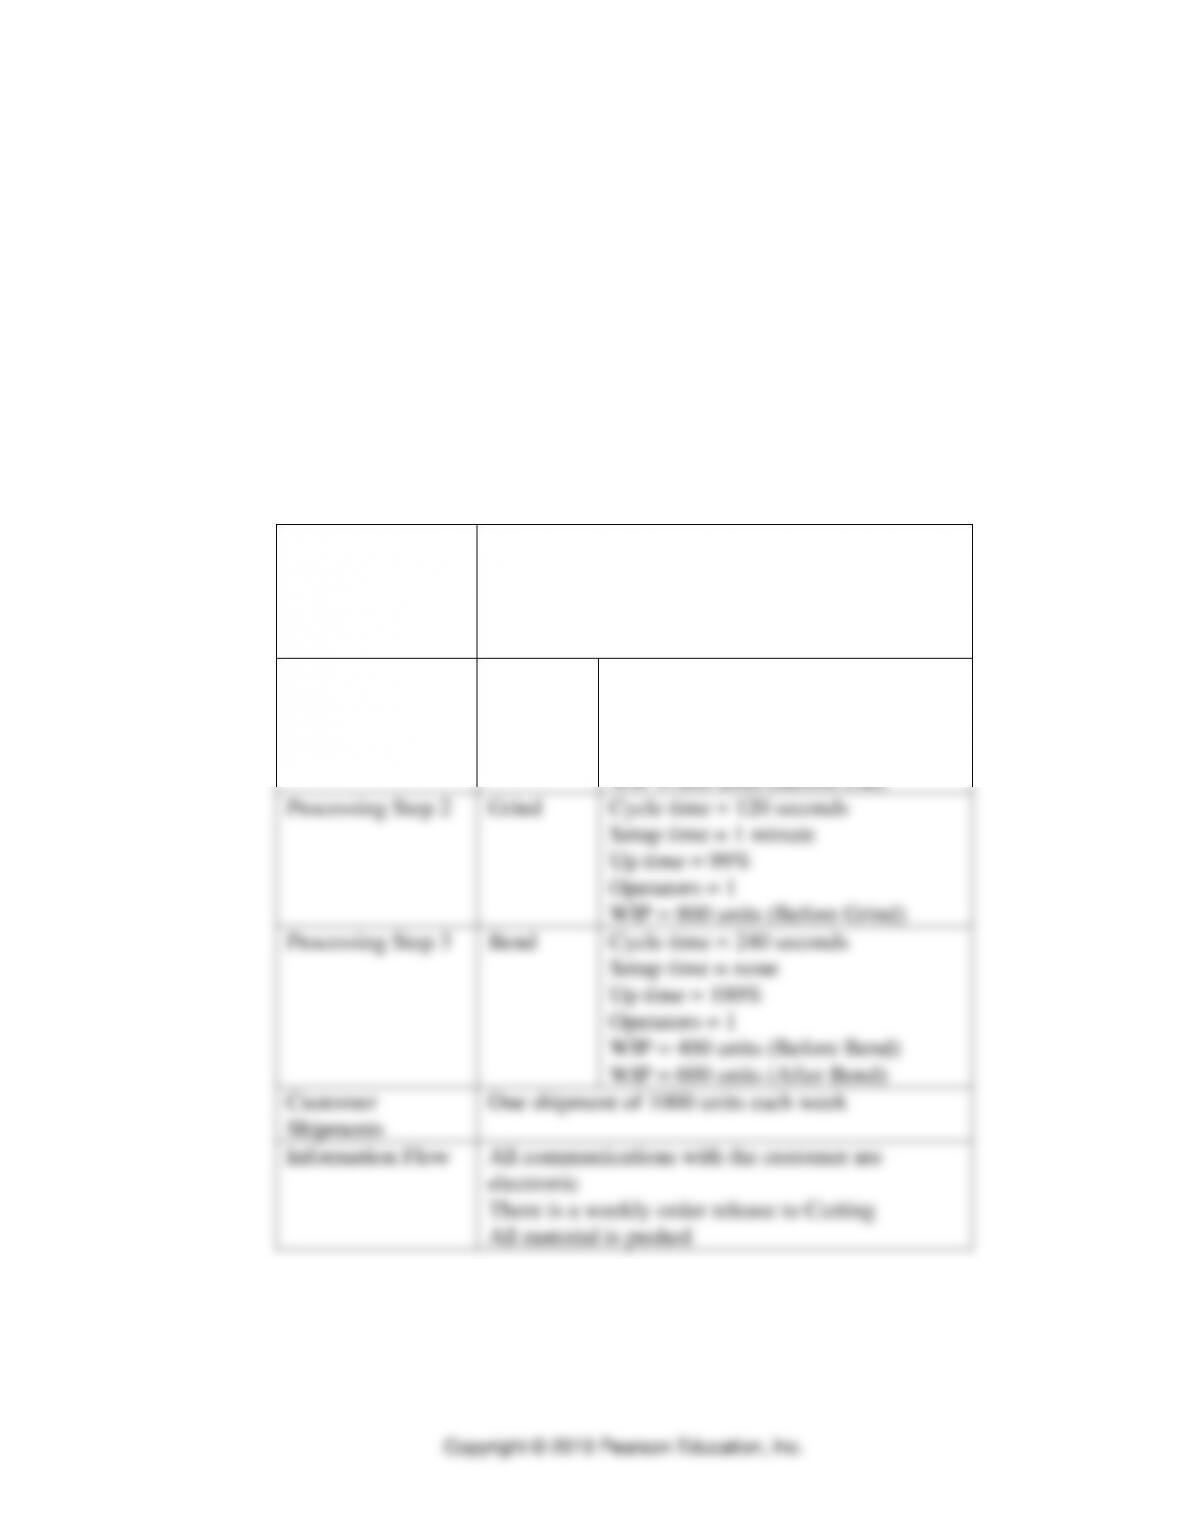
Overall Process
Attributes
Average demand: 200/day
Batch size: 20
Number of shifts per day: 2
Availability:8 hours per shift with a 45-minute
break
Processing Step 1
Cut
Cycle time = 160 seconds
Setup time = 3 minutes
Up time = 100%
Operators = 1
WIP = 600 units (Before Cut)
Processing Step 2
Grind
Cycle time = 120 seconds
Setup time = 1 minute
Up time = 99%
Operators = 1
WIP = 800 units (Before Grind)
Processing Step 3
Bend
Cycle time = 240 seconds
Setup time = none
Up time = 100%
Operators = 1
WIP = 400 units (Before Bend)
WIP = 600 units (After Bend)
Customer
Shipments
One shipment of 1000 units each week
Information Flow
All communications with the customer are
electronic
There is a weekly order release to Cutting
All material is pushed
a. What is the cell’s current inventory level?
The cell’s current inventory level is [600+800+400+600] = 2400 units
b. What is the takt time for this manufacturing cell?
The cell’s takt time is 4.35 minutes per unit.

(8hrs*60mins-45mins) 2shifts = 870 minutes available per
day for production.
870 mins/200units of demand per day = 4.35 minutes per
unit.
c. What is the production lead time at each process in the manufacturing
cell?
The cell’s production lead time is: 3 + 4 + 2 + 3 = 12 days
Raw Material lead time = [600/200] = 3 days
WIP lead time between Cut and Grind = [800/200] = 4 days
WIP lead time between Grind and Bend = [400/200] = 2
days
Finished Goods lead time after Bend = [600/200] = 3 days
d. What is the total processing time of this manufacturing cell?
The cell’s processing time is [160+120+240] = 520 seconds.
e. What is the capacity of this manufacturing cell?
The cell’s capacity is 217.5 units per day (slightly larger than
6. Operational Benefits and Implementation Issues
1. Organizational considerations
a. Human costs of lean systems
b. Cooperation and trust
• workers and first-line supervisors must take on responsibilities formerly assigned to
middle managers and support staff.
c. Reward systems and labor classifications
2. Process considerations
a. To take advantage of lean practices, firms might have to change their existing layouts.
b. Loading docks might have to be reconstructed or expanded and certain operations
relocated to accommodate the change in transportation mode and quantities of arriving
materials
3. Inventory and scheduling
a. Schedule stability: Lean systems used in high-volume, make-to-stock environments
cannot respond quickly to scheduling changes because little slack inventory or capacity is
available to absorb these changes.
TEACHING TIP
Video Case: Lean Systems at Autoliv illustrates their lean journey for reducing product defects,
inventory levels are lower, and inventory turnover is approaching world-class levels of 50.
Case: Copper Kettle Catering looking into lean concepts and practices transferable to a service
business.


