Unlock document.
This document is partially blurred.
Unlock all pages and 1 million more documents.
Get Access
Chapter
5 Constraint Management
TEACHING TIP
Introduce with Microsoft Corporation and how it’s XIT sustained Engineering manages change
request in its software development process.
• What was the problem?
• How did they solve the problem?
TEACHING TIP
Managers throughout the organization must understand how to identify and manage bottlenecks
in all types of processes, how to relate the capacity and performance measures of one process to
another, and how to use that information to determine the firm’s best service or product mix.
This chapter explains how managers can best make these decisions.
1. A constraint is any factor that limits the performance of a system and restricts its output
2. Capacity is the maximum rate of output of a process or a system.
3. Three types of constraints
a. Physical – machine, labor, workstation capacity, material shortage, space, and quality
b. Market – demand is less than capacity
c. Managerial – policies, metrics, mind-sets
4. A bottleneck (also called capacity constraint resource) is a special type of constraint that
relates to the capacity shortage of a process, and is defined as any resource whose available
capacity limits the organization’s ability to meet the service or product volume, product mix,
or fluctuating requirements demanded by the marketplace.
1. The Theory of Constraints
The theory of constraints (TOC) is a systematic management approach that focuses on actively
managing those constraints that impede a firm’s progress toward its goal of maximizing profits
and effectively using its resource.
It is important to understand the relevant performance and capacity measures at the operational
level, as well as their relationship to the more broadly understood financial measures at the firm
level (refer to table 5.1).
Inventory (I): all money invested in a system in purchasing things that it intends to sell
A decrease in I leads to an increase in net profit, ROI, and cash flow
Throughput (T): rate at which a system generates money through sales
An increase in T leads to an increase in net profit, ROI, and cash flow
Operating Expenses (OE): all the money a system spends to turn inventory into throughput
A decrease in OE leads to an increase in net profit, ROI, and cash flow
Utilization (U): the degree to which equipment, space, or labor is currently being used,
and is measured as the ratio of average output rate to maximum capacity, expressed as a
percentage
An increase in U at the bottleneck leads to an increase in net profit, ROI, and cash flow
1. 7 Key principles of TOC
a. The focus should be on balancing flow, not on balancing capacity.
b. Maximizing the output and efficiency of every resource may not maximize the
throughput of the entire system.
g. Every capital investment must be viewed from the perspective of its global
impact on overall throughput (T), inventory (I), and operating expense (OE).
h. Application of TOC involves five steps.
• Step 1: Identify system bottleneck(s)
2. Managing Bottlenecks in Service Processes
• Bottlenecks can both be internal or external to the firm, and typically represents a
process, a step, or a workstation with the lowest capacity.
• Throughput time is the total time elapsed from the start to finish of a job or a
customer being processed at one or more work centers.
Copyright © 2019 Pearson Education, Inc.
• Managing bottlenecks in service processes. Use Example 5.1
• Floating bottlenecks
• Variability increases complexity
3. Managing Bottlenecks in Manufacturing Processes
1. Identifying bottlenecks
1. Bottlenecks can exist in all types of manufacturing processes, including the job process,
batch process, line process, and continuous process.
Use Example 5.2: Diablo Electronics
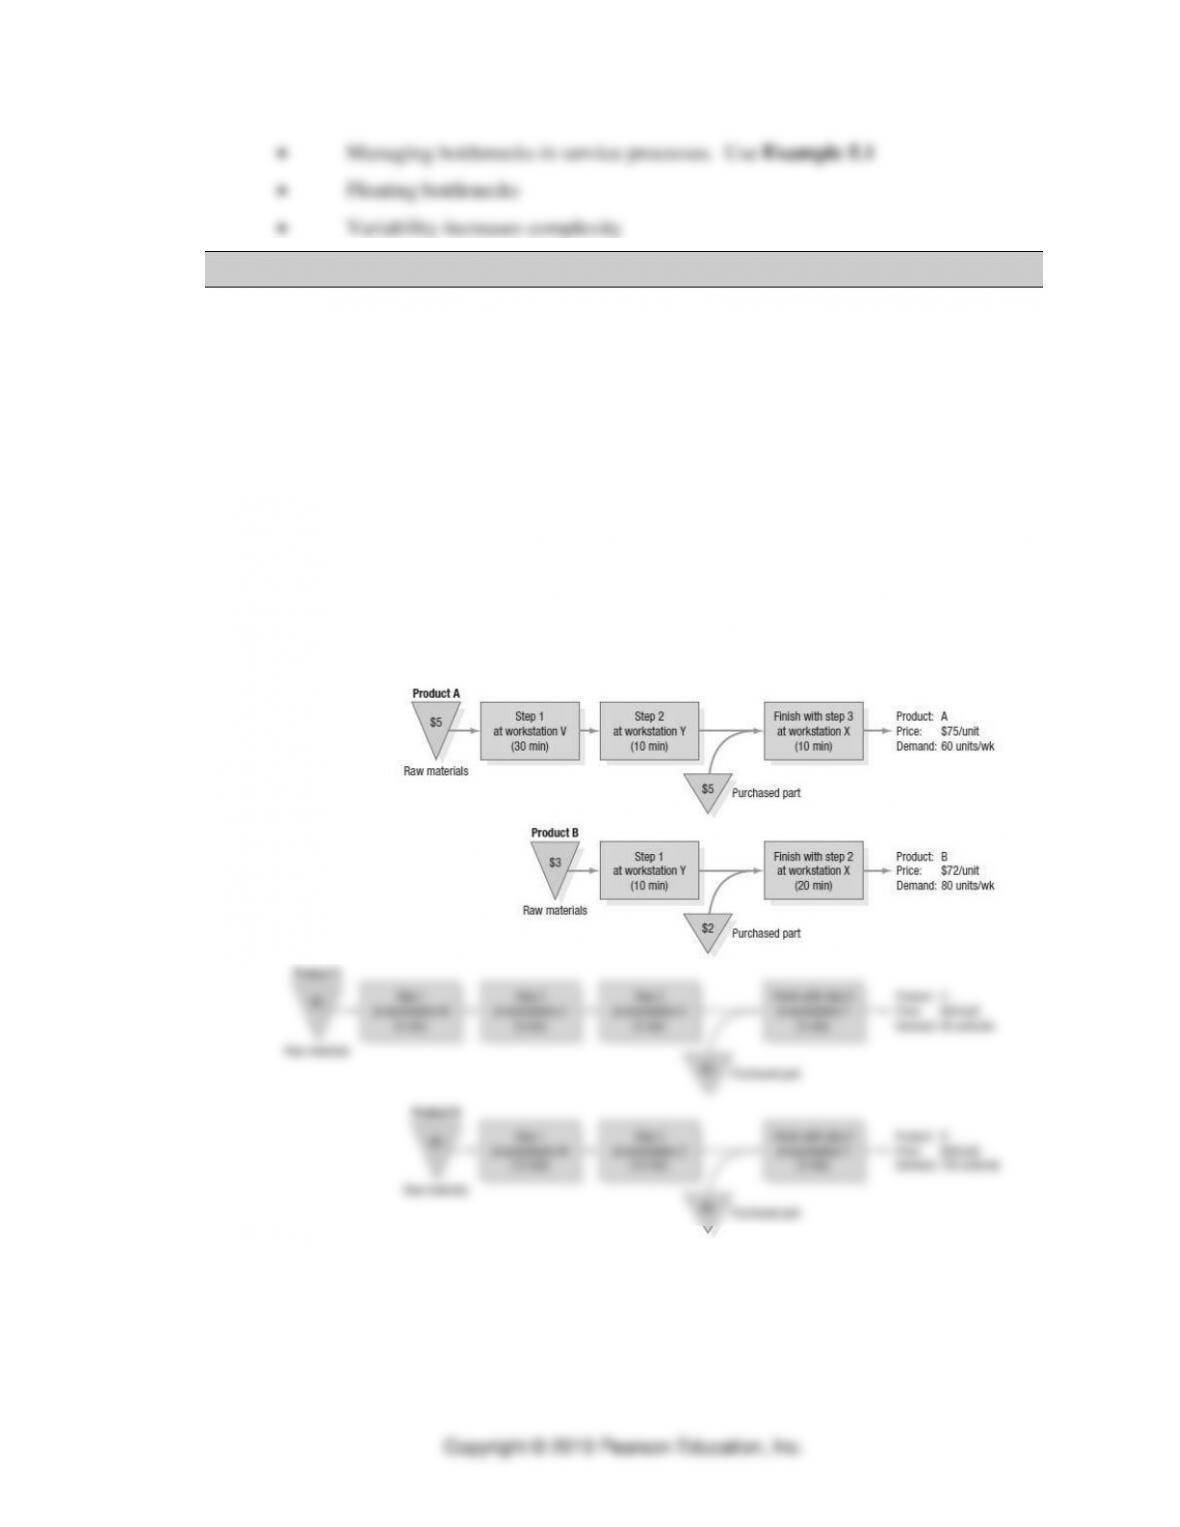
Diablo Electronics manufactures four unique products (A, B, C, and D) that are fabricated in
five different workstations (V, W, X, Y, and Z). Each workstation is staffed by a dedicated
8-hour shift worker. Batch setup times are negligible. The flowchart that denotes the path
each product follows through the manufacturing process is shown in text Figure 5.2, where
each product’s price, demand per week, and processing times per unit are indicated as well.
Inverted triangles represent purchased parts and raw materials consumed per unit at different
workstations. Diablo can make and sell up to the limit of its demand per week, and there are
no penalties for not being able to meet all the demand.
Which of the four work stations (W, X, Y, or Z) has the highest total workload?
Solution:
Using utilization to determine the bottleneck is not necessary, because the denominator in
the utilization ratio is the same for every work station, with one worker per machine at
each step in the process. So we identify the bottleneck by computing aggregate work
loads at each work station. The firm wants to satisfy as much of the product demand in a
week as it can. Each week consists of 2400 minutes of available production time.
Multiplying the processing time at each station for a given product with the number of
units demanded per week yields the capacity load. These loads are summed across all
products going through that workstation and then compared with the existing capacity of
2400 minutes.
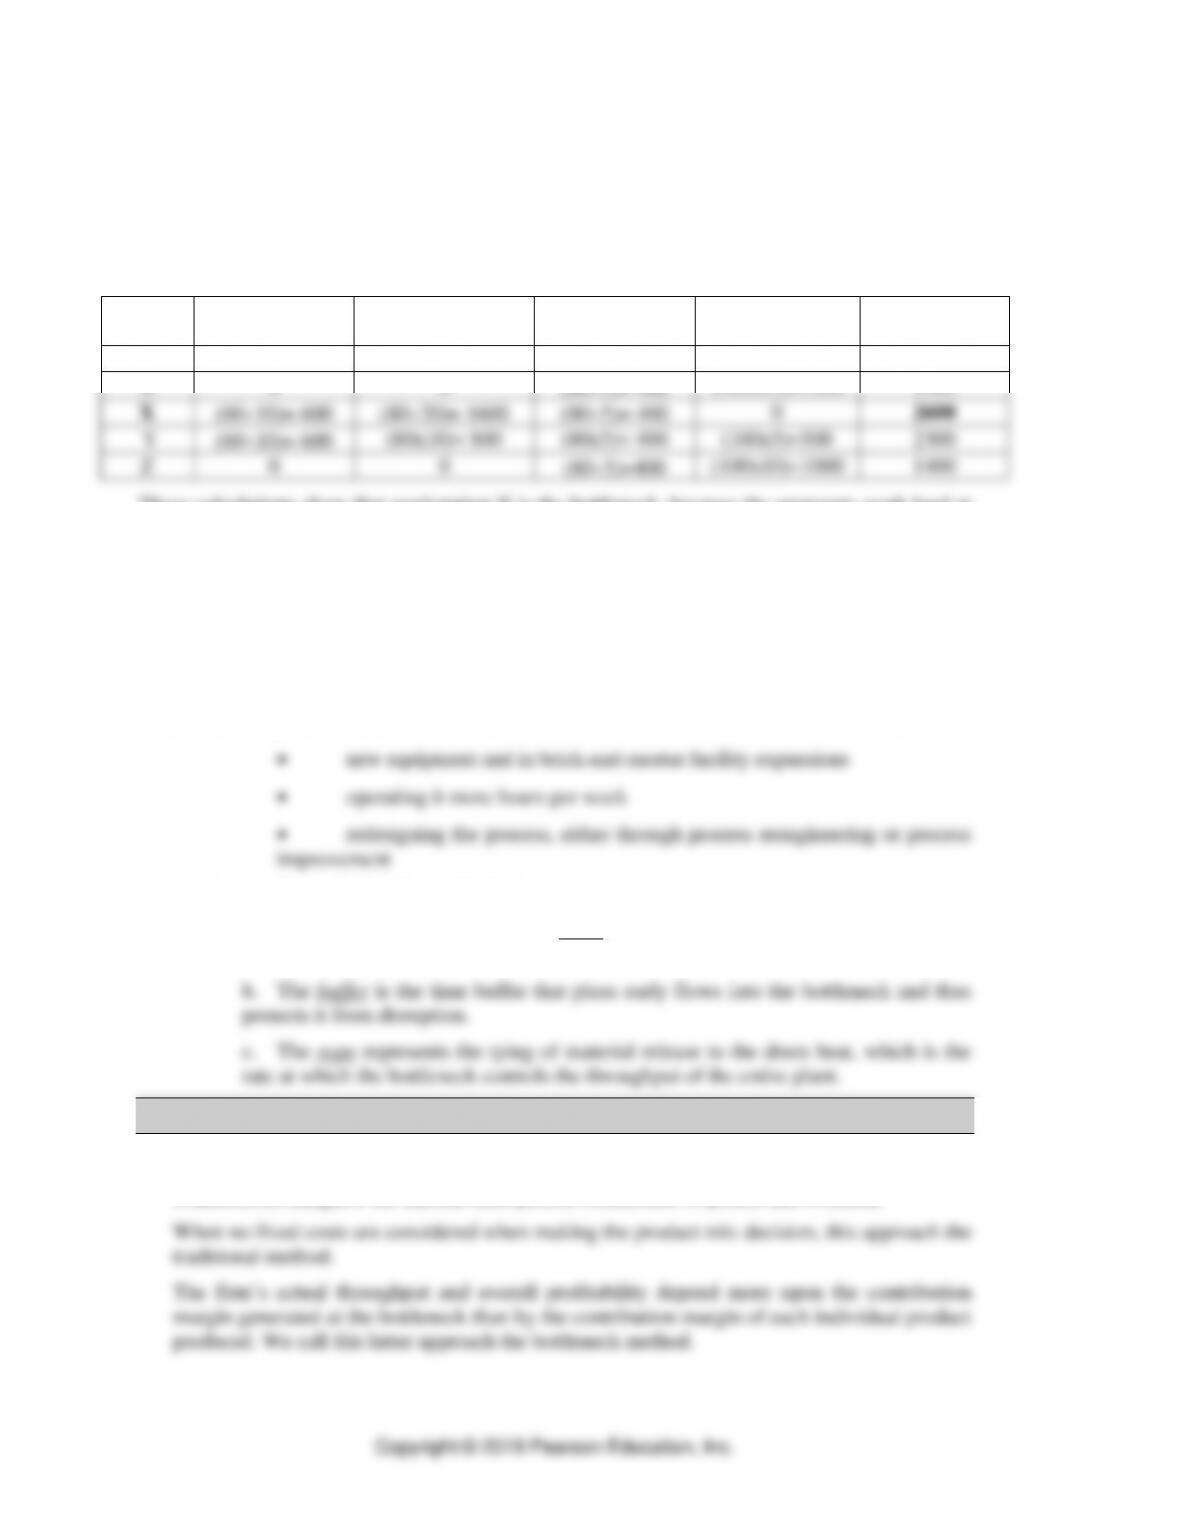
Work
Station
Load from
Product A
Load from
Product B
Load from
Product C
Load from
Product D
Total Load
(minutes)
V
(60x30)= 1800
0
0
0
1800
W
0
0
(805)= 400
(100x15)=1500
1900
X
(6010)= 600
(8020)= 1600
(805)= 400
0
2600
Y
(6010)= 600
(80x10)= 800
(80x5)= 400
(100x5)=500
2300
Z
0
0
(805)=400
(100x10)=1000
1400
These calculations show that workstation X is the bottleneck, because the aggregate work load at
X exceeds the available capacity of 2400 minutes per week.
Decision Point: Workstation X is the bottleneck for Diablo Electronics
2. Relieving Bottlenecks
a. The key to preserving bottleneck capacity is to carefully monitor short-term
schedules and keep bottleneck resource as busy as is practical.
b. The long-term capacity of bottleneck operations can be expanded in various
ways.
3. Drum-Buffer-Rope (DBR) Systems
a. The bottle neck schedule is the drum because it sets the beat or the production
rate for the entire plant and is linked to market demand
4. Applying the Theory of Constraints to Product Mix Decisions
Determining the Product Mix Using Contribution Margin
Contribution margin is the amount each product contributes to profits and overhead
• Use Example 5.3 (Diablo Electronics - Complete Solution in text) or Application 5.1:
O’Neill Enterprises
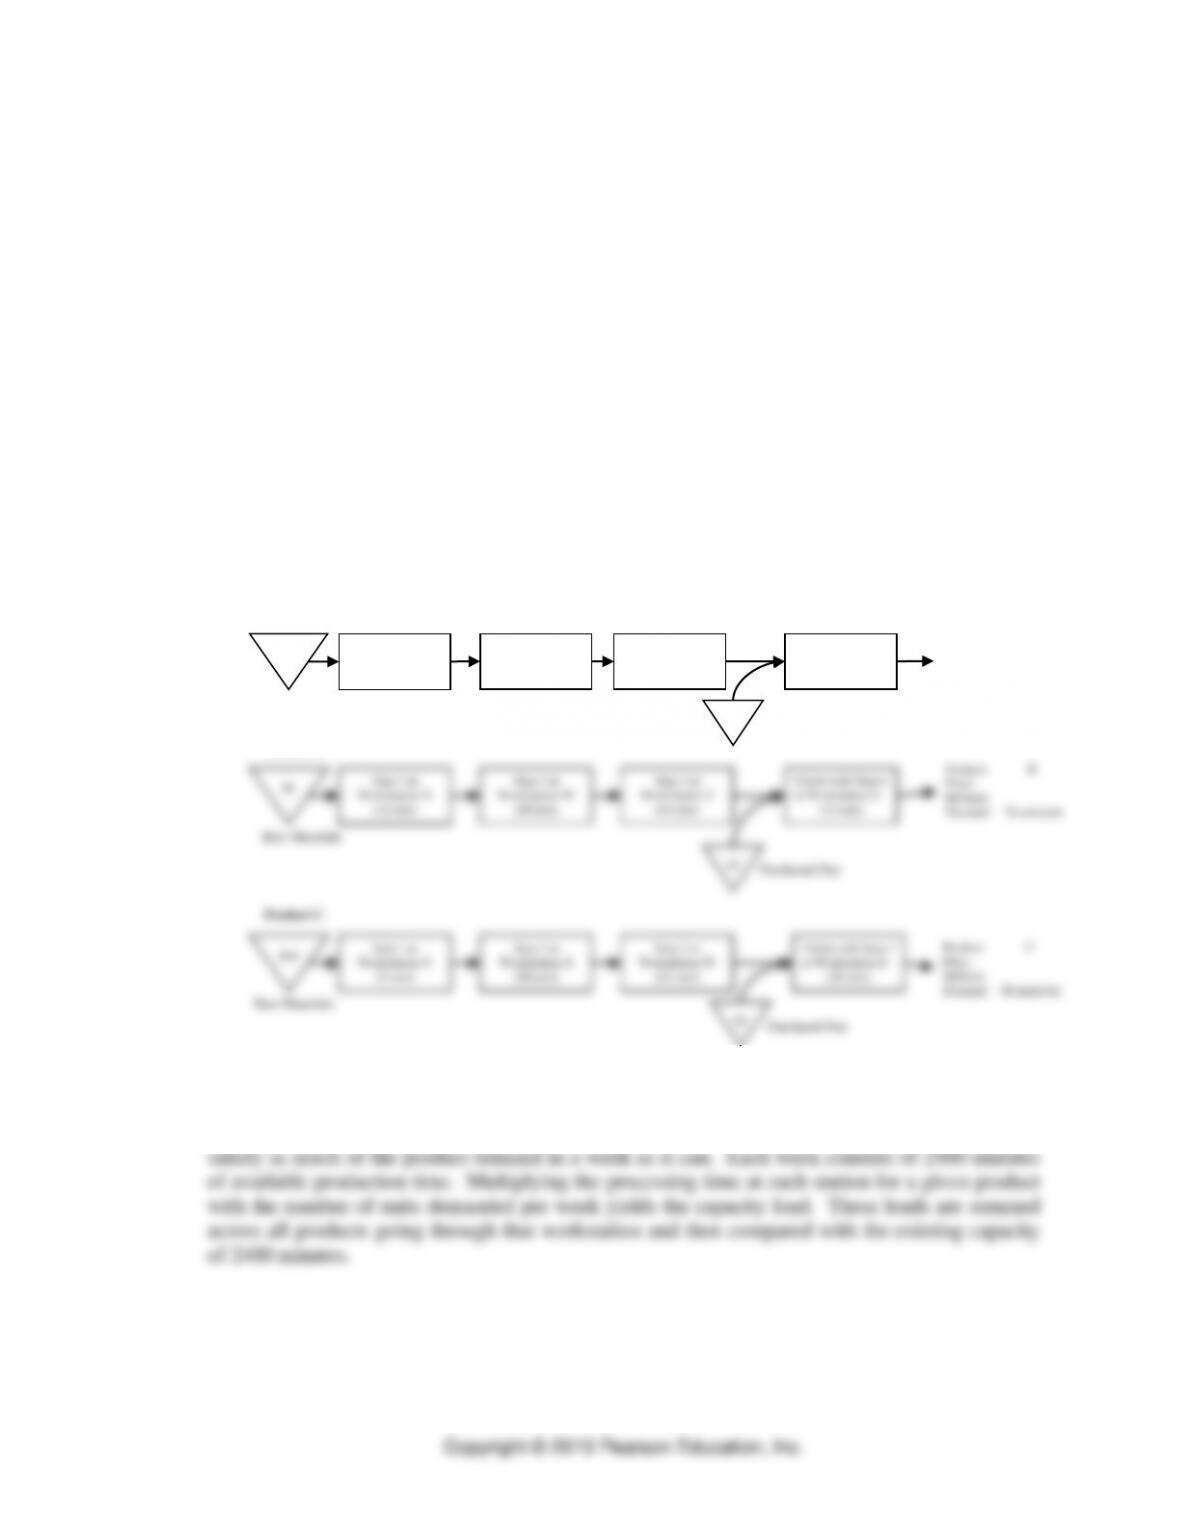
O’Neill Enterprises manufactures three unique products (A, B, C) that are fabricated and
assembled in four different workstations (W, X, Y, Z) using a small batch process. Each of the
products visits every one of the four workstations, though not necessarily in the same order.
Batch setup times are negligible. A flowchart that denotes the path each product follows through
the manufacturing process is shown below, where each product’s price, demand per week, and
processing times per unit are indicated as well. Inverted triangles represent purchased parts and
raw materials consumed per unit at different workstations. O’Neill can make and sell up to the
limit of its demand per week, and there are no penalties for not being able to meet all the demand.
Each workstation is staffed by a worker dedicated to work on that workstation alone, and is paid
$12 per hour. Variable overhead costs are $8000/week. The plant operates one 8-hour shift per
day, or 40 hours/week.
Which of the four workstations W, X, Y, or Z has the highest total workload, and thus serves as
the bottleneck for O’Neill Enterprises?
Flowchart for Products A, B, and C
Solution
Identify the bottleneck by computing total workload at each workstation. The firm wants to
$7
Step 1 at
Workstation W
(10 min)
Step 3 at
Workstation X
(9 min)
Finish with Step 4
at Workstation Z
(16 min)
Product: A
Price:
$90/unit
Demand: 65 units/wk
Raw Materials
Product A
$9
Step 1 at
Workstation X
(12 min)
Step 3 at
Workstation Y
(10 min)
Finish with Step 4
at Workstation Z
(13 min)
Raw Materials
Product B
$10
Step 1 at
Workstation Y
(5 min)
Step 3 at
Workstation W
(12 min)
Finish with Step 4
at Workstation Z
(10 min)
Raw Materials
Product C
$5
$5
Purchased Part
Purchased Part
Product: B
Price:
$85/unit
Demand: 70 units/wk
Product: C
Price:
$80/unit
Demand: 80 units/wk
$6
Purchased Part
Step 2 at
Workstation W
(10 min)
Step 2 at
Workstation X
(10 min)
Step 2 at
Workstation Y
(15 min)
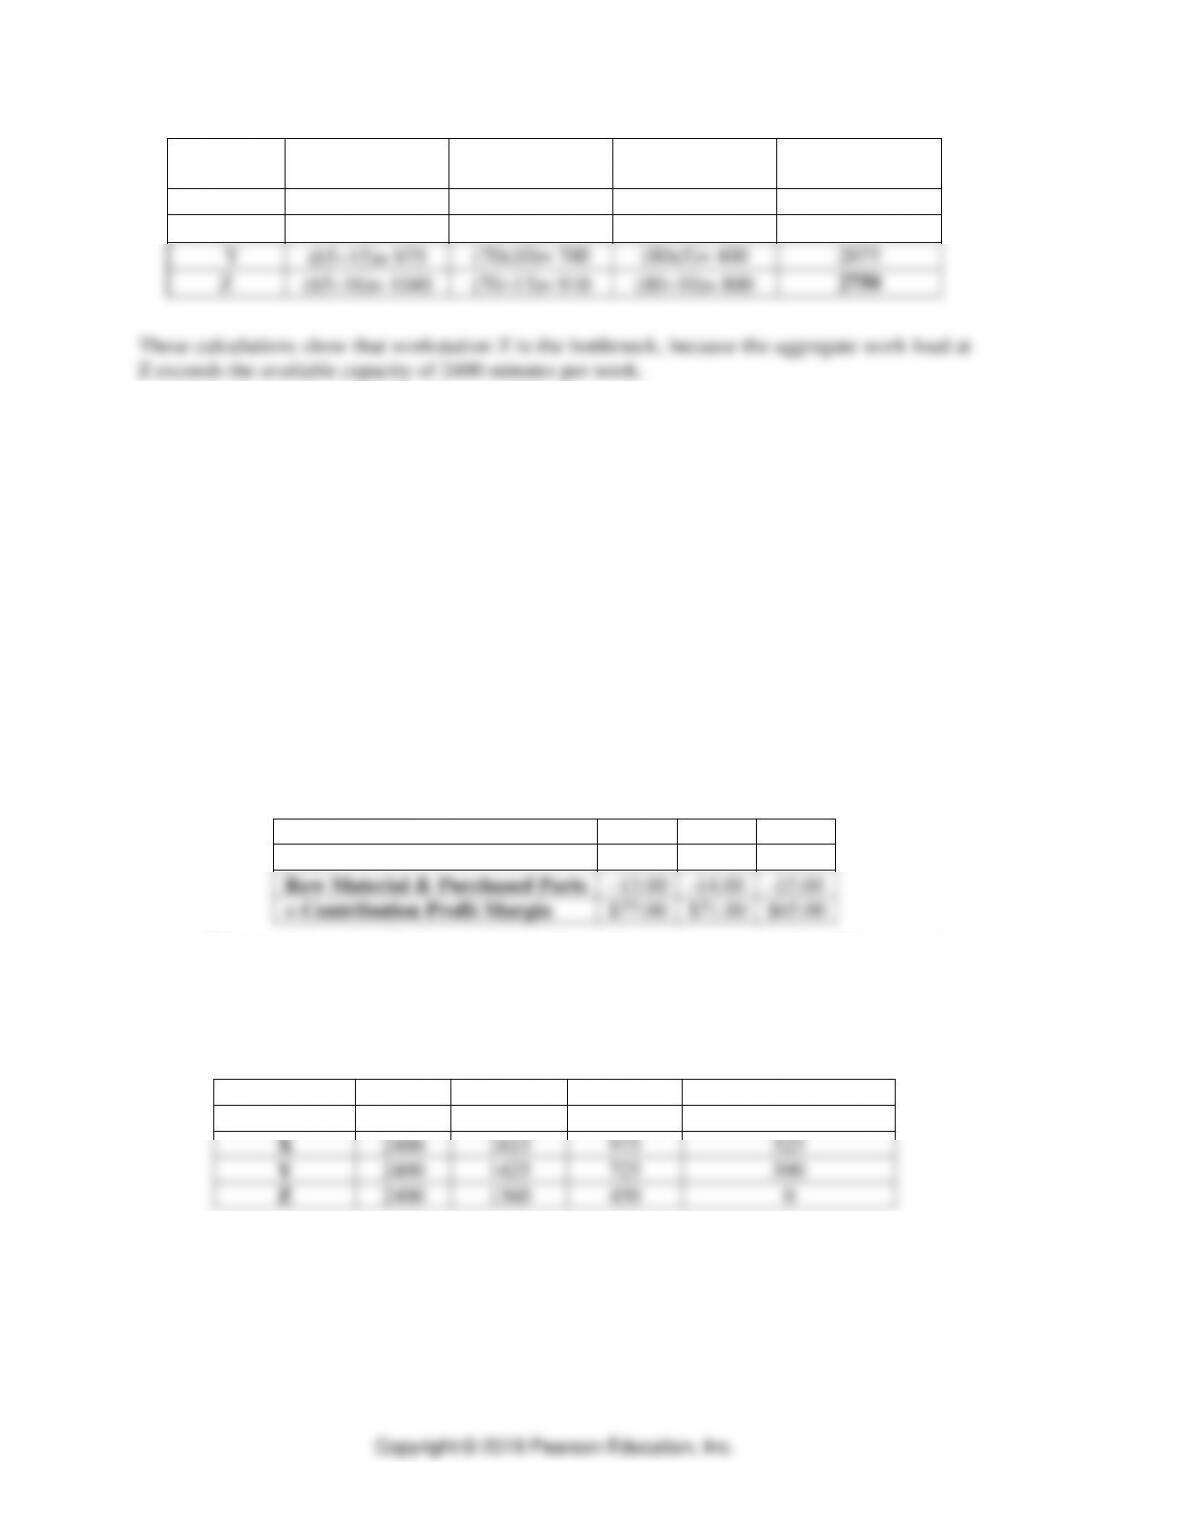
Work
Station
Load from
Product A
Load from
Product B
Load from
Product C
Total Load
(minutes)
W
(65x10)= 650
(7010)= 700
(8012)= 960
2310
X
(659)= 585
(7012)= 840
(8010)= 800
2225
Y
(6515)= 975
(70x10)= 700
(80x5)= 400
2075
Z
(6516)= 1040
(7013)= 910
(8010)= 800
2750
These calculations show that workstation Z is the bottleneck, because the aggregate work load at
Z exceeds the available capacity of 2400 minutes per week.
• Determining the product mix. Use Application 5.2 O’Neill Enterprises (continued)
The senior management at O’Neill Enterprises wants to improve the profitability of the firm by
accepting the right set of orders. Currently, decisions are made to accept as much of the highest
contribution margin product as possible (up to the limit of its demand), followed by the next
highest contribution margin product, and so on until no more capacity is available. Since the firm
cannot satisfy all the demand, the product mix must be chosen carefully. Jane Hathaway, the
newly hired production supervisor, is knowledgeable about the theory of constraints and
bottleneck based scheduling. She believes that profitability can indeed be approved if bottleneck
resources were exploited to determine the product mix. What is the change in profits if instead of
the traditional method that O’Neill has used thus far; a bottleneck based approach advocated by
Jane is used instead for selecting the product mix?
Solution:
Decision rule 1: Traditional method - Select the best product mix according to the highest
overall profit margin of each product.
Step 1: Calculate the profit margin per unit of each product as shown below
A
B
C
Price
$90.00
$85.00
$80.00
Raw Material & Purchased Parts
−13.00
-14.00
-15.00
= Contribution Profit Margin
$77.00
$71.00
$65.00
When ordering from highest to lowest, the profit margin per unit order of these products
is ABC.
Step 2: Allocate resources W, X, Y, and Z to the products in the order decided in step 1. Satisfy
each demand until the bottleneck resource (workstation Z) is encountered. Subtract minutes away
from 2400 minutes available for each week at each stage.
Work Center
Starting
After 65 A
After 70 B
Can Only Make 45 C
W
2400
1750
1050
510
X
2400
1815
975
525
Y
2400
1425
725
500
Z
2400
1360
450
0
Decision Point: The best product mix is 65 A, 70 B, and 45 C
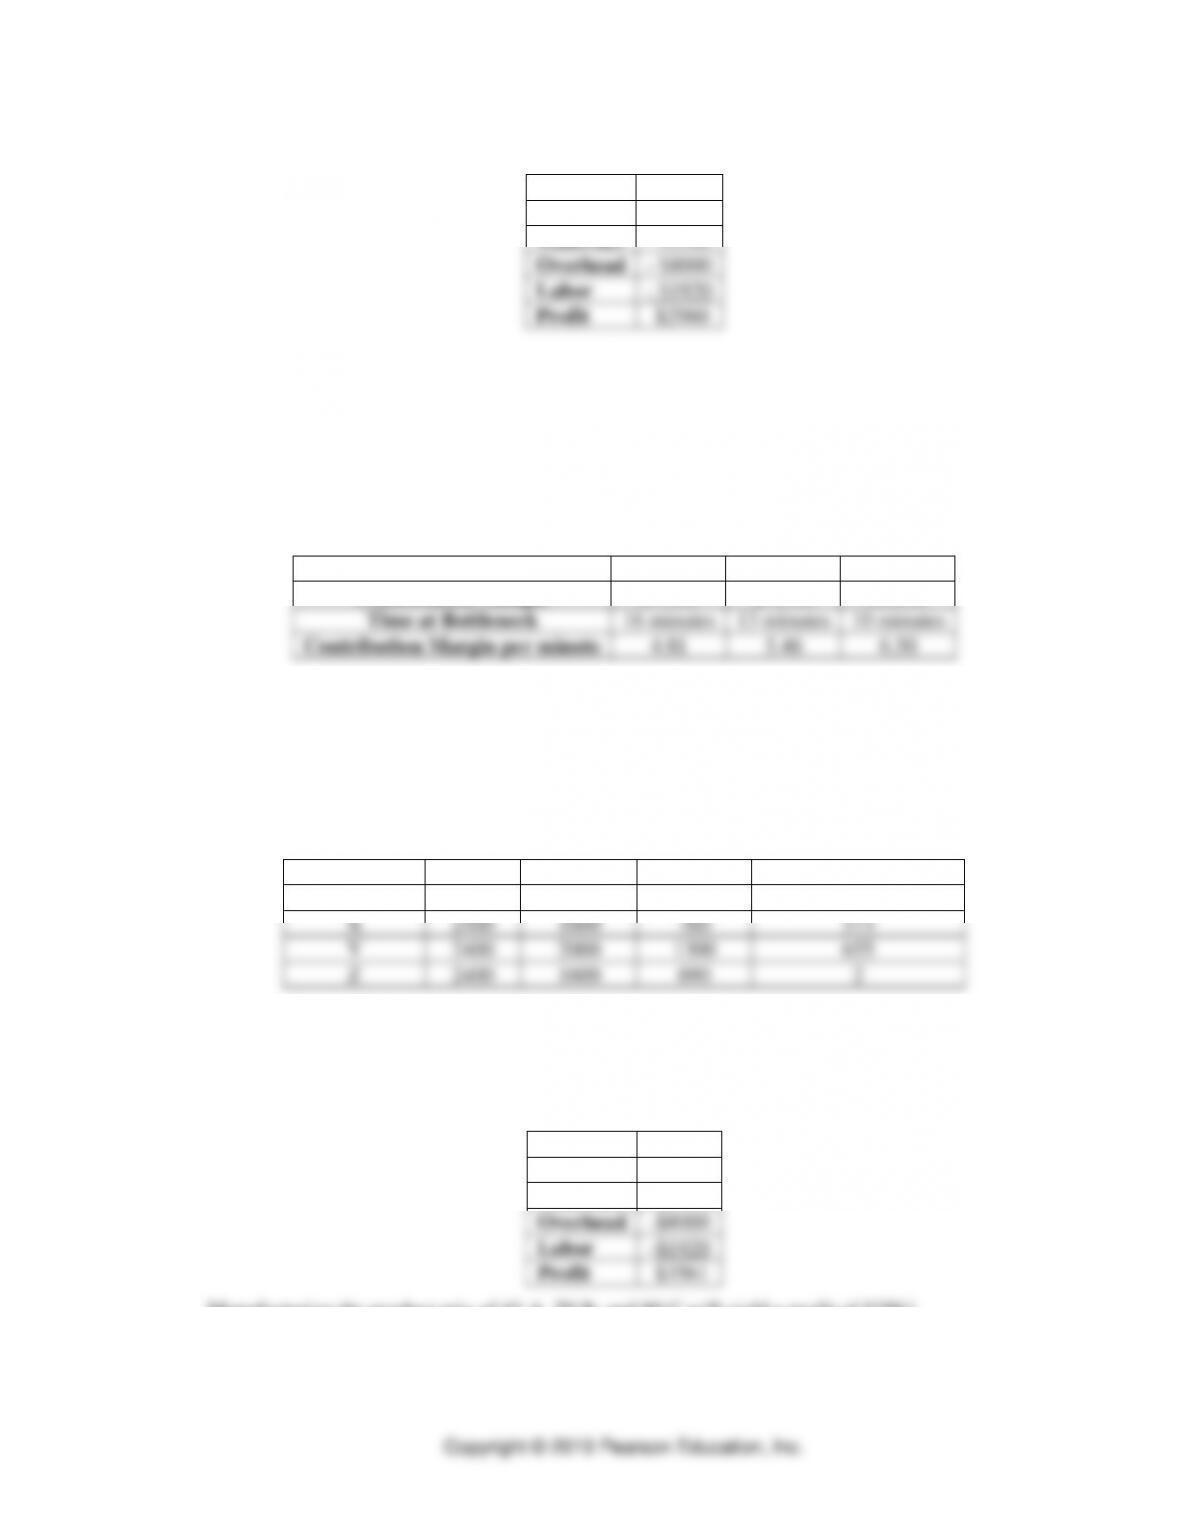
Step 3: Compute profitability for the selected product mix
Profits
Revenue
$15400
Materials
- $2500
Overhead
- $8000
Labor
- $1920
Profit
$2980
Manufacturing the product mix of 65 A, 70 B, and 45 C will yield a profit of $2980.
Decision Rule 2: Bottleneck-based approach - Select the best product mix according to the
dollar contribution per minute of processing time at the bottleneck workstation Z. This rule
would take advantage of the principles outlined in the theory of constraints and get the most
dollar benefit from the bottleneck.
Step 1: Calculate the contribution/minute of processing time at bottleneck workstation Z:
When ordering from highest to lowest contribution margin/minute at the bottleneck, the
manufacturing sequence of these products is CBA, which is reverse of the traditional
method order.
Step 2: Allocate resources W, X, Y, and Z to the products in the order decided in step 1. Satisfy
each demand until the bottleneck resource (workstation Z) is encountered. Subtract minutes away
from 2400 minutes available for each week at each stage.
Work Center
Starting
After 80 C
After 70 B
Can Only Make 43 A
W
2400
1440
740
310
X
2400
1600
760
373
Y
2400
2000
1300
655
Z
2400
1600
690
2
Decision Point: The best product mix is 43A, 70B, and 80C
Step 3: Compute profitability for the selected product mix. The new profitability figures are
shown below based on the new production quantities of 43A, 70B, and 80C.
Profits
Revenue
$16220
Materials
-$2739
Overhead
-$8000
Labor
-$1920
Profit
$3561
Manufacturing the product mix of 43 A, 70 B, and 80 C will yield a profit of $3561.
Product A
Product B
Product C
Contribution Margin
$77.00
$71.00
$65.00
Time at Bottleneck
16 minutes
13 minutes
10 minutes
Contribution Margin per minute
4.81
5.46
6.50
The increase in profit by using the bottleneck scheduling method is $581. By focusing on the
bottleneck resources in accepting customer orders and determining the product mix, O’Neill was
able to increase the firm’s profitability by 19.5% over the traditional contribution margin method.
TEACHING TIP
Linear programming (see Supplement D) could also be used to find the best product mix
5. Managing Constraints in Line Processes
1. Line Balancing
a. Assignment of work to stations in a line so as to achieve the desired output rate with the
smallest number of workstations.
b. Achieving the goal is similar to the theory of constraints
c. Differs in how it addresses bottlenecks
d. Precedence diagram – AON network
e. Desired output rate
• The goal is to match the output rate to the staffing or production plan.
• Matching output to demand ensures on-time delivery and prevents buildup of
unwanted inventory or customer delays
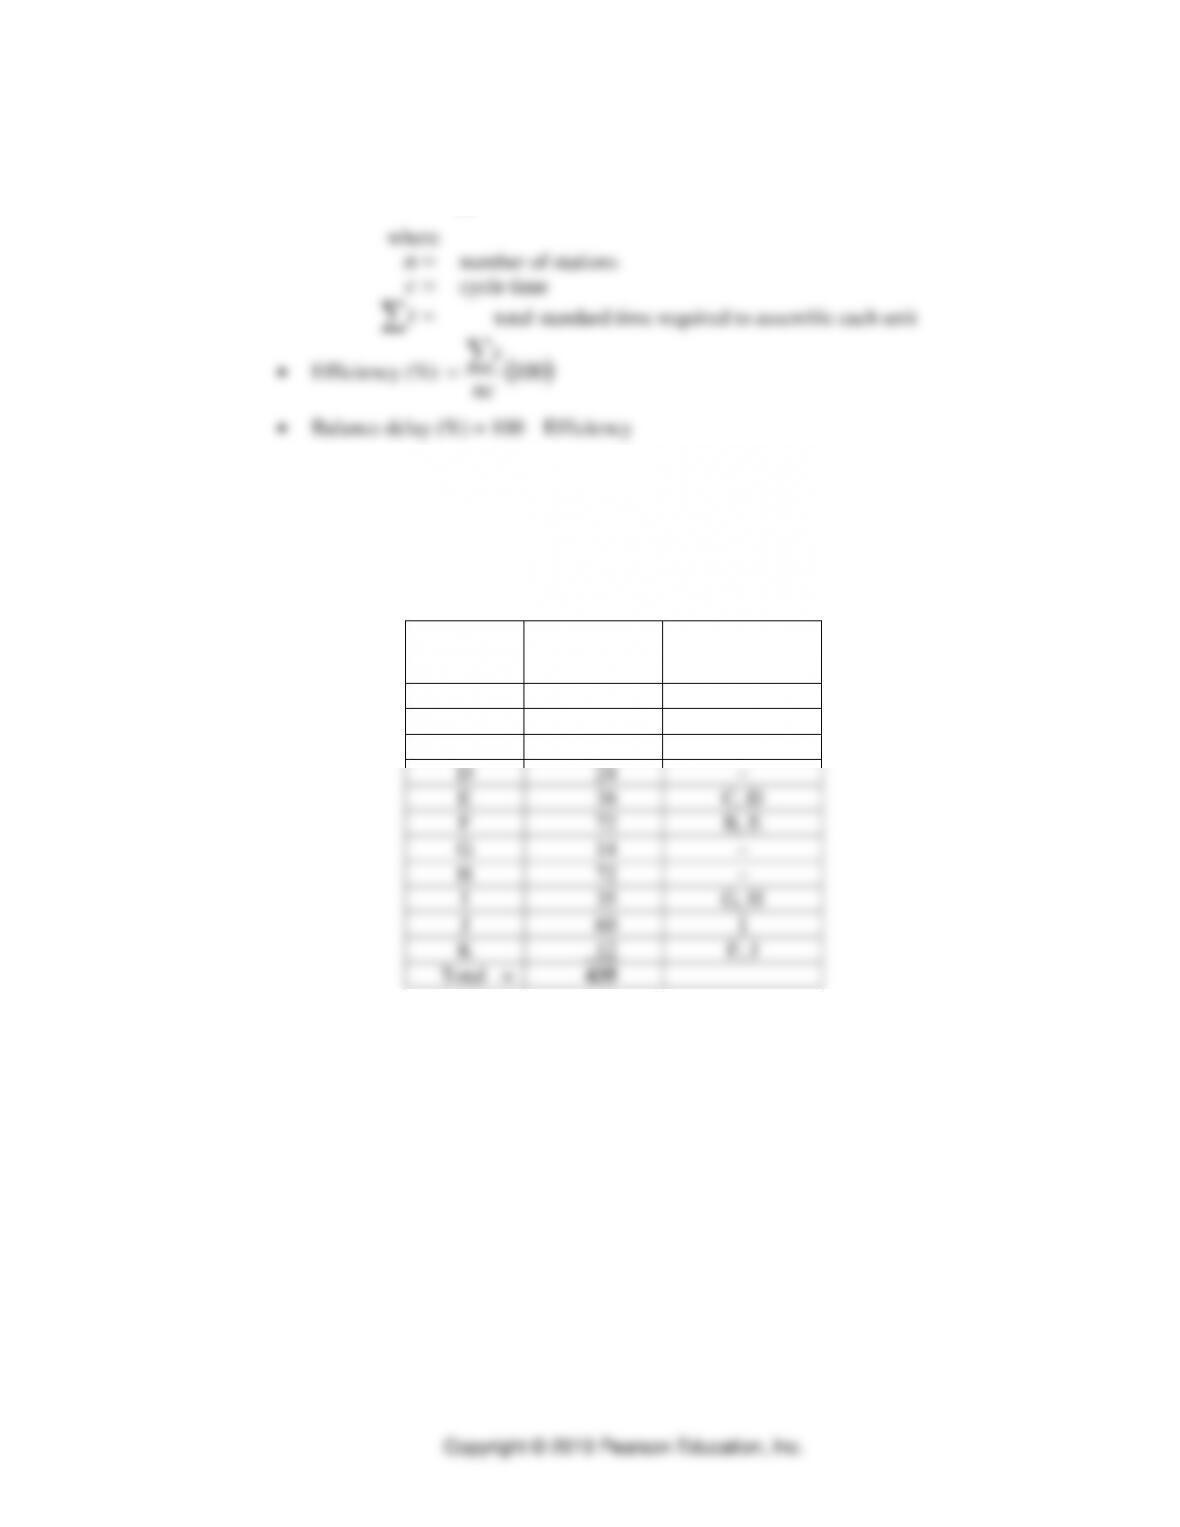
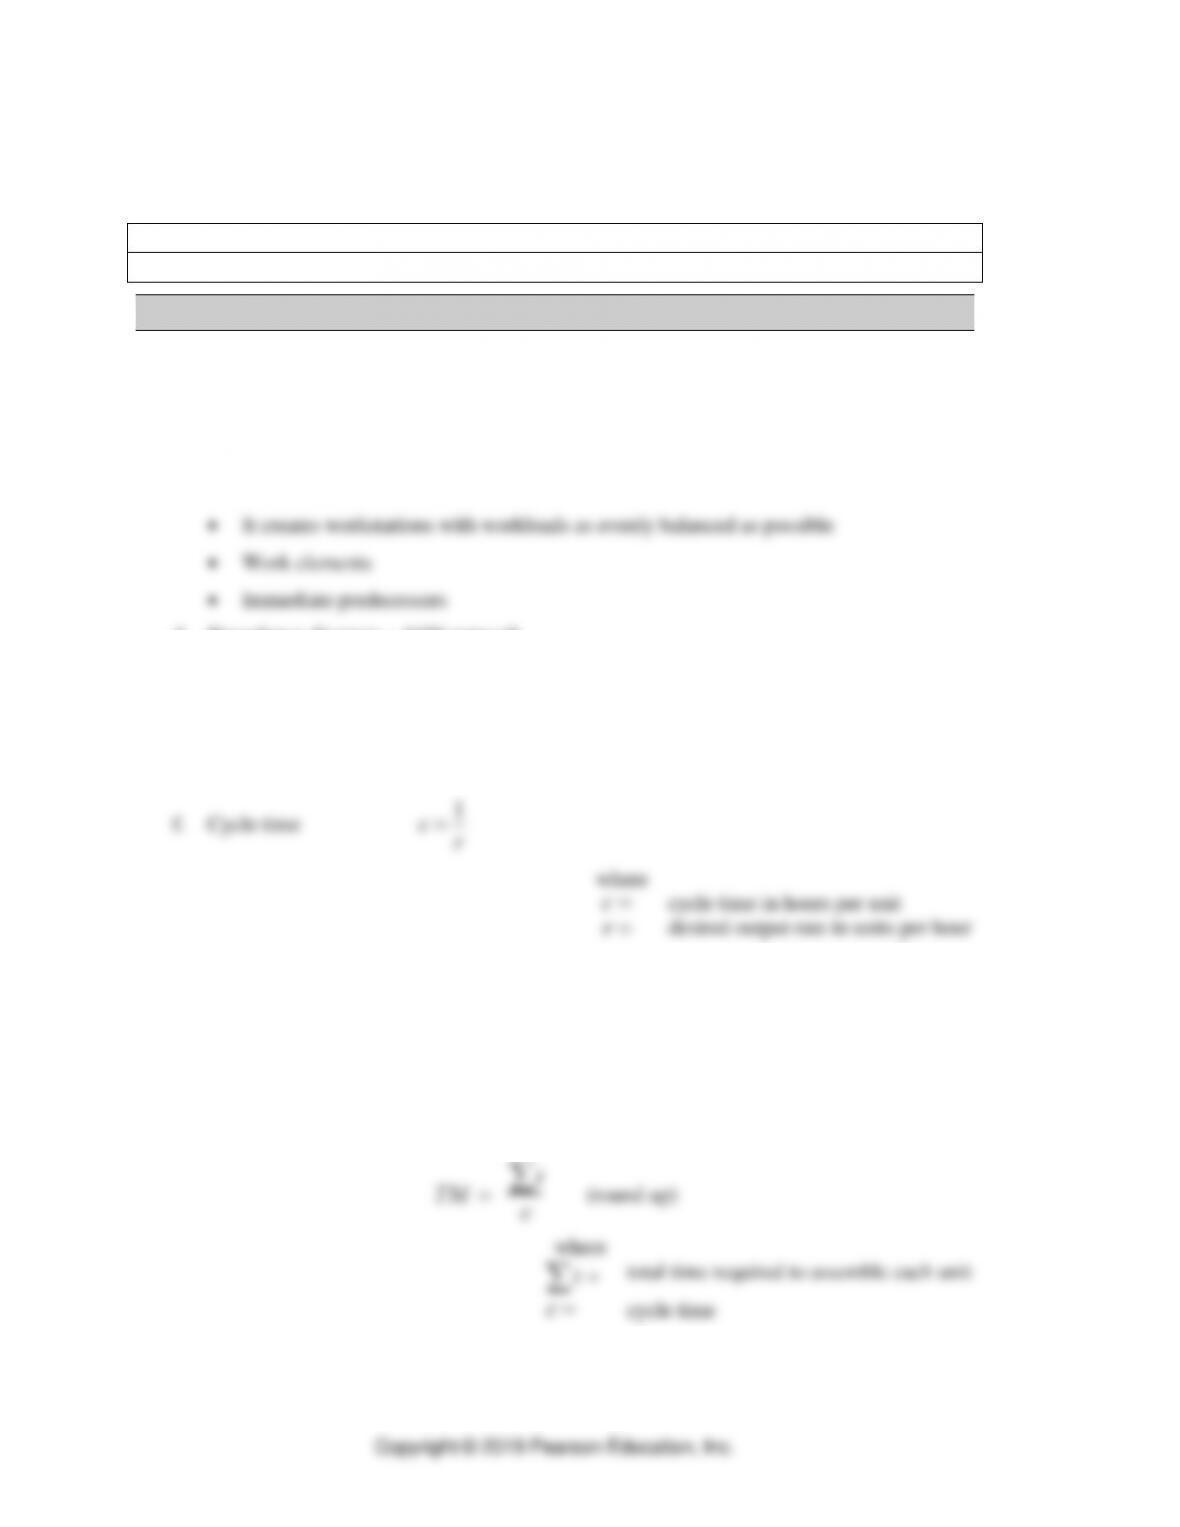
h. Idle time, efficiency, and balance delay
• Idle time
−= tnc
where
=n
number of stations
=c
cycle time
=
t
total standard time required to assemble each unit
• Efficiency (%)
( )
100
nc
t
=
• Balance delay (%) = 100 – Efficiency
Use Application 5.3 for an in-class example of drawing a precedence diagram, and then
calculate the cycle time, the theoretical number of stations, and the various performance
measures.
A plant manager needs a design for an assembly line to assembly a new product that is being
introduced. The time requirements and immediate predecessors for the work elements are as
follows:
Work
Element
Time (sec)
Immediate
Predecessor
A
12
–
B
60
A
C
36
–
D
24
–
E
38
C, D
F
72
B, E
G
14
–
H
72
–
I
35
G, H
J
60
I
K
12
F, J
Total =
435
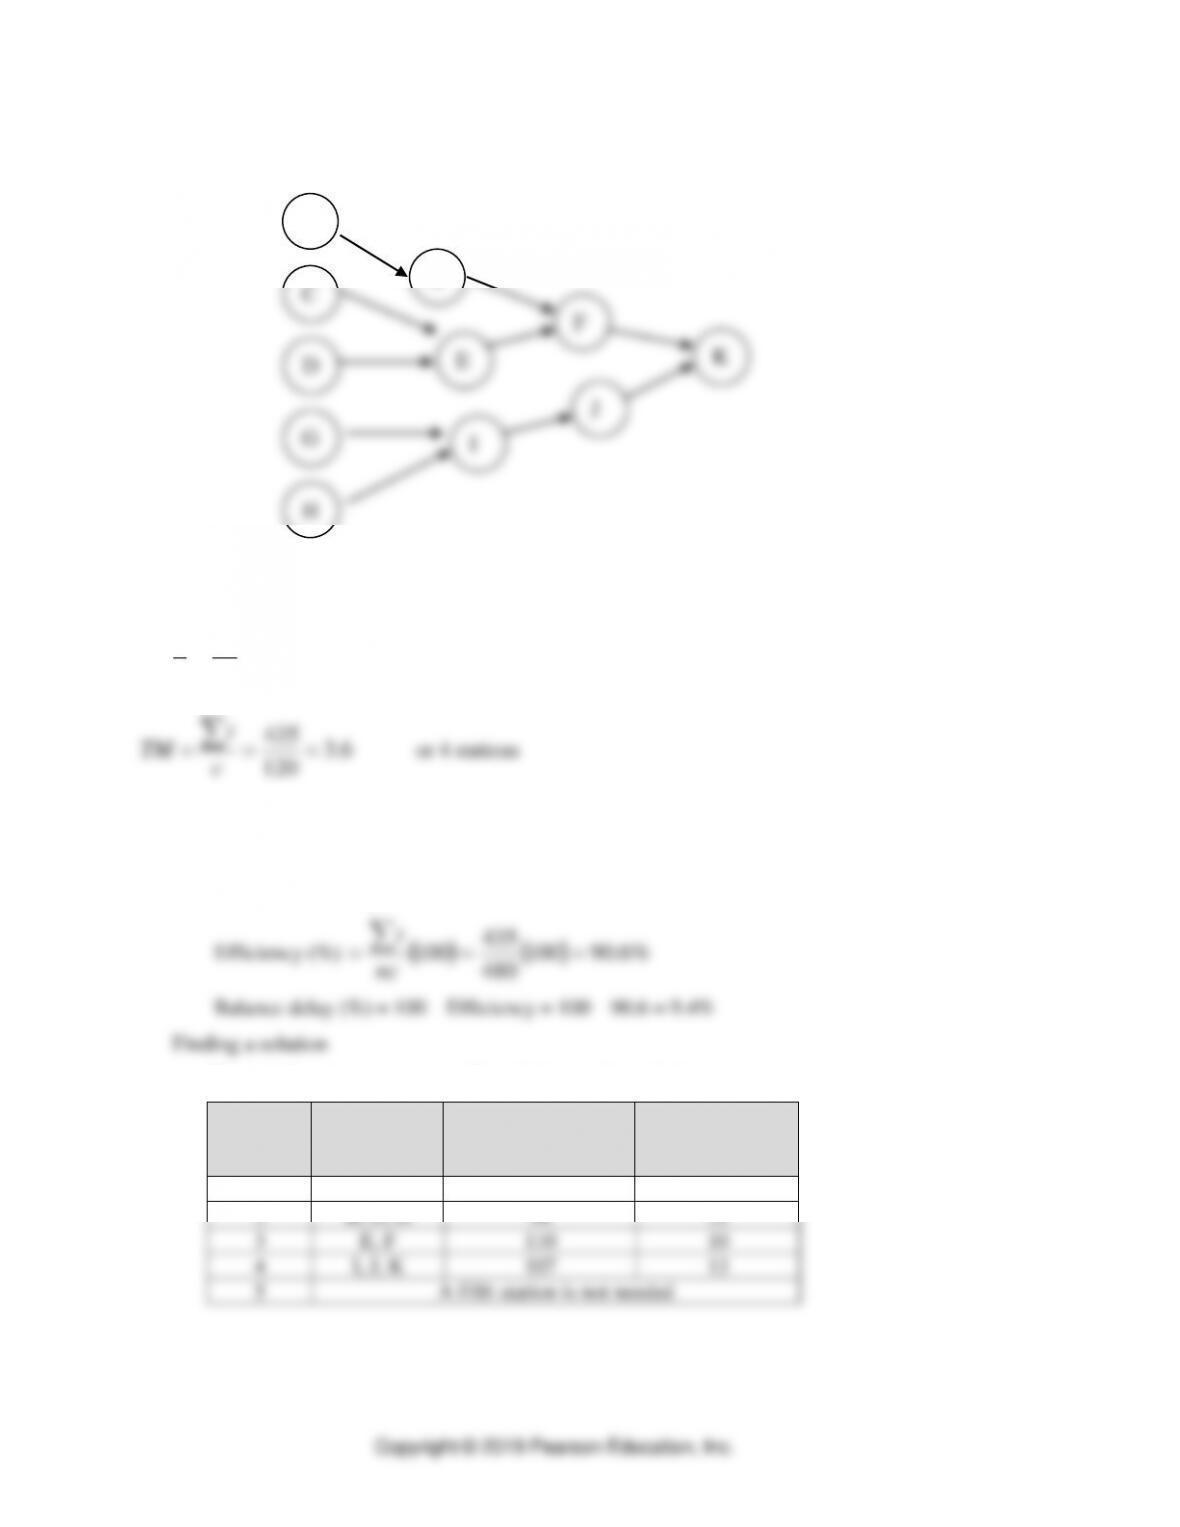
Draw a precedence diagram. Students complete I, F, J and K.
If the desired output rate is 30 units per hour, what are the cycle time and theoretical
minimum?
( )
1203600
30
11
=== r
c
sec/unit
6.3
120
435
===
c
t
TM
or 4 stations
Suppose that we are fortunate enough to find a solution with just four stations. What is
the idle time per unit, efficiency, and the balance delay for this solution?
Idle time
( )
sec454351204=−=−= tnc
435
t
Using trial and error, one possible solution is shown below.
Station
Work
Elements
Assigned
Cumulative Time
Idle Time
(c = 120)
1
H, C, A
120
0
2
B, D, G
98
22
3
E, F
110
10
4
I, J, K
107
13
5
A fifth station is not needed
A
B
C
H
G
2. Rebalancing the Assembly Line
a. Use MANAGERIAL PRACTICE 5.1 Assembly Line Balancing at Chrysler
3. Managerial Considerations
a. Pacing
• Allows material handling to be automated
• Requires less inventory storage area
• Is less flexible in handling unexpected delays
b. Behavioral factors
c. Number of models produced
• Mixed-model line
d. Cycle times
TEACHING TIP
Use Experiential Learning 5.1: “Min-Yo Garment Company”
TEACHING TIP
Use Video Case: “Constraint Management at Southwest Airlines”


