Chapter
12 Supply Chain Design
TEACHING TIP
The firm’s operations strategy and competitive priorities guide its supply chain choices. Supply
chain management is the synchronization of a firm’s processes with those of its suppliers and
customers to match the flow of materials, services, and information. This chapter discusses the
important measures of supply chain performance and shows how sound supply chain design can
improve key financial measures.
1. Creating an Effective Supply Chain
• Pressures to create an effective supply chain are
o dynamic sales volumes
o customer service and quality expectations
o service/product proliferation
o emerging markets.
• The firm’s operations strategy and competitive priorities guide its supply chain choices.
Three major areas of focus, as seen in Figure 12.1, are:
• Link Service/Products with Internal Processes.
• Link Services/Products with the External Supply Chain.
• Link Services/Products with Customers, Suppliers and Supply Chain Processes
• Figure 12.2 Supply Chain Efficiency is the motivation for this chapter. The blue line is an
efficiency curve, which shows the trade-offs between costs and performance for the current
supply chain design. Suppose the red line is actual costs and performance, then the challenge
is to move operations into the tinted area close to the curve. This could be accomplished by:
o Better forecasting
o Inventory management
o Operations planning and scheduling
o Resource planning
• Improving the design of the supply chain in accordance with a sound strategy moves the
curve to the right as shown by the dashed red line. The goal is to reduce costs as well as
increase performance. Design options include:
o Strategic options
▪ Mass customization
▪ Outsourcing
o Logistic network options
▪ Facility locations
▪ Placement of inventories
o Integration options
▪ Supply chain collaboration
▪ Supplier selection
o Sustainability options
2. Supply Chains for Services and Manufacturing
• The goal is to reduce costs as well increase performance.
• Supply chains must be managed to coordinate the inputs with the outputs in a firm to achieve
the appropriate competitive priorities of the firm’s enterprise processes.
• The Internet offers firms an alternative to traditional methods for managing the supply chain.
• A supply chain strategy is essential for service as well as manufacturing firms.
• Every firm or organization is a member of some supply chain.
1. Services
a. Driven by the need to provide support for the essential elements of the various service
packages it delivers.
TEACHING TIP
Mention the “Flowers-on-Demand” florist example.
2. Manufacturing
a. A fundamental purpose of supply chain design for manufacturers is to control inventory
by managing the flow of materials.
b. Suppliers are often identified by their position in the supply chain. It is important to
elaborate on the “tiers” in a supply chain and that supply chains may involve suppliers
and customers throughout the world. Refer to Fig. 9.3.
3. Measuring Supply Chain Performance
1. Inventory measures
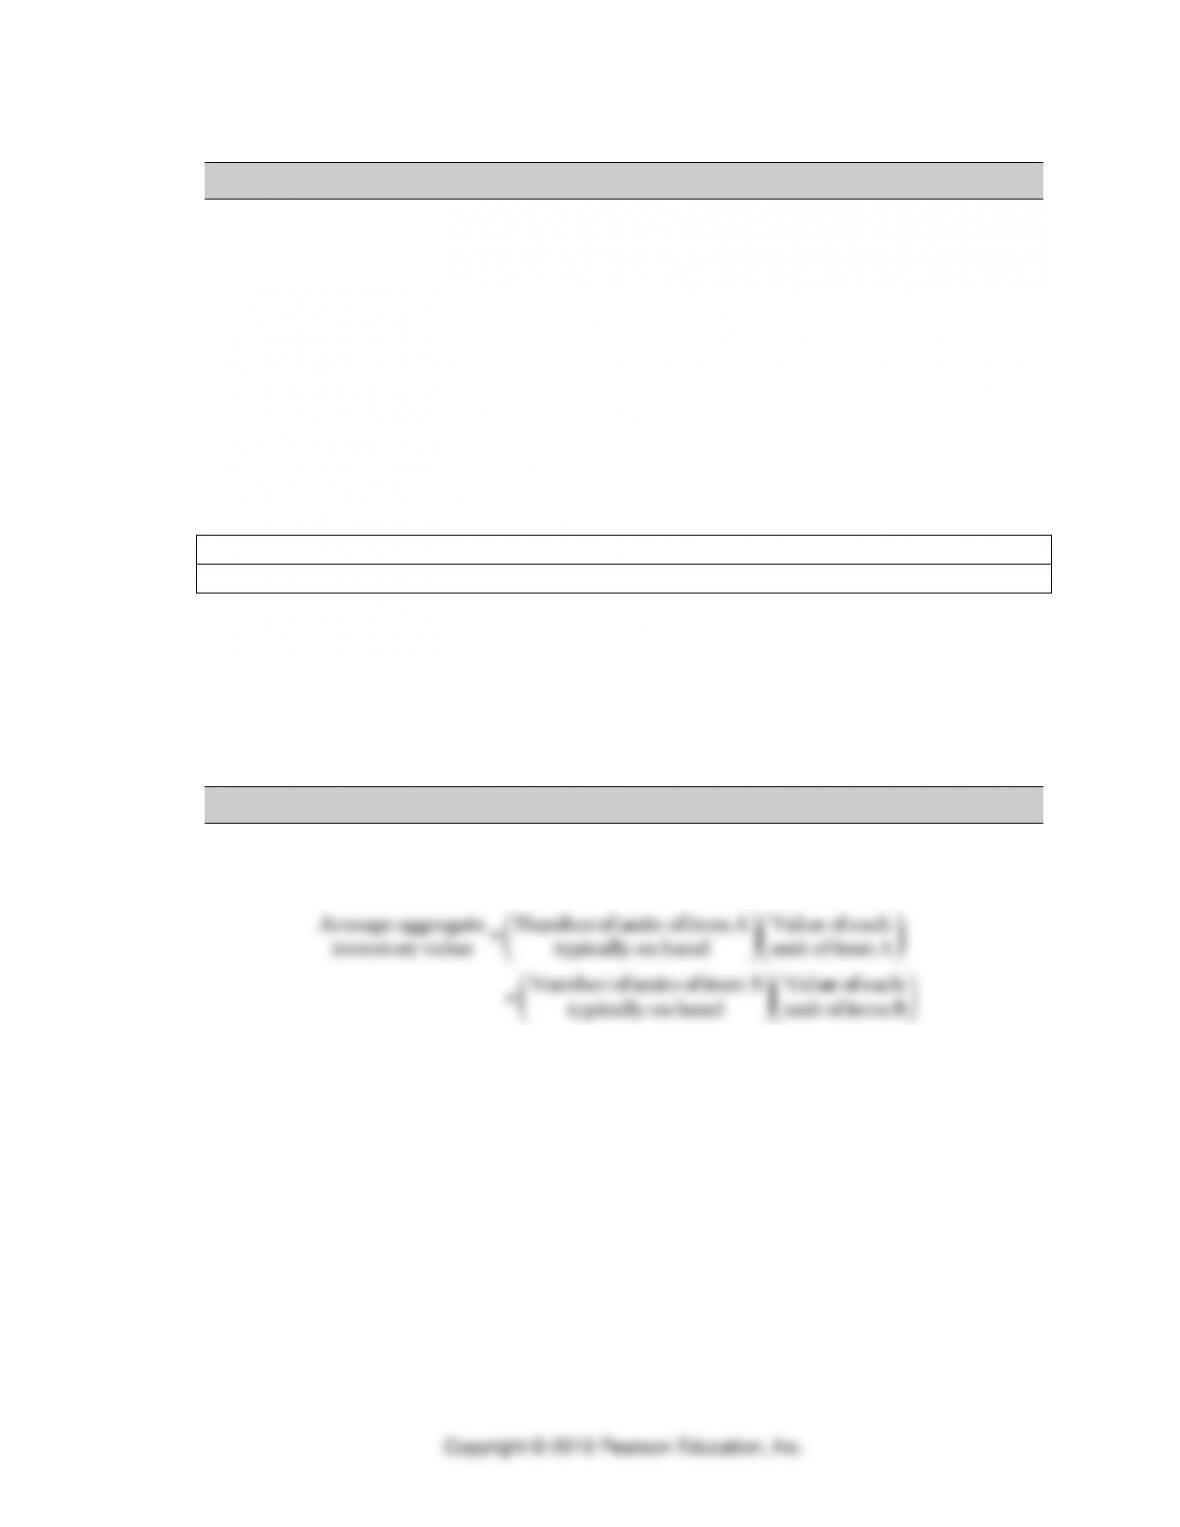
a. Average aggregate inventory value
• Total value of all items held in inventory by a firm.
• Expressed in dollar values because the sum of individual items in raw materials,
work-in-process, and finished goods values can be determined.
• It is an average because it usually represents the inventory investment over some
period of time.
• This tells managers how much of a firm’s assets are tied up in inventory.
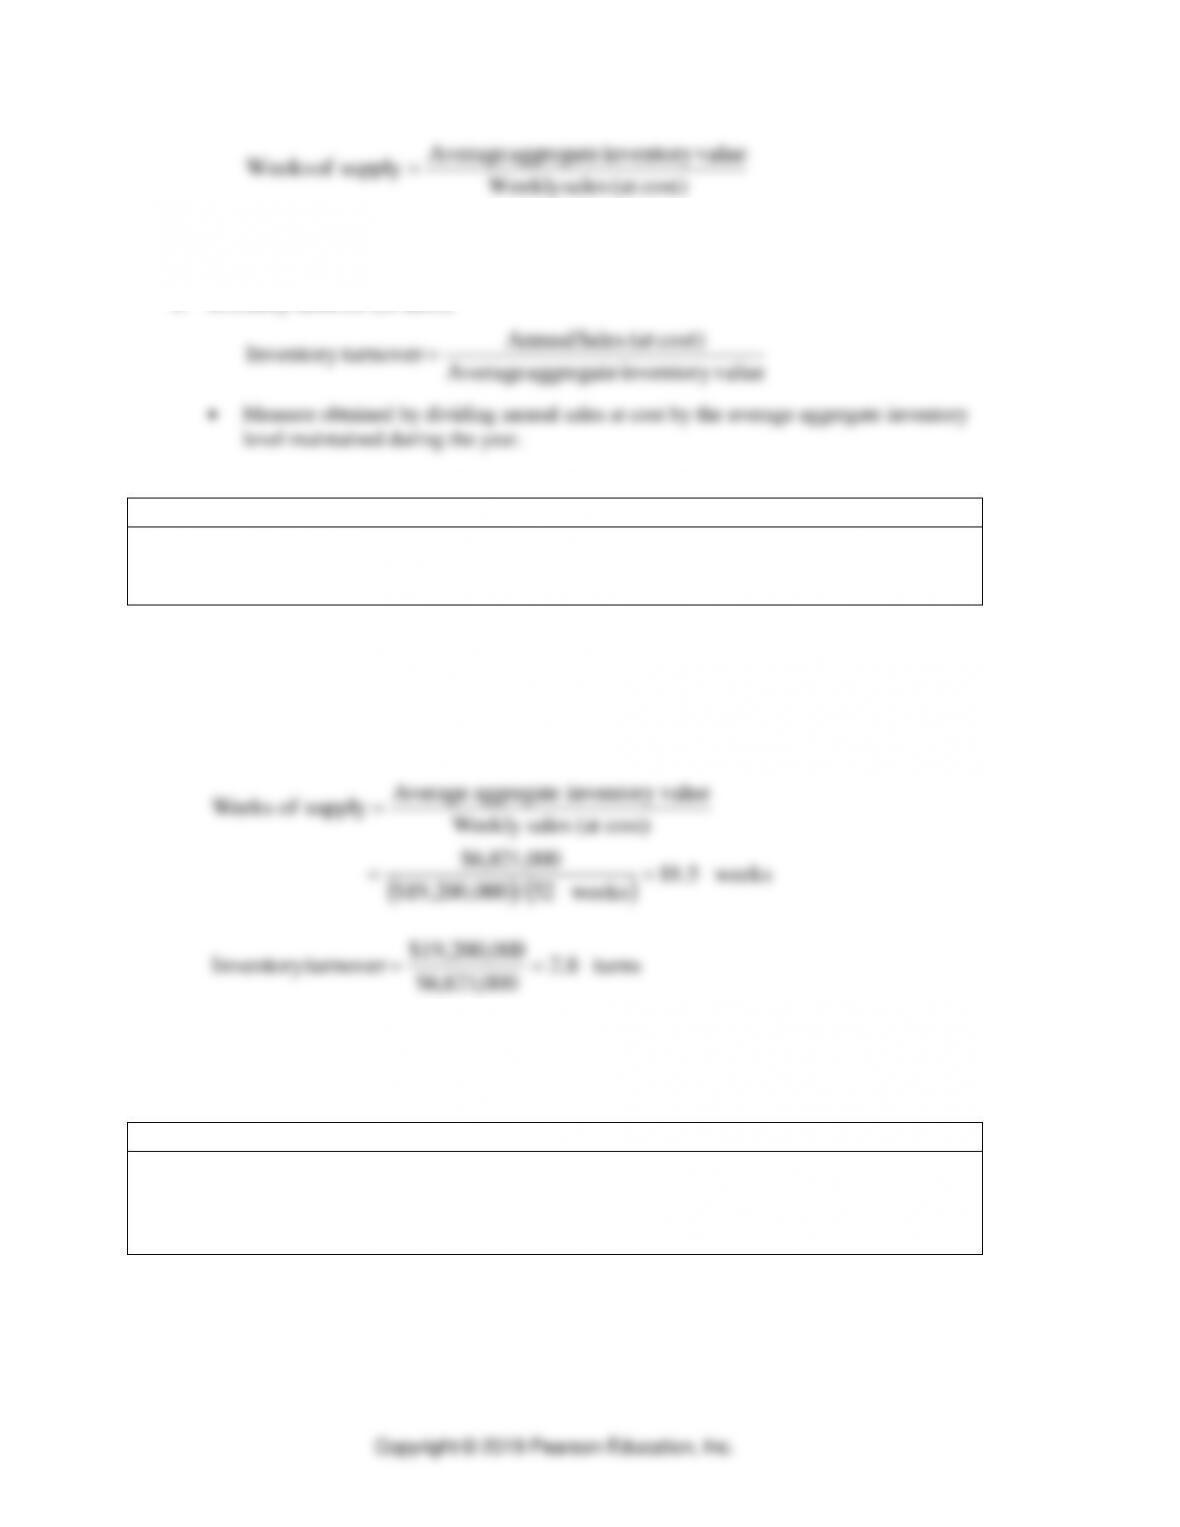
b. Weeks of supply
• Measure obtained by dividing the average aggregate inventory value by sales by sales
per week at cost.
• Formula expressed
Copyright © 2019 Pearson Education, Inc.
cost)(at salesWeekly
valueinventory aggregate Average
supply of Weeks =
• This cost is referred to as the cost of goods sold.
• In some low-inventory operations, days or even hours are a better unit of time.
c. Inventory turnover (or turns)
valueinventory aggregate Average
cost)(at Sales Annual
turnoverInventory =
• Measure obtained by dividing annual sales at cost by the average aggregate inventory
level maintained during the year.
TEACHING TIP
Note that inventory turns or weeks of supply can be calculated for an individual item as opposed
to an entire inventory. In such a case you can perform the calculations in ‘units’ rather than
costs.
d. Calculating Weeks of supply and Inventory turnover. Use Application 12.1:
A recent accounting statement showed total inventories (raw materials + WIP + finished
goods) to be $6,821,000. This year’s “cost of goods sold” is $19.2 million. The company
operates 52 weeks per year. How many weeks of supply are being held? What is the
inventory turnover?
( ) ( )
weeks5.18
weeks52000,200,19$
000,821,6$
cost)(at salesWeekly
valueinventory aggregate Average
supply of Weeks
==
=
turns8.2
000,821,6$
0$19,200,00
turnoverInventory ==
e. Tutor 12.1 in MyLab Operations Management provides a new example to practice the
calculation of inventory measures.
2. Financial measures
TEACHING TIP
Students do not have a difficult time with the weeks of supply or the inventory turns calculations,
but they have a lot of difficulty understanding how these measures relate to typical financial
measures they discuss in accounting or finance classes. Reserve some time to discuss the
following measures and how they relate to the inventory measures.
a. Total revenue
• Increasing the percent of on-time deliveries to customers will increase total revenue
because satisfied customers will buy more services and products.
• Increasing the percent of on-time deliveries from suppliers has the effect of reducing
the costs of inventories, which has implications for the cost of goods sold and
contribution margins.
b. Cost of goods sold
• Being able to buy materials at a better price and process, or transform them more
efficiently, will improve the firm’s cost of goods sold, and ultimately net income.
• Improvements will also have an effect on contribution margin.
c. Operating expenses
• Designing a supply chain with minimal capital investment can reduce depreciation
charges.
d. Cash flow
• Cash-to-cash is the time lag between paying for services and materials needed to
produce a service or product and receiving payment for it.
• The shorter the time lag, the better the cash flow position of the firm because it needs
less working capital.
• The goal is to have a negative cash-to-cash situation, which is possible when the
customer pays for service or product before the firm has to pay for the resources and
materials needed to produce it.
e. Working capital
• Money used to finance ongoing operations.
• Decreasing weeks of supply or increasing inventory turns reduces the working capital
needed to finance inventories.
f. Return on assets
• Techniques for reducing inventory, transportation, and operating costs related to
resource usage and scheduling are discussed in the chapters to follow.
TEACHING TIP
Figure 12.6 shows how supply chain decisions can affect ROA, which is net income divided
by total assets. Reducing aggregate inventory investment and fixed investment, or increasing
net income by better cost management, will increase ROA.
4. Strategic Options for Supply Chain Design
1. Efficient supply chains
a. Works best in environments where
• Demand: predictable, low forecast errors
• Product variety: low
b. Common Designs: There is one popular design for efficient supply chains.
• Make-to-stock (MTS)
2. Responsive supply chains
a. Designed to react quickly in order to hedge against uncertainties in demand.
b. Common Designs: There are three popular designs for responsive supply chains.
c. Works best in environments where
• Demand: unpredictable, high forecast errors
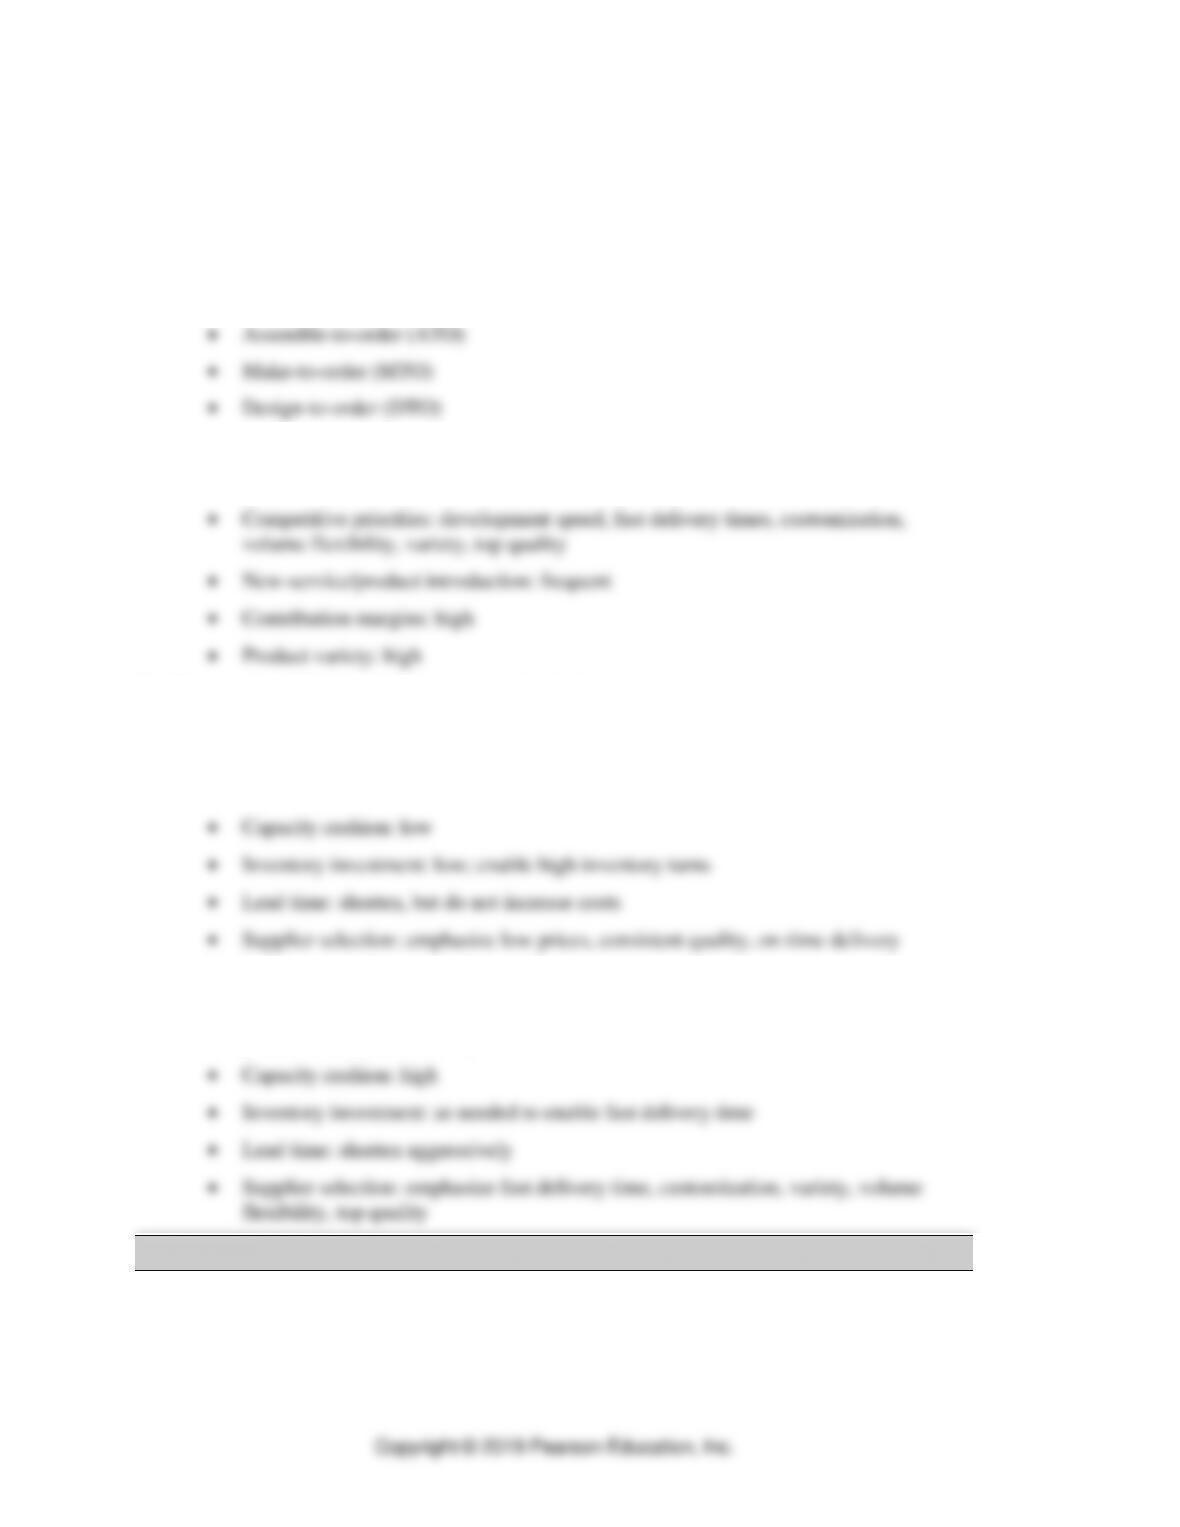
3. Designs for efficient and responsive supply chains
a. Factors for efficient supply chains
• Common designs: make-to–stock or standardized services or products; emphasize
high volumes
b. Factors for responsive supply chains
• Common designs: assemble-to-order, make-to-order, or customized services or
products; emphasize variety
5. Mass Customization
1. Competitive advantages
a. Managing customer relationships
b. Eliminating finished goods inventory
c. Increasing perceived value of services or products
2. Supply chain design for mass customization
a. Assemble-to-order strategy
b. Modular design
c. Postponement
• Channel assembly
6. Outsourcing Process
• Outsourcing: paying suppliers and distributors to perform those processes and provide needed
services and materials
• Offshoring: Involves moving processes to another country.
• Next-shoring: supply chain strategy that involves locating processes in close proximity to
customer demand or product R&D.
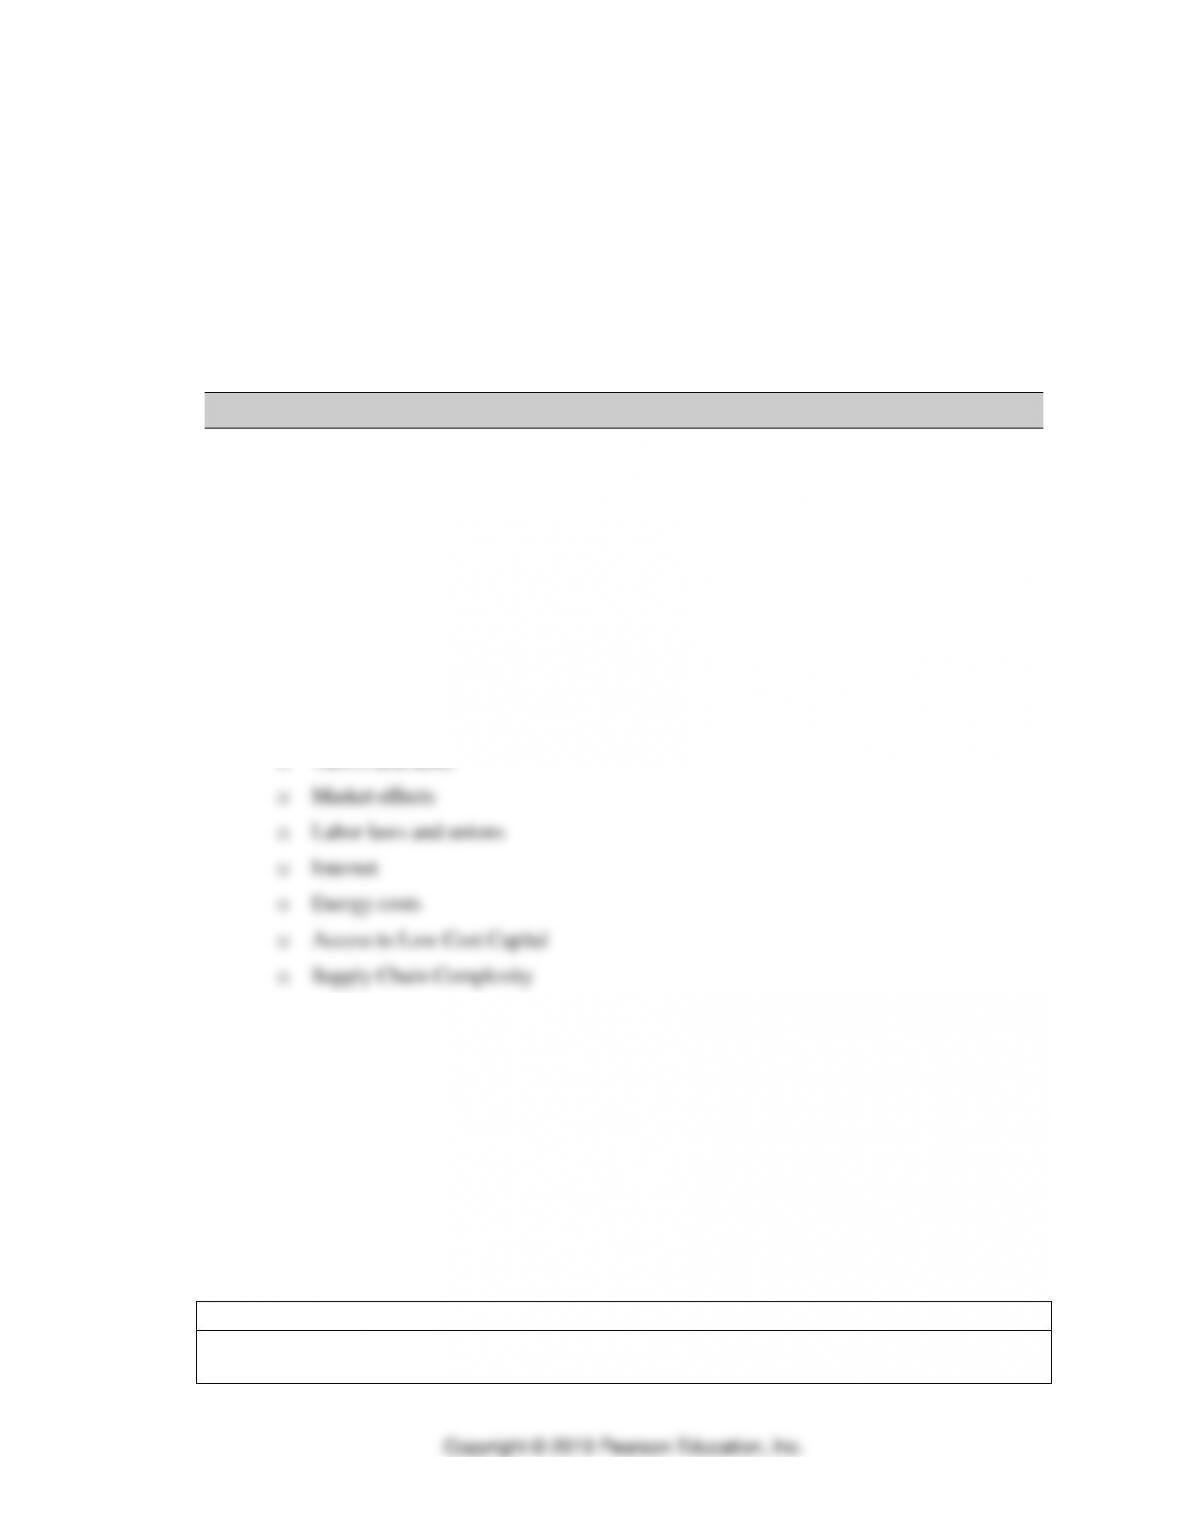
• Decision Factors to outsourcing
o Comparative labor costs
o Rework and product returns
o Logistics costs
o Tariffs and taxes
• Potential Pitfalls
o Pulling the plug too quickly
▪ decide to outsource a process before making a good-faith effort to fix the
existing one.
o Technology transfer
▪ strategy involves creating a joint venture with a company in another country.
o Process integration
▪ difficult to fully integrate outsourced processes with the firm’s other
processes
TEACHING TIP
Managerial Practice 12.1 “Outsourcing in the Food Delivery Business” reveals the impact of
technology on the ordering process.
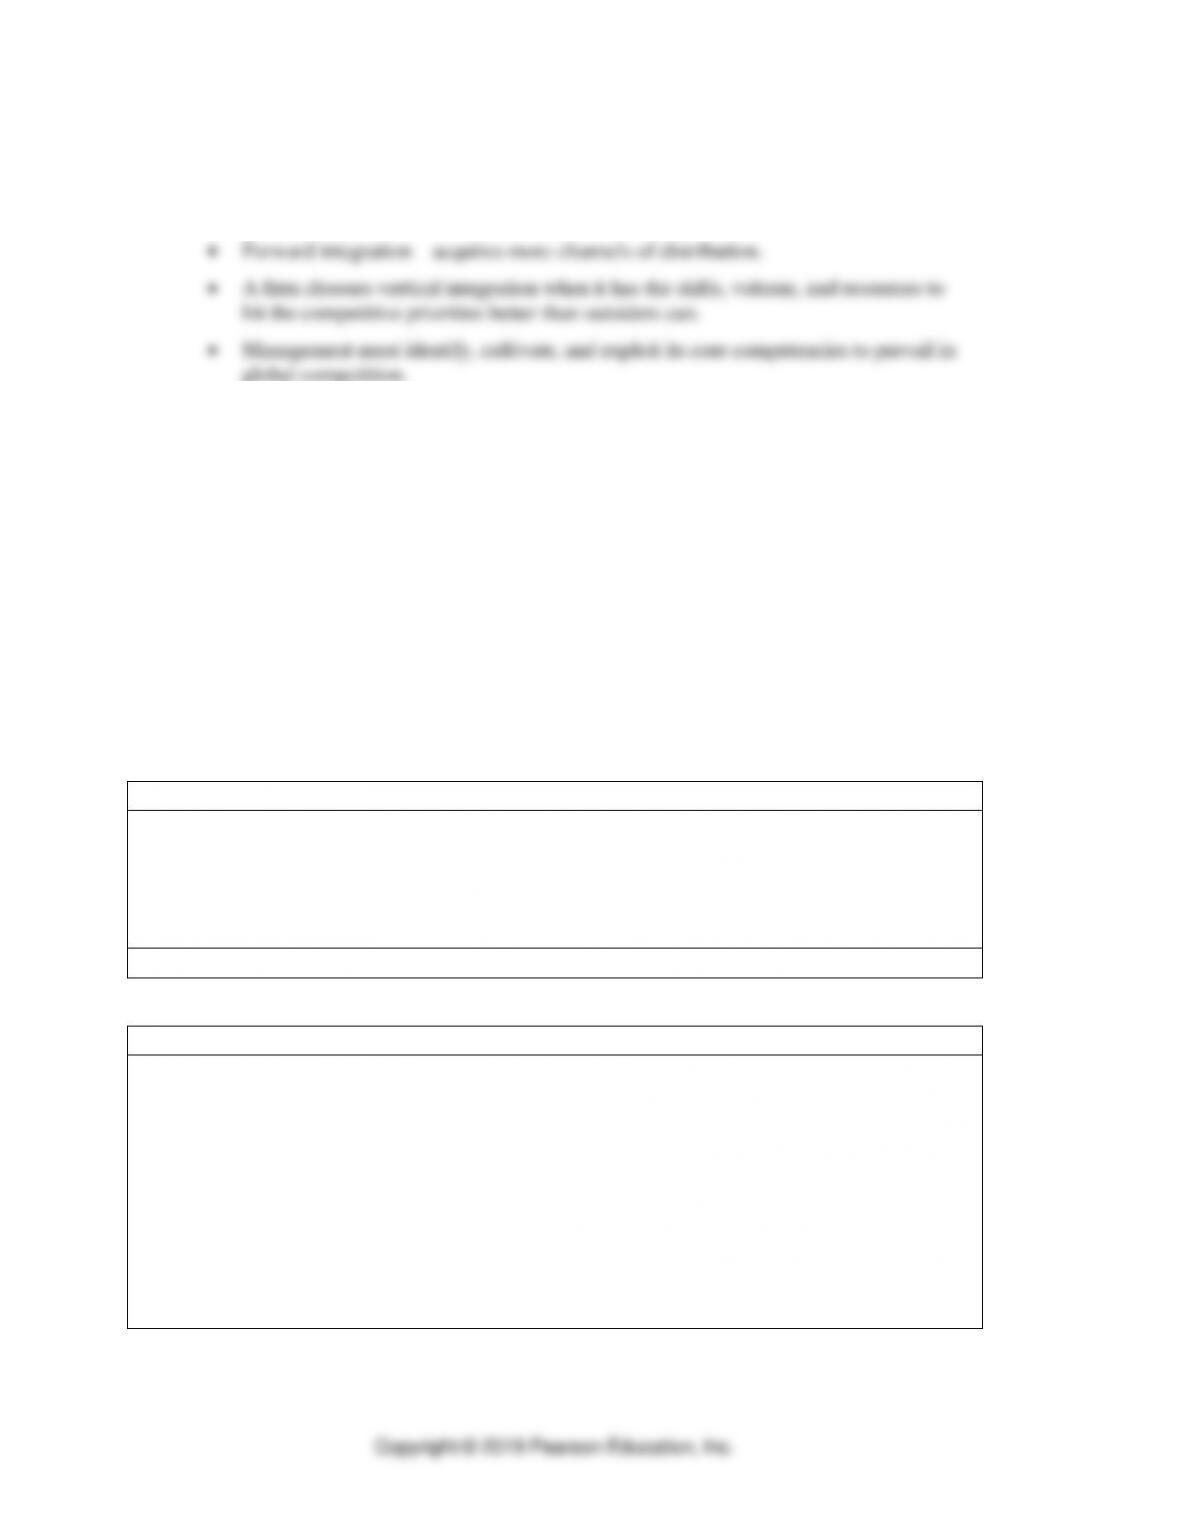
1. Vertical integration
• Backward integration—toward the sources of raw materials, parts, and services
through acquisitions.
2. Make-or-buy decision
• Break-even analysis can be found in Supplement A, “Decision Making,” which can be
used for the make-or-buy decision
• From Supplement A, “Decision Making,” the formula for the break-even quantity
yields
Q = (Fm-Fb) / (cb-cm)
• Example 12.2 considers outsourcing the shipping operations to a logistics provider using
break-even analysis.
• Active Model A.2 in MyLab Operations Management provides additional insight on the
make-or-buy decision and its extensions.
• Tutor A.2 provides a new example to practice break-even analysis on the make-or-buy
decisions.
TEACHING TIP
Video case: Supply Chain Design at Crayola
(1) Comparing supply chain design of crayons and ColorWonder.
(2) The company’s forecasters and planners work hard to manage both the raw material
inventory flows from suppliers, and the finished goods flows to downstream customers.
(3) Distribution strategy for crayons vs ColorWonder.
(4) Designing the supply chain for the Washable Deluxe Painting Kit.
TEACHING TIP
Case: Brunswick Distribution, Inc.
The Decisions:
(1) Bradley’s option enables the firm to increase its revenues by serving more customers. The
capital outlay was sizable, and given BDI’s financial situation, any additional financing will be
issued at higher charge than the company’s existing debt. Operationally, given the changing
market and unreliable demand information, Bradley’s option may not necessarily improve the
degrading inventory turnover, but it will help to expand the customer base.
(2) Marianna’s option focuses on serving the firm’s existing customers more efficiently.
The value of the option was its dramatic reduction in costs; however, it was uncertain whether
BDI could hold onto its current upper Midwest customers. Operationally, this option could
improve inventory turnover.