Mishkin • Instructor’s Manual for The Economics of Money, Banking, and Financial Markets, Twelfth Edition 92
Chapter 6
ANSWERS TO QUESTIONS
1. If junk bonds are “junk,” then why do investors buy them?
2. Which should have the higher risk premium on its interest rates, a corporate bond with a
Moody’s Baa rating or a corporate bond with a C rating? Why?
3. Do you think that a U.S. Treasury bill will have a risk premium that is higher than, lower
than, or the same as that of a similar security (in terms of maturity and liquidity) issued by
the government of Colombia?
4. In the fall of 2008, AIG, the largest insurance company in the world at the time, was at risk
of defaulting due to the severity of the global financial crisis. As a result, the U.S.
government stepped in to support AIG with large capital injections and an ownership stake.
How would this affect, if at all, the yield and risk premium on AIG corporate debt?
5. Risk premiums on corporate bonds are usually anticyclical; that is, they decrease during
business cycle expansions and increase during recessions. Why is this so?

Mishkin • Instructor’s Manual for The Economics of Money, Banking, and Financial Markets, Twelfth Edition 96
Copyright © 2019 by Pearson Education, Inc. All rights reserved.
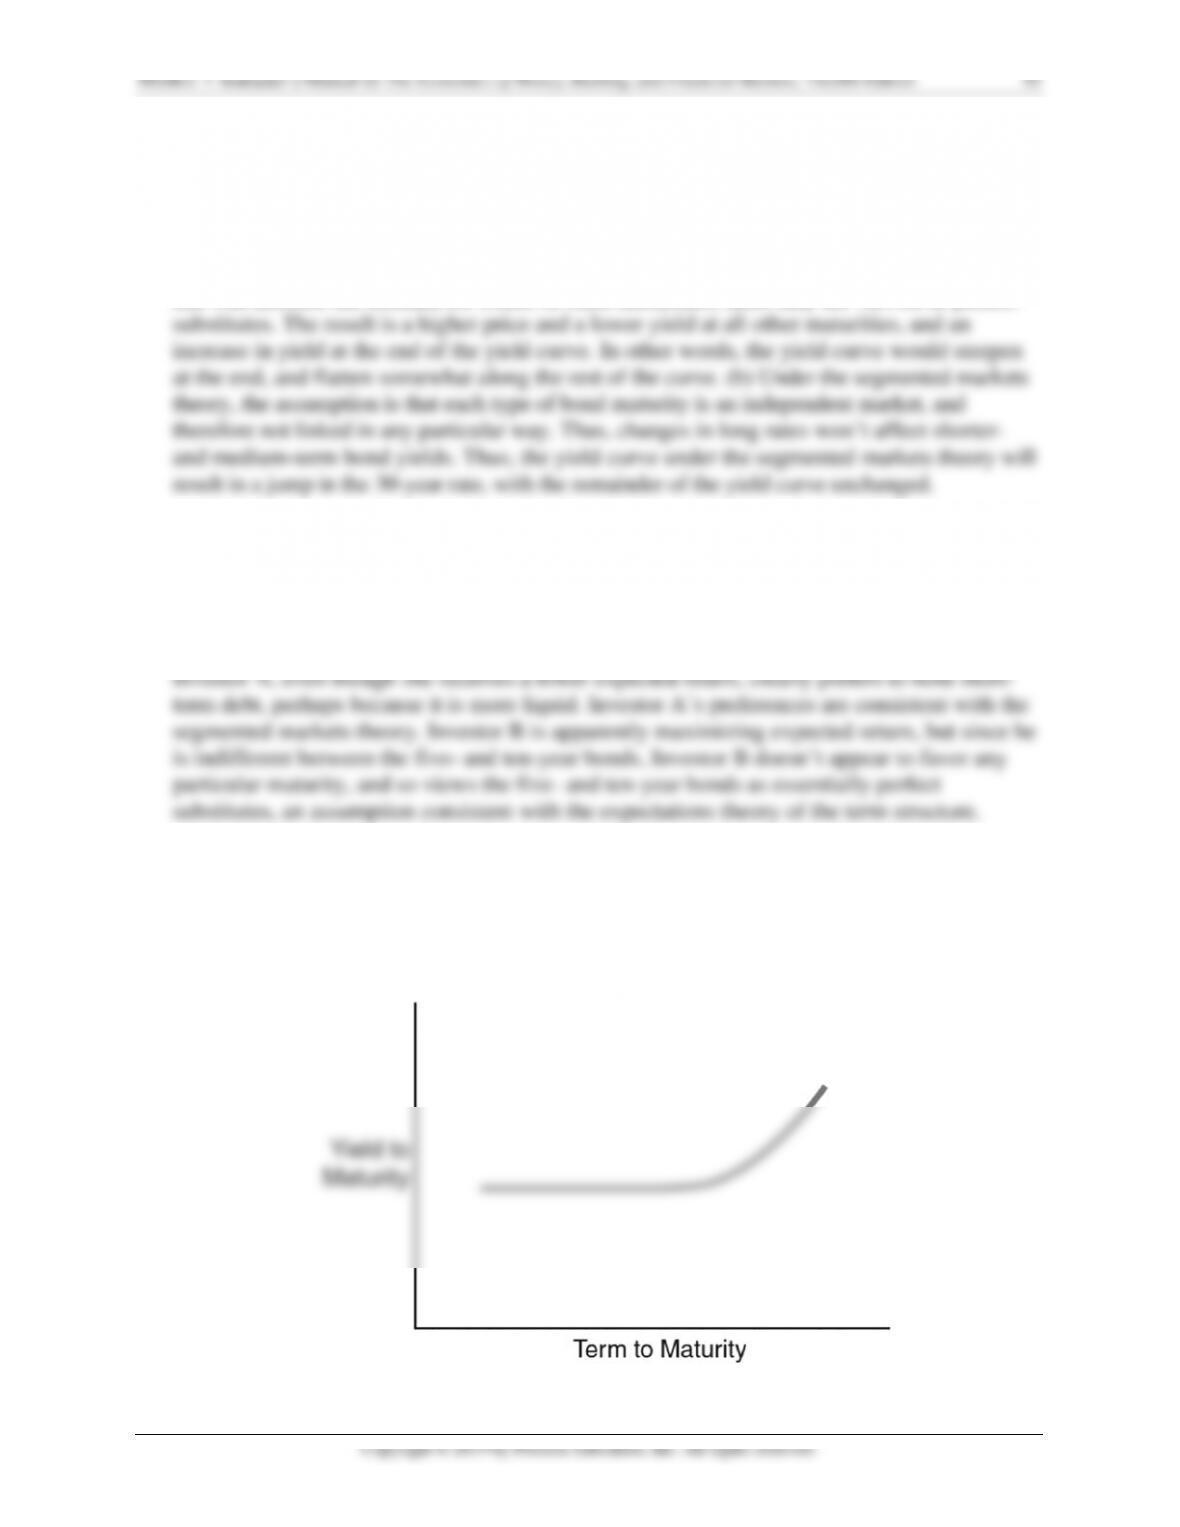
The flat yield curve at shorter maturities suggests that short-term interest rates are expected
to fall moderately in the near future, while the steep upward slope of the yield curve at longer
maturities indicates that interest rates further into the future are expected to rise. Because
interest rates and expected inflation move together, the yield curve suggests that the market
expects inflation to fall moderately in the near future but to rise later on.
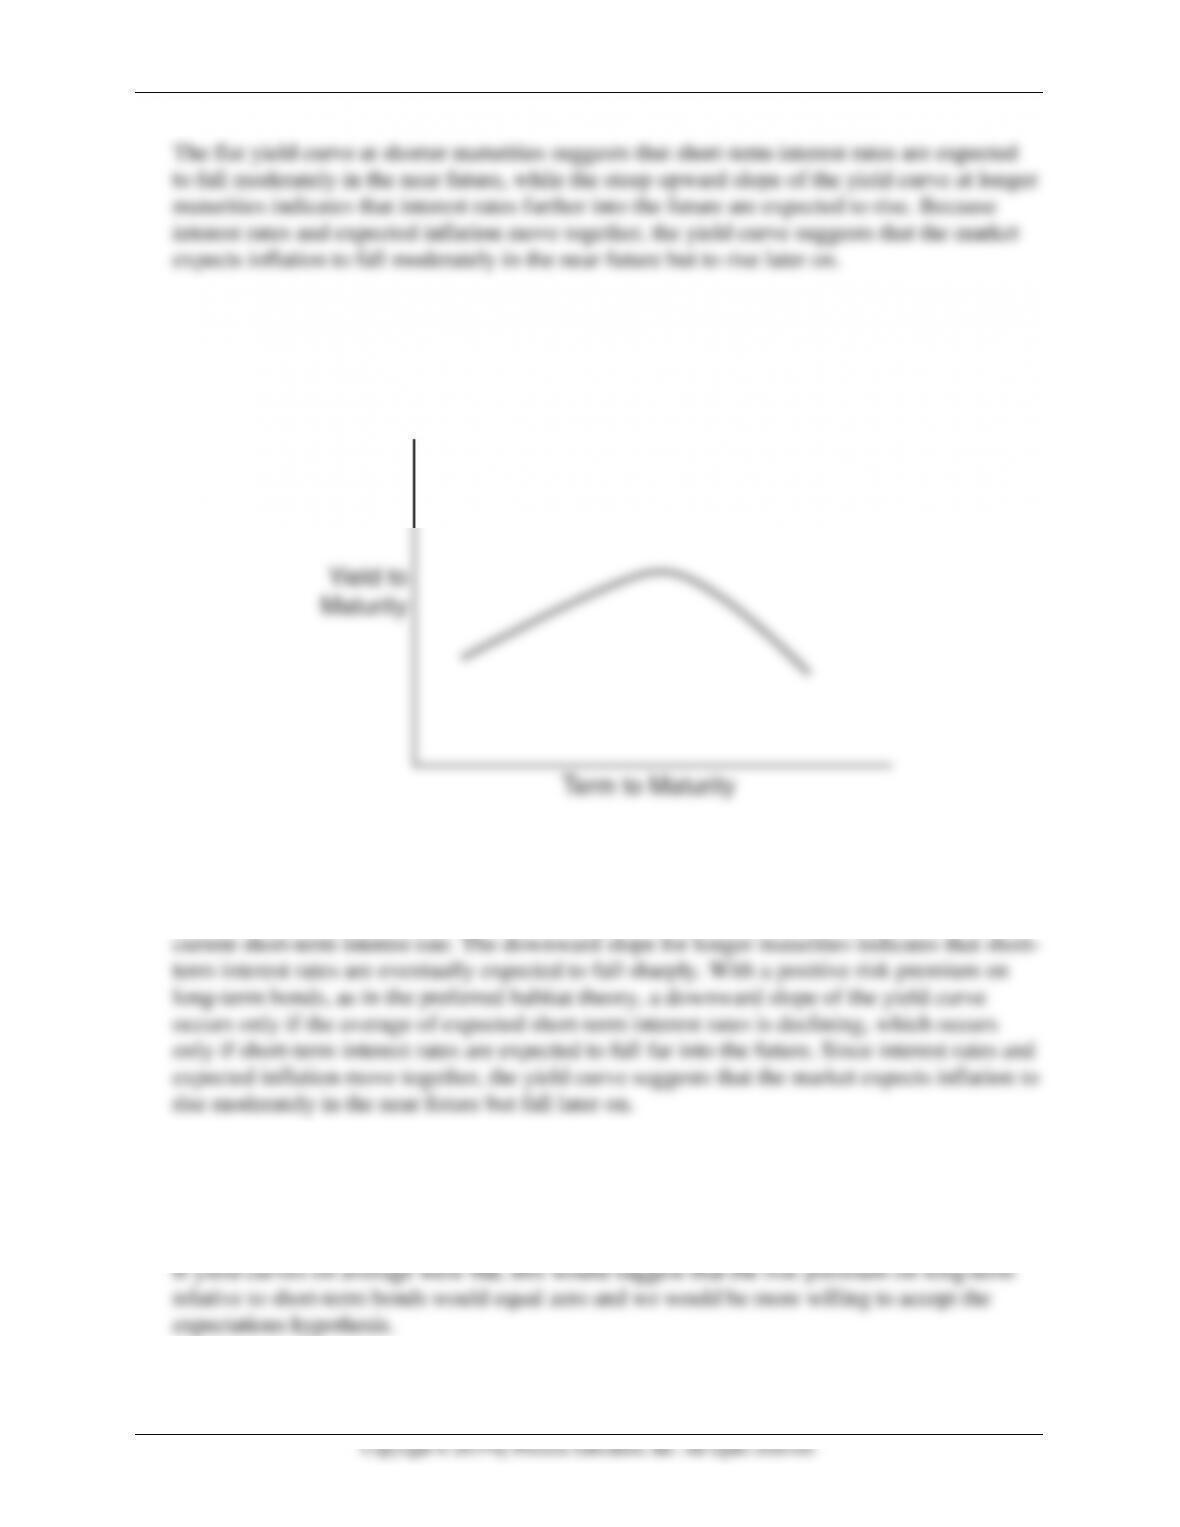
17. If a yield curve looks like the one shown in the figure below, what is the market predicting
about the movement of future short-term interest rates? What might the yield curve indicate
about the market’s predictions for the inflation rate in the future?
The steep upward-sloping yield curve at shorter maturities suggests that short-term interest
rates are expected to rise moderately in the near future because the initial, steep upward slope
indicates that the average of expected short-term interest rates in the near future are above the
18. If yield curves, on average, were flat, what would this say about the liquidity (term)
premiums in the term structure? Would you be more or less willing to accept the expectations
theory?

Mishkin • Instructor’s Manual for The Economics of Money, Banking, and Financial Markets, Twelfth Edition 98
(a) The yield to maturity would be 5% for a one-year bond, 6% for a two-year bond, 6.33%
for a three-year bond, 6.5% for a four-year bond, and 6.6% for a five-year bond. (b) The
24. Assuming the expectations theory is the correct theory of the term structure, calculate the
interest rates in the term structure for maturities of one to five years, and plot the resulting
yield curves for the following paths of one-year interest rates over the next five years:
a. 5%, 6%, 7%, 6%, 5%
b. 5%, 4%, 3%, 4%, 5%
How would your yield curves change if people preferred shorter-term bonds over longer-
term bonds?
(a) The yield to maturity would be 5% for a one-year bond, 5.5% for a two-year bond, 6% for
a three-year bond, 6% for a four-year bond, and 5.8% for a five-year bond; (b) the yield to
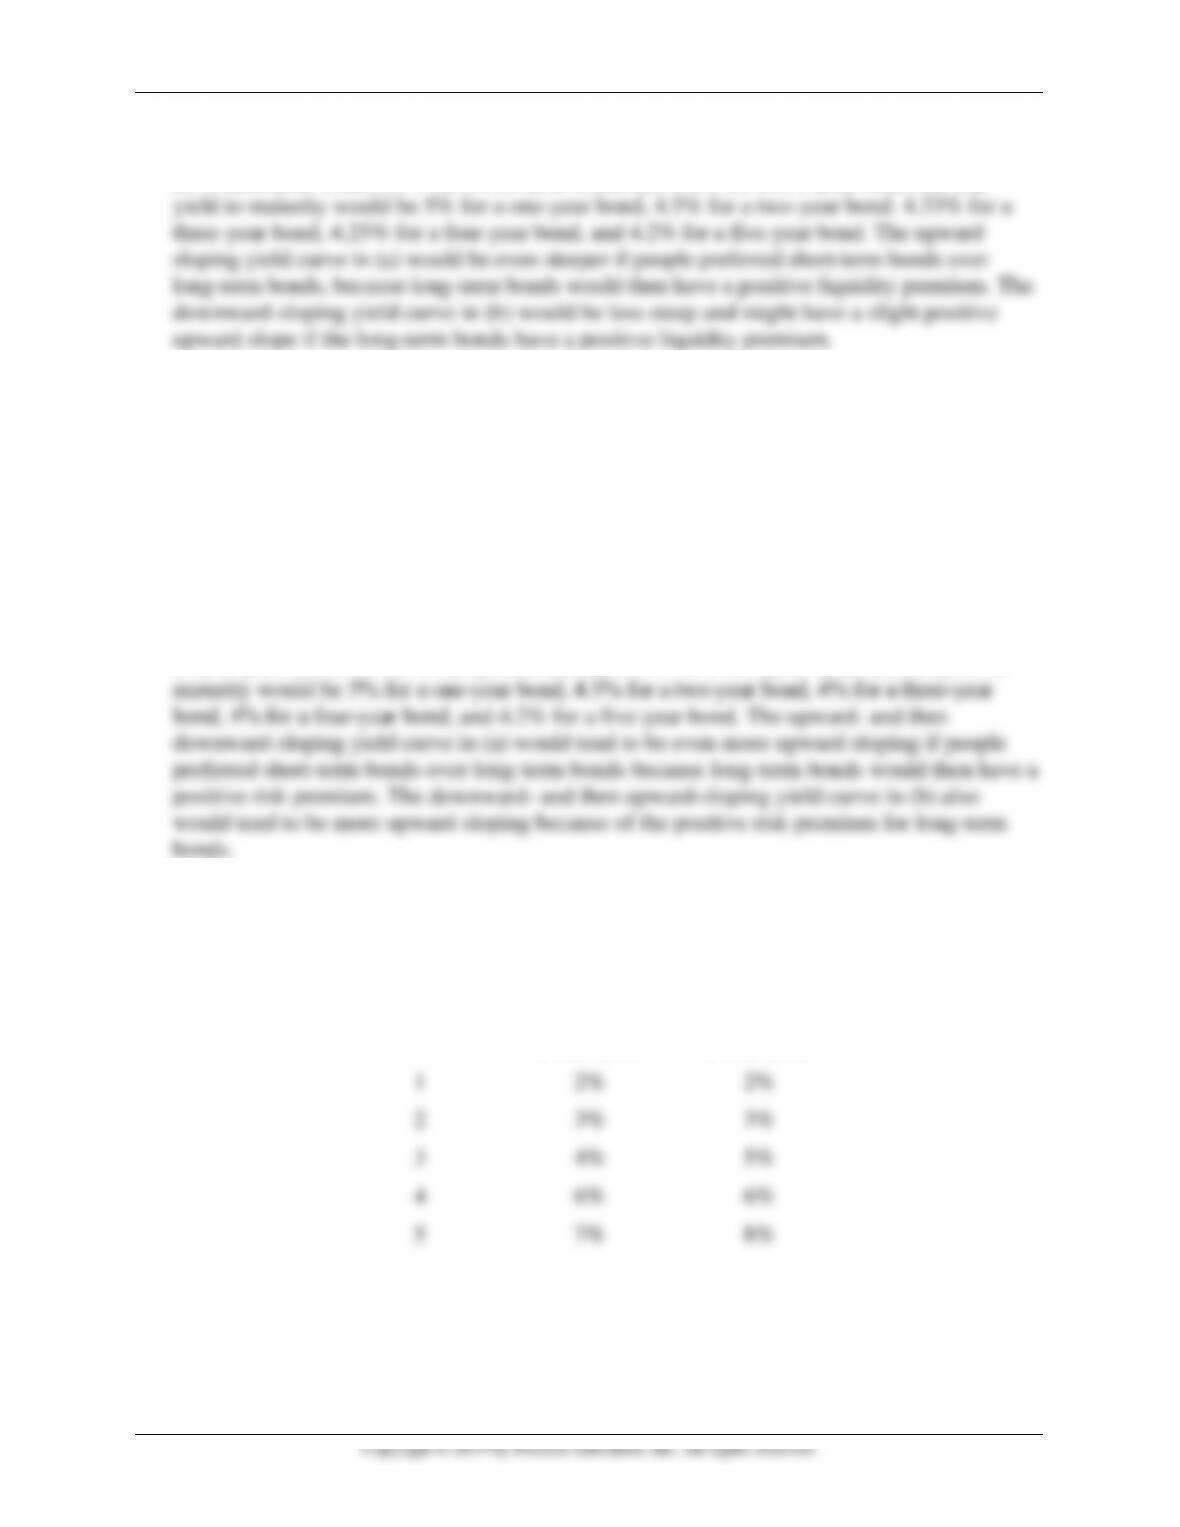
25. The table below shows current and expected future one-year interest rates, as well as current
interest rates on multiyear bonds. Use the table to calculate the liquidity premium for each
multiyear bond.
Year
One-Year
Bond Rate
Multiyear
Bond Rate
1
2%
2%
2
3%
3%
3
4%
5%
4
6%
6%
5
7%
8%
Mishkin • Instructor’s Manual for The Economics of Money, Banking, and Financial Markets, Twelfth Edition 99
The liquidity premium for a given year is the current rate on a multiyear horizon bond minus
the average of expected one year interest rates over that horizon. Thus, the liquidity
ANSWERS TO DATA ANALYSIS PROBLEMS
1. Go to the St. Louis Federal Reserve FRED database and find data on Moody’s Aaa
corporate bond yield (AAA) and Moody’s Baa corporate bond yield (BAA). Download the
data into a spreadsheet.
a. Calculate the spread (difference) between the Baa and Aaa corporate bond yields for the
most recent month of data available. What does this difference represent?
b. Calculate the spread again, for the same month but one year prior, and compare the
result to your answer to part (a). What do your answers say about how the risk premium
has changed over the past year?
c. Identify the month of highest and lowest spreads since the beginning of the year 2000.
How do these spreads compare to the most current spread data available? Interpret the
results.
2. Go to the St. Louis Federal Reserve FRED database, and find daily yield data on the
following U.S. treasuries securities: one-month (DGS1MO), three-month (DGS3MO), six-
month (DGS6MO), one-year (DGS1), two-year (DGS2), three-year (DGS3), five-year
(DGS5), seven-year (DGS7), 10-year (DGS10), 20-year (DGS20), and 30-year (DGS30).
Download the last full year of data available into a spreadsheet.
Mishkin • Instructor’s Manual for The Economics of Money, Banking, and Financial Markets, Twelfth Edition 100
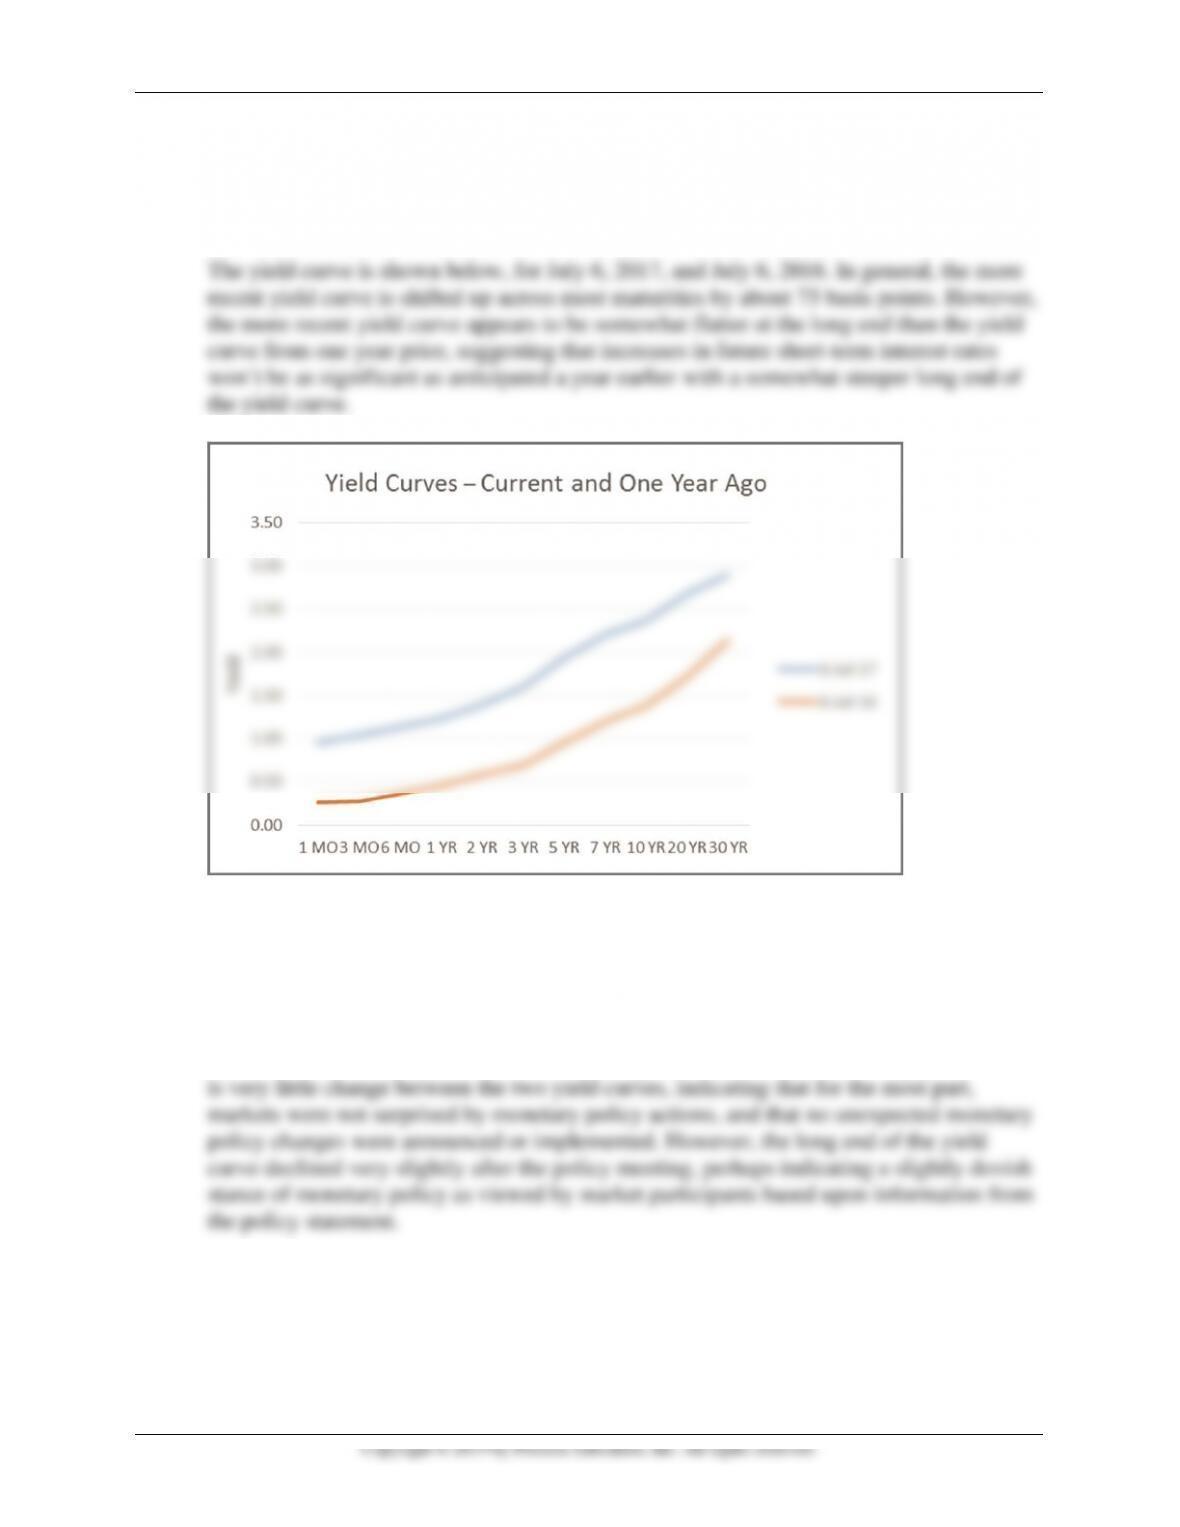
a. Construct a yield curve by creating a line graph for the most recent day of data
available, and for the same day (or as close to the same day as possible) one year prior,
across all the maturities. How do the yield curves compare? What does the changing
slope say about potential changes in economic conditions?
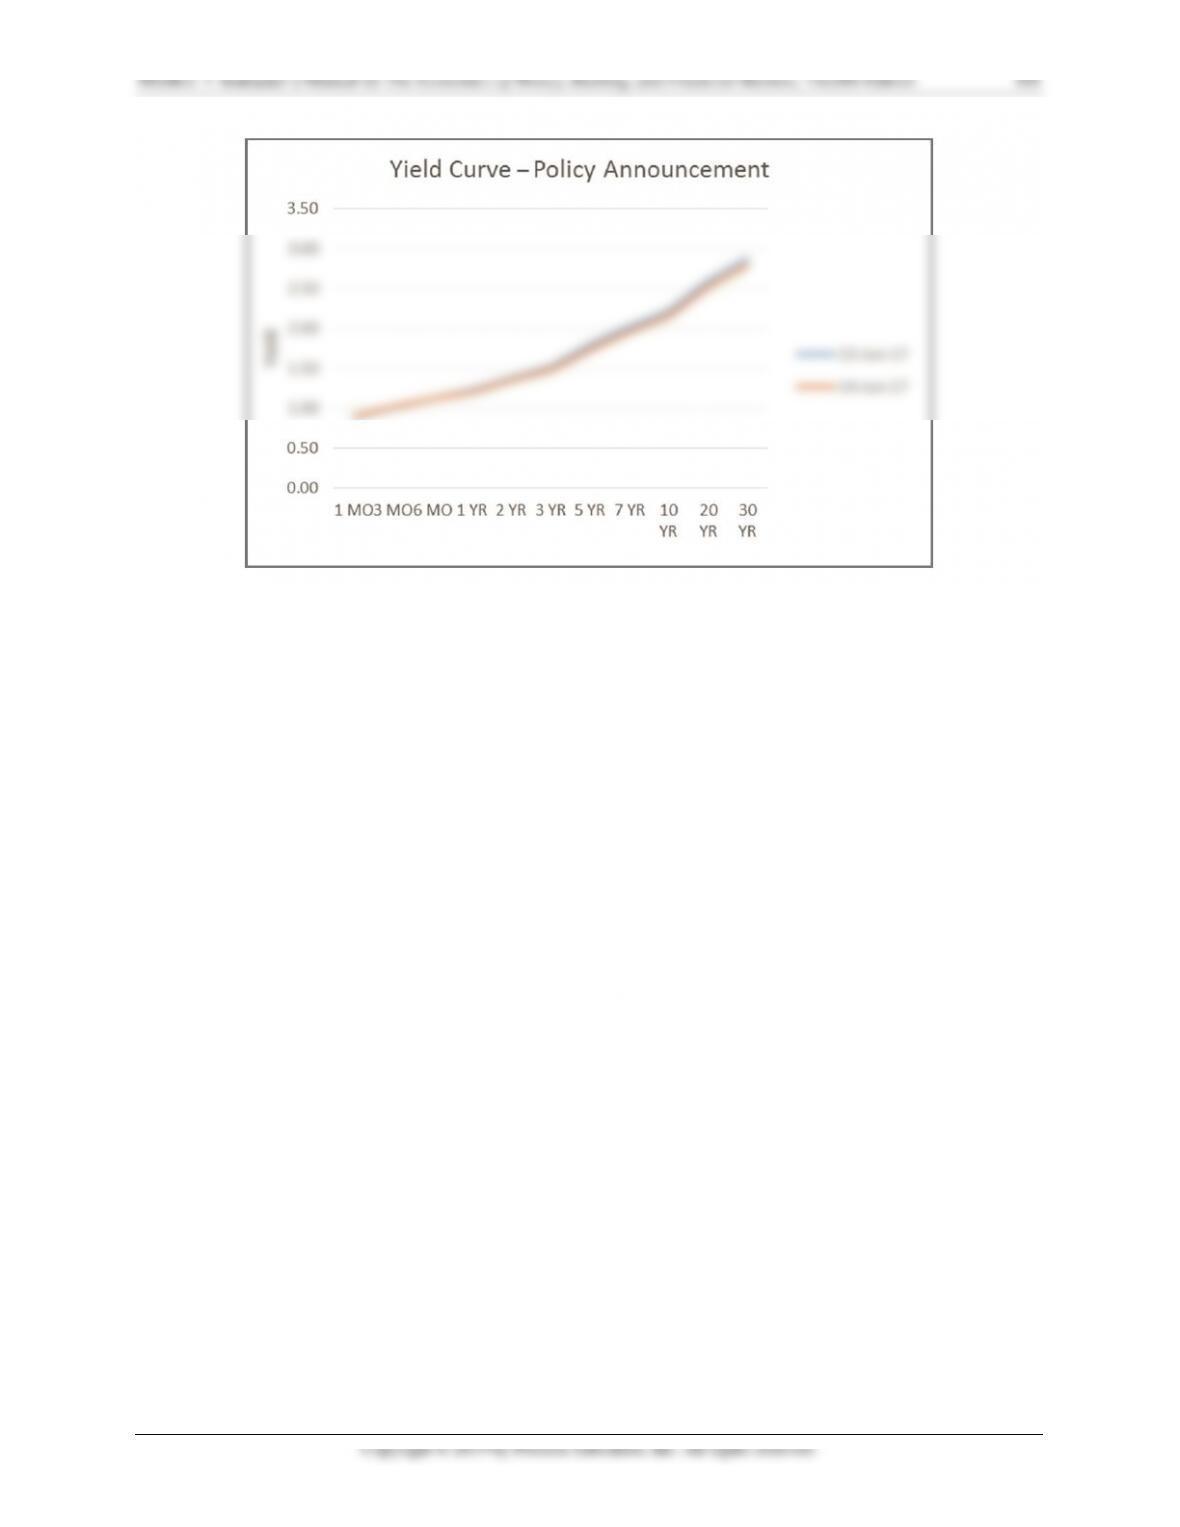
b. Determine the date of the most recent Federal Open Market Committee policy statement.
Construct yield curves for both the day before the policy statement was released and the
day on which the policy statement was released. Was there any significant change in the
yield curve as a result of the policy statement? How might this be explained?
The most recent FOMC meeting policy statement occurred on June 14, 2017. The yield
curve below shows yields for the end of trading day on that day, and the day prior. There