Mishkin • Instructor’s Manual for The Economics of Money, Banking, and Financial Markets, Twelfth Edition 65
Chapter 3
ANSWERS TO QUESTIONS
1. Why is simply counting currency an inadequate measure of money?
2. In prison, cigarettes are sometimes used among inmates as a form of payment. How is it
possible for cigarettes to solve the “double coincidence of wants” problem, even if a
prisoner does not smoke?
3. Three goods are produced in an economy by three individuals:
Good Producer
If the orchard owner likes only bananas, the banana grower likes only chocolate, and the
chocolatier likes only apples, will any trade between these three persons take place in a
barter economy? How will introducing money into the economy benefit these three
producers?
Because the orchard owner likes only bananas but the banana grower doesn’t like apples, the
banana grower will not want apples in exchange for his bananas, and they will not trade.
Mishkin • Instructor’s Manual for The Economics of Money, Banking, and Financial Markets, Twelfth Edition 70
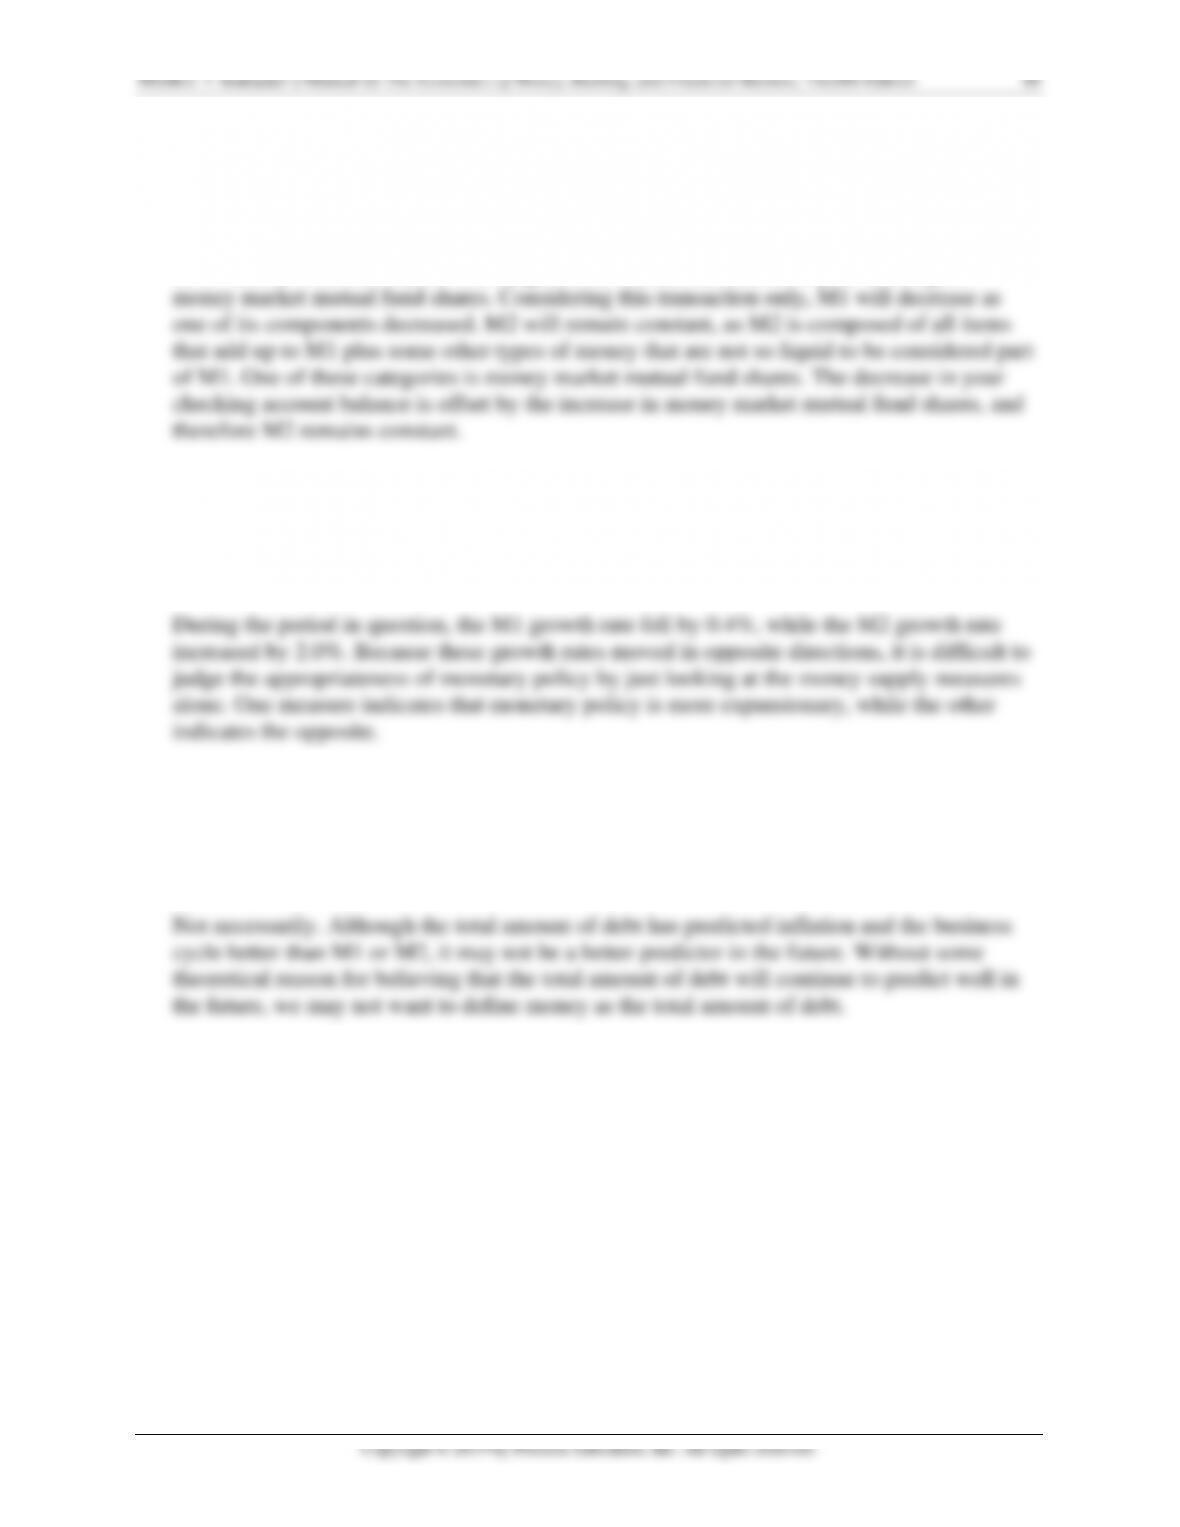
2018
2019
2020
2021
A.
Currency
900
920
925
931
B.
Money market mutual fund shares
680
681
679
688
C.
Saving account deposits
5,500
5,780
5,968
6,105
D.
Money market deposit accounts
1,214
1,245
1,274
1,329
E.
Demand and checkable deposits
1,000
972
980
993
F.
Small denomination time deposits
830
861
1,123
1,566
G.
Traveler’s checks
4
4
3
2
H.
3-month treasury bills
1,986
2,374
2,436
2,502
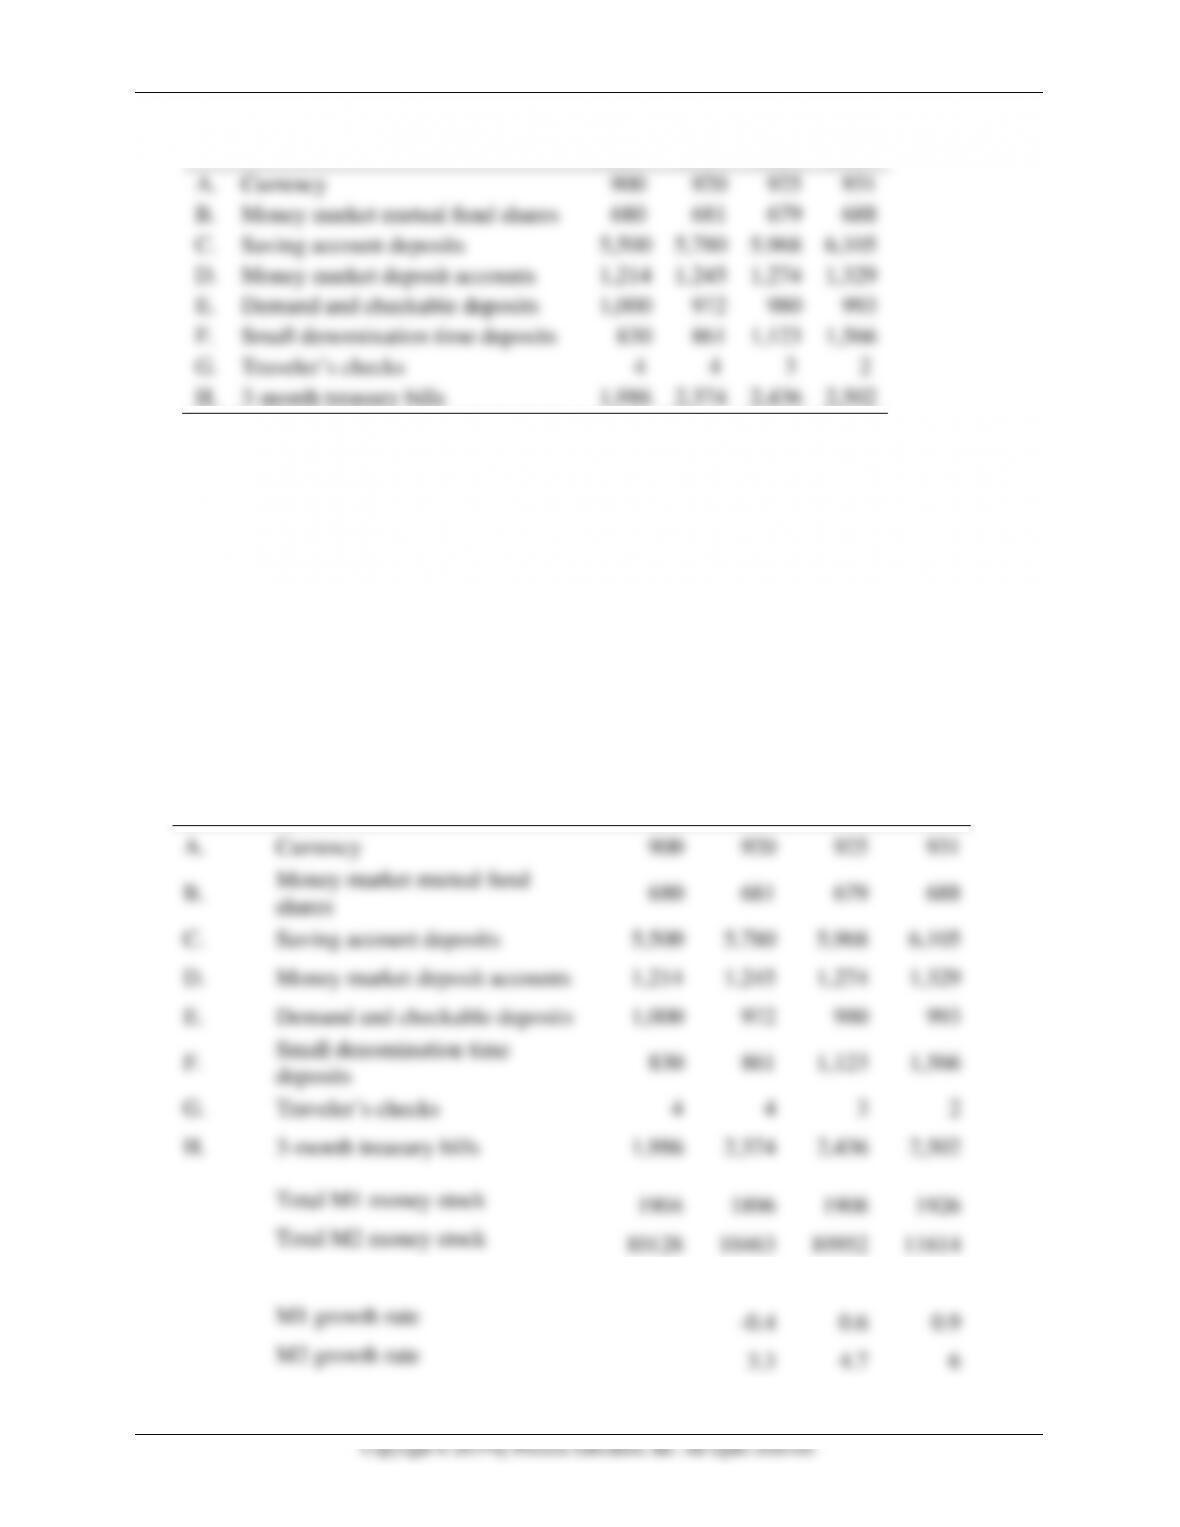
19. The M1 money supply is the sum of rows A, E, and G for each year. The M2 money supply is
the sum of all components A–G for each year. Note that 3-month treasury bills are not
considered part of the M1 or M2 money supply, even though they are fairly liquid assets. The
table below shows the M1 and M2 money supplies, along with the growth rates from the
previous year. Note that while the M1 money supply is relatively flat (and slightly negative
for 2019), the M2 money supply grows at a much higher, positive rate. This is because the
components of M2 are rising much more rapidly compared to the components of M1 (which
are also included in M2). In particular, small denomination time deposits increase 30% from
2019 to 2020, and 39% from 2020 to 2021, driving much of the growth in M2. Moreover, the
narrower components that make up just the M1 money supply represent less than 20%
(1904/10128) of the broader M2 indicators. Thus, movements in the money market, savings
account, and time deposit measures will have a much bigger impact on M2 growth than the
narrower M1 components will.
2018
2019
2020
2021
A.
Currency
900
920
925
931
B.
Money market mutual fund
shares
680
681
679
688
C.
Saving account deposits
5,500
5,780
5,968
6,105
D.
Money market deposit accounts
1,214
1,245
1,274
1,329
E.
Demand and checkable deposits
1,000
972
980
993
F.
Small denomination time
deposits
830
861
1,123
1,566
G.
Traveler’s checks
4
4
3
2
H.
3-month treasury bills
1,986
2,374
2,436
2,502
Total M1 money stock
1904
1896
1908
1926
Total M2 money stock
10128
10463
10952
11614
M1 growth rate
-0.4
0.6
0.9
M2 growth rate
3.3
4.7
6
Mishkin • Instructor’s Manual for The Economics of Money, Banking, and Financial Markets, Twelfth Edition 71
ANSWERS TO DATA ANALYSIS PROBLEMS
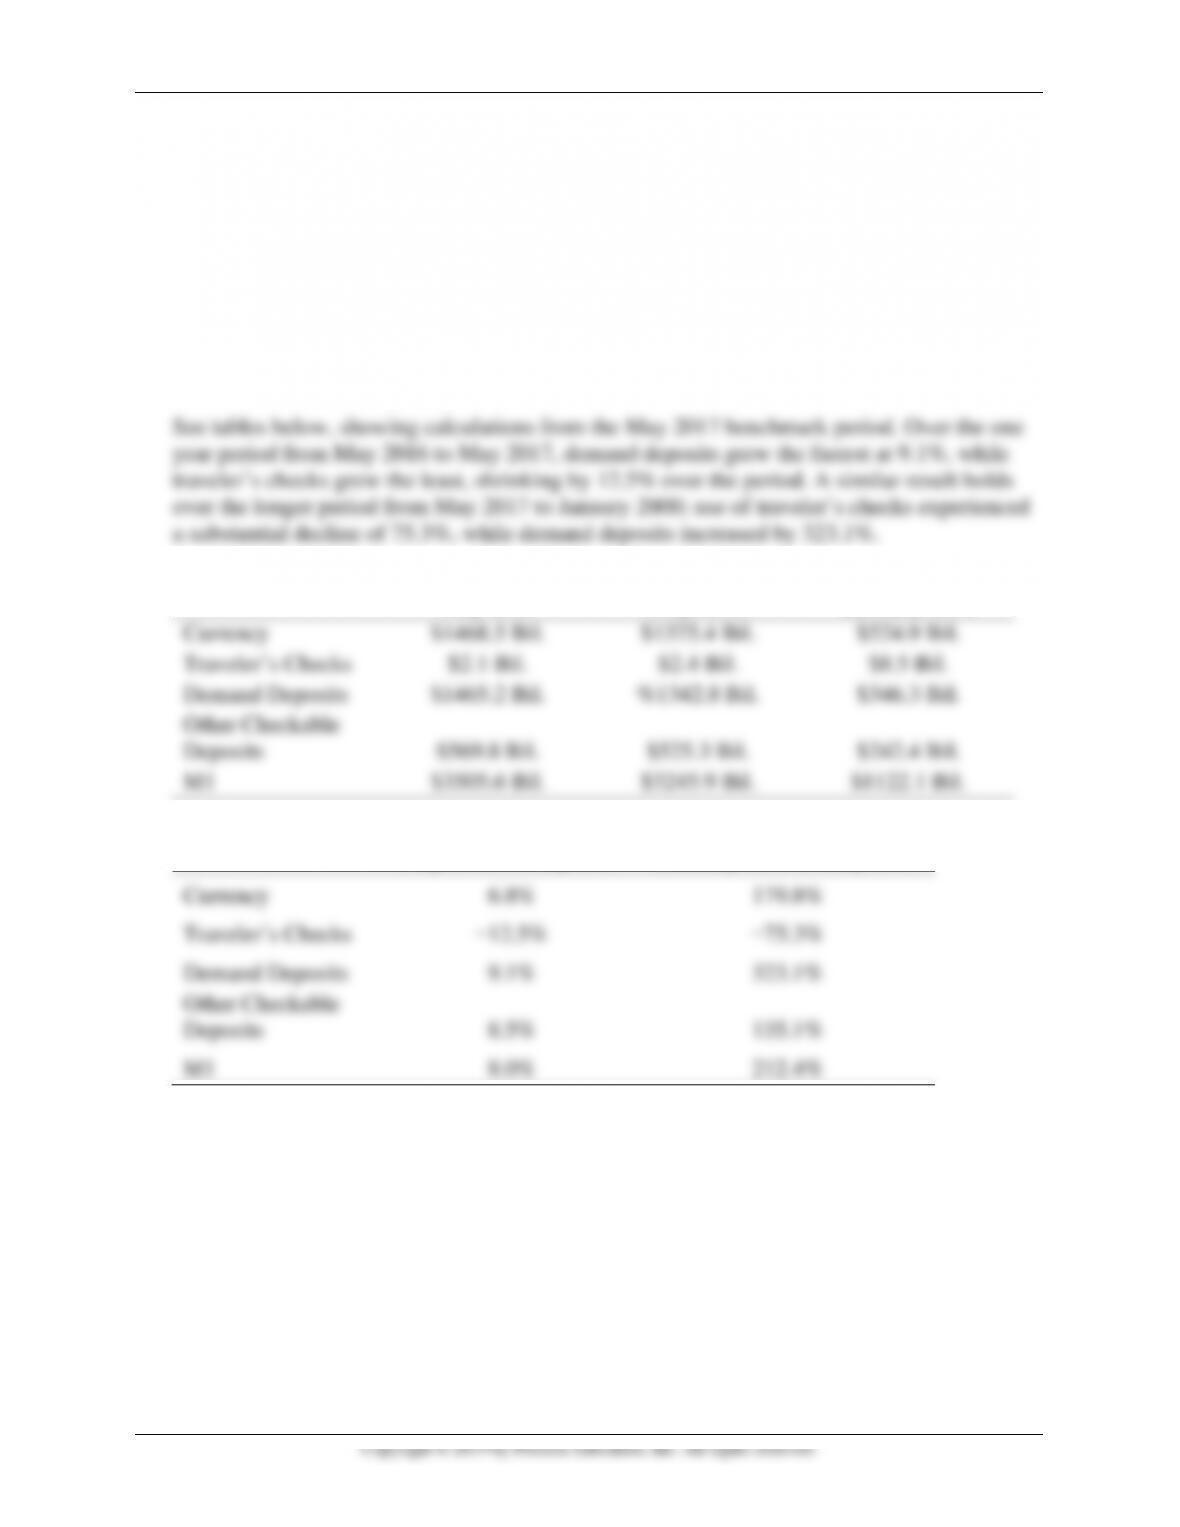
1. Go to the St. Louis Federal Reserve FRED database and find data on currency (CURRSL),
traveler’s checks (TVCKSSL), demand deposits (DEMDEPSL), and other checkable deposits
(OCDSL). Calculate the M1 money supply, and calculate the percentage change in M1 and
in each of the four components of M1 from the most recent month of data available to the
same time one year prior. Which component has the highest growth rate? The lowest growth
rate? Repeat the calculations using the data from January 2000 to the most recent month of
data available, and compare your results.
May 2017
May 2016
January 2000
Currency
$1468.5 Bil.
$1375.4 Bil.
$524.9 Bil.
Traveler’s Checks
$2.1 Bil.
$2.4 Bil.
$8.5 Bil.
Demand Deposits
$1465.2 Bil.
%1342.8 Bil.
$346.3 Bil.
Other Checkable
Deposits
$569.8 Bil.
$525.3 Bil.
$242.4 Bil.
M1
$3505.6 Bil.
$3245.9 Bil.
$1122.1 Bil.
May 2016 to May 2017
January 2000 to May 2017
Currency
6.8%
179.8%
Traveler’s Checks
−12.5%
−75.3%
Demand Deposits
9.1%
323.1%
Other Checkable
Deposits
8.5%
135.1%
M1
8.0%
212.4%
2. Go to the St. Louis Federal Reserve FRED database and find data on small-denomination
time deposits (STDSL), savings deposits and money market deposit accounts (SAVINGSL),
and retail money market funds (RMFSL). Calculate the percentage change of each of these
three components of M2 (not included in M1) from the most recent month of data available to
the same time one year prior. Which component has the highest growth rate? The lowest
growth rate? Repeat the calculations using the data from January 2000 to the most recent
month of data available, and compare your results. Use your answers from question 1 to
determine which grew faster: the non-M1 components of M2 or the M1 money supply.
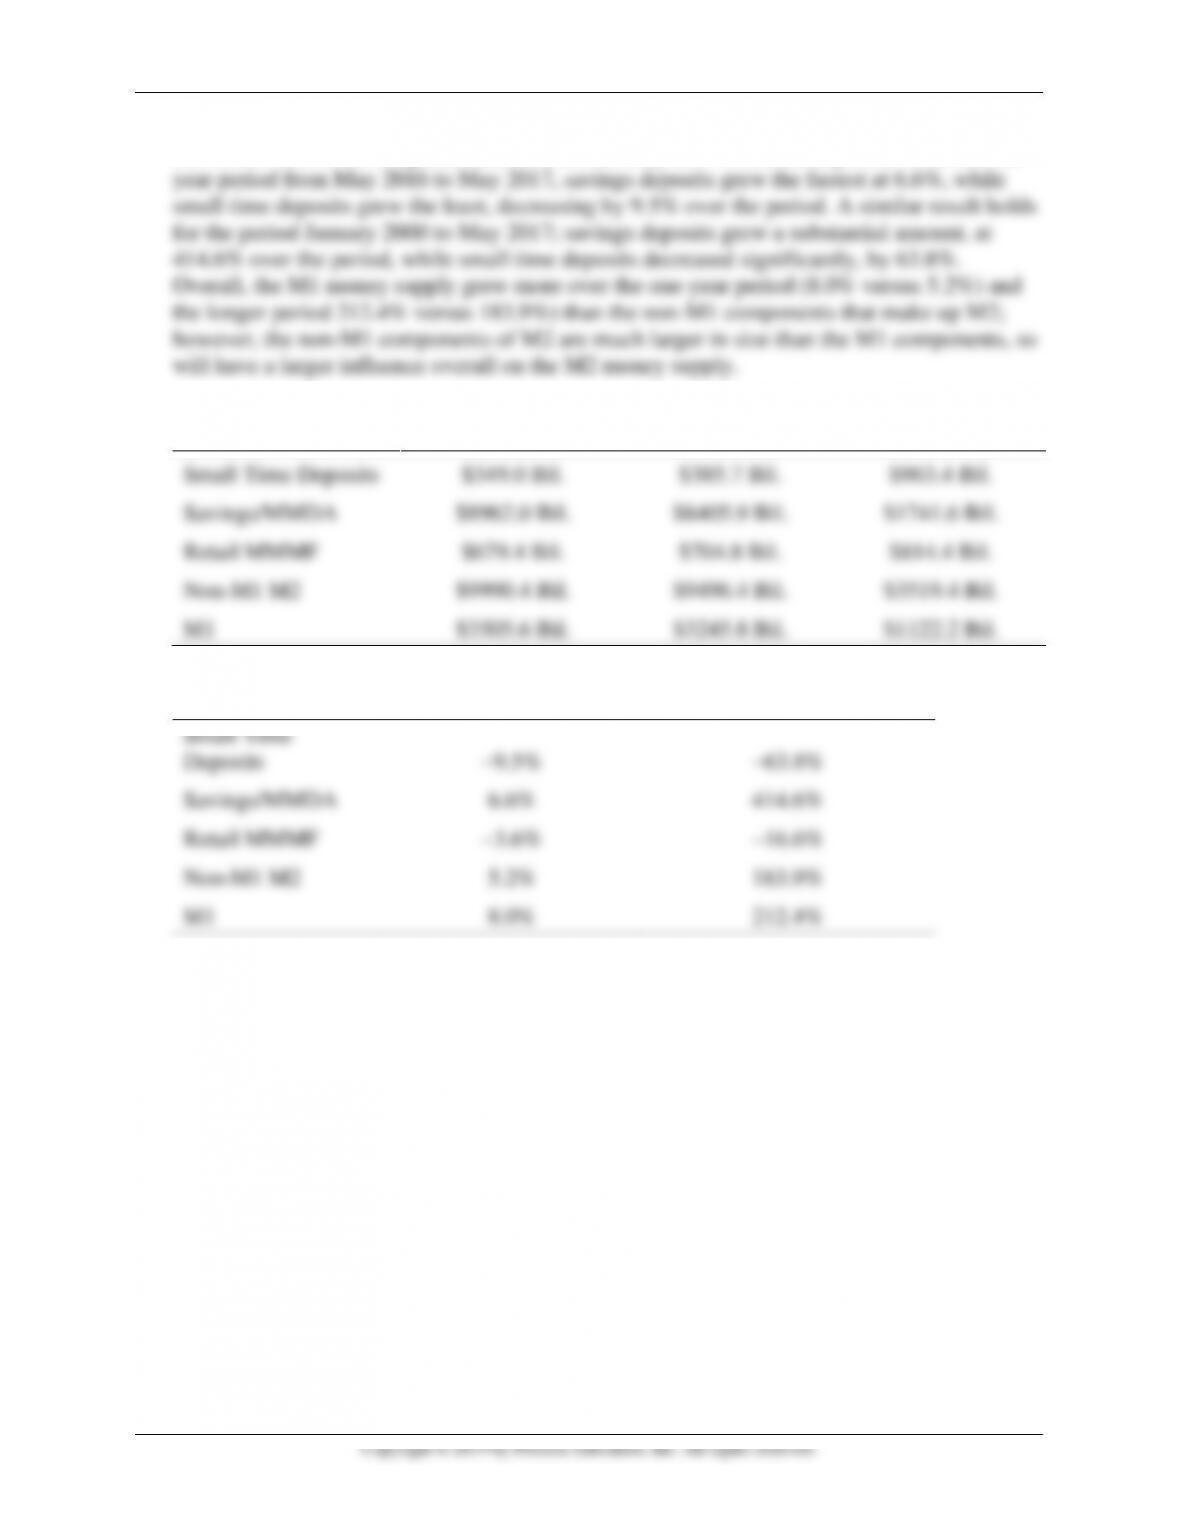
Mishkin • Instructor’s Manual for The Economics of Money, Banking, and Financial Markets, Twelfth Edition 72
See tables below, showing calculations from the May 2017 benchmark period. Over the one
May 2017
May 2016
January 2000
Small Time Deposits
$349.0 Bil.
$385.7 Bil.
$963.4 Bil.
Savings/MMDA
$8962.0 Bil.
$8405.9 Bil.
$1741.6 Bil.
Retail MMMF
$679.4 Bil.
$704.8 Bil.
$814.4 Bil.
Non-M1 M2
$9990.4 Bil.
$9496.4 Bil.
$3519.4 Bil.
M1
$3505.6 Bil.
$3245.8 Bil.
$1122.2 Bil.
May 2016 to May 2017
January 2000 to May 2017
Small Time
Deposits
−9.5%
−63.8%
Savings/MMDA
6.6%
414.6%
Retail MMMF
−3.6%
−16.6%
Non-M1 M2
5.2%
183.9%
M1
8.0%
212.4%