Unlock document.
This document is partially blurred.
Unlock all pages and 1 million more documents.
Get Access
Mishkin • Instructor’s Manual for The Economics of Money, Banking, and Financial Markets, Twelfth Edition 252
ANSWERS TO DATA ANALYSIS PROBLEMS
1. Go to the St. Louis Federal Reserve FRED database and find data on real government
spending (GCEC1), real GDP (GDPC1), taxes (W006RC-1Q027SBEA), and the personal
consumption expenditure price index (PCECTPI), a measure of the price level. Download all
of the data into a spreadsheet, and convert the tax data series into real taxes. To do this, for
each quarter, divide taxes by the price index and then multiply by 100.
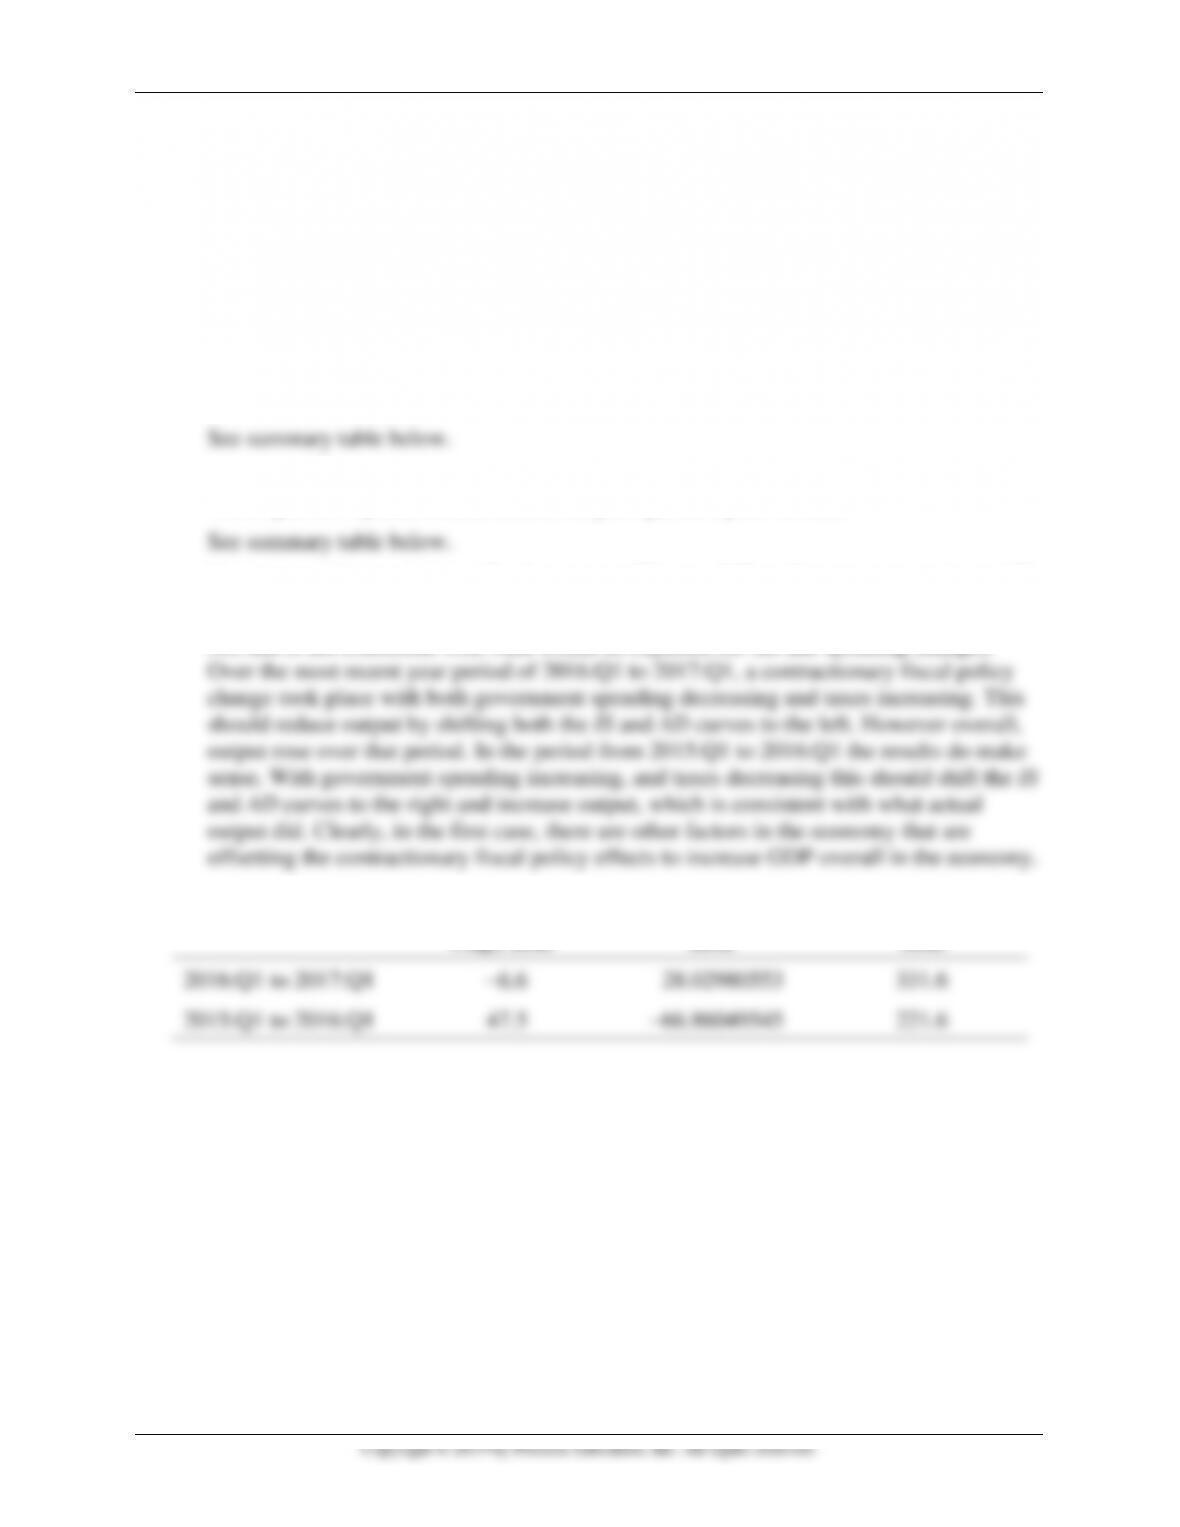
a. Calculate the level change in real GDP over the four most recent quarters of data
available, and the four quarters prior to that.
b. Calculate the level change in real government spending and real taxes over the four most
recent quarters of data available, and the four quarters prior to that.
c. Are your results consistent with what you would expect? How do your answers to part (b)
help explain, if at all, your answer to part (a)? Explain using the IS and AD curves.
No, this is not consistent with what would be expected for tax and spending changes.

Mishkin • Instructor’s Manual for The Economics of Money, Banking, and Financial Markets, Twelfth Edition 254
Chapter 23
ANSWERS TO QUESTIONS
1. What does it mean when we say that the inflation gap is negative?
2. “If autonomous spending falls, the central bank should lower its inflation target in order to
stabilize inflation.” Is this statement true, false, or uncertain? Explain your answer.
3. For each of the following shocks, describe how monetary policymakers would respond (if at
all) to stabilize economic activity. Assume the economy starts at a long-run equilibrium.
a. Consumers reduce autonomous consumption.
b. Financial frictions decrease.
c. Government spending increases.
d. Taxes increase.
e. The domestic currency appreciates.
Mishkin • Instructor’s Manual for The Economics of Money, Banking, and Financial Markets, Twelfth Edition 260
ANSWERS TO APPLIED PROBLEMS
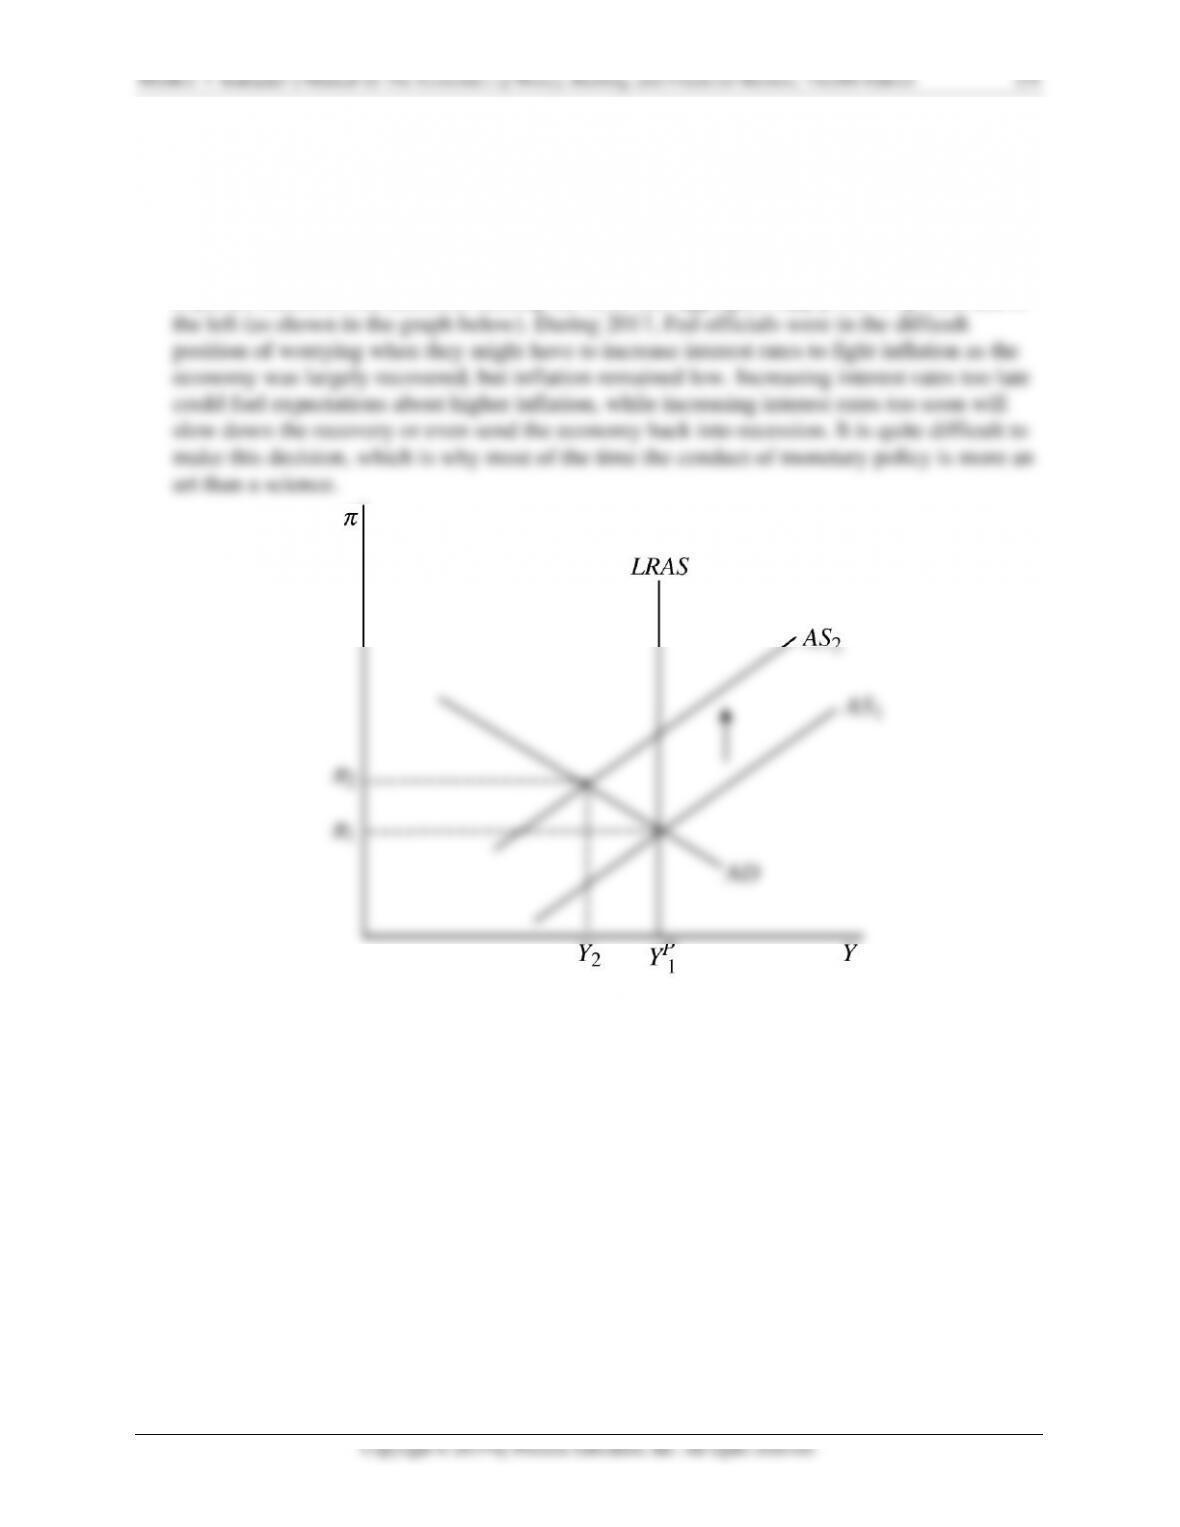
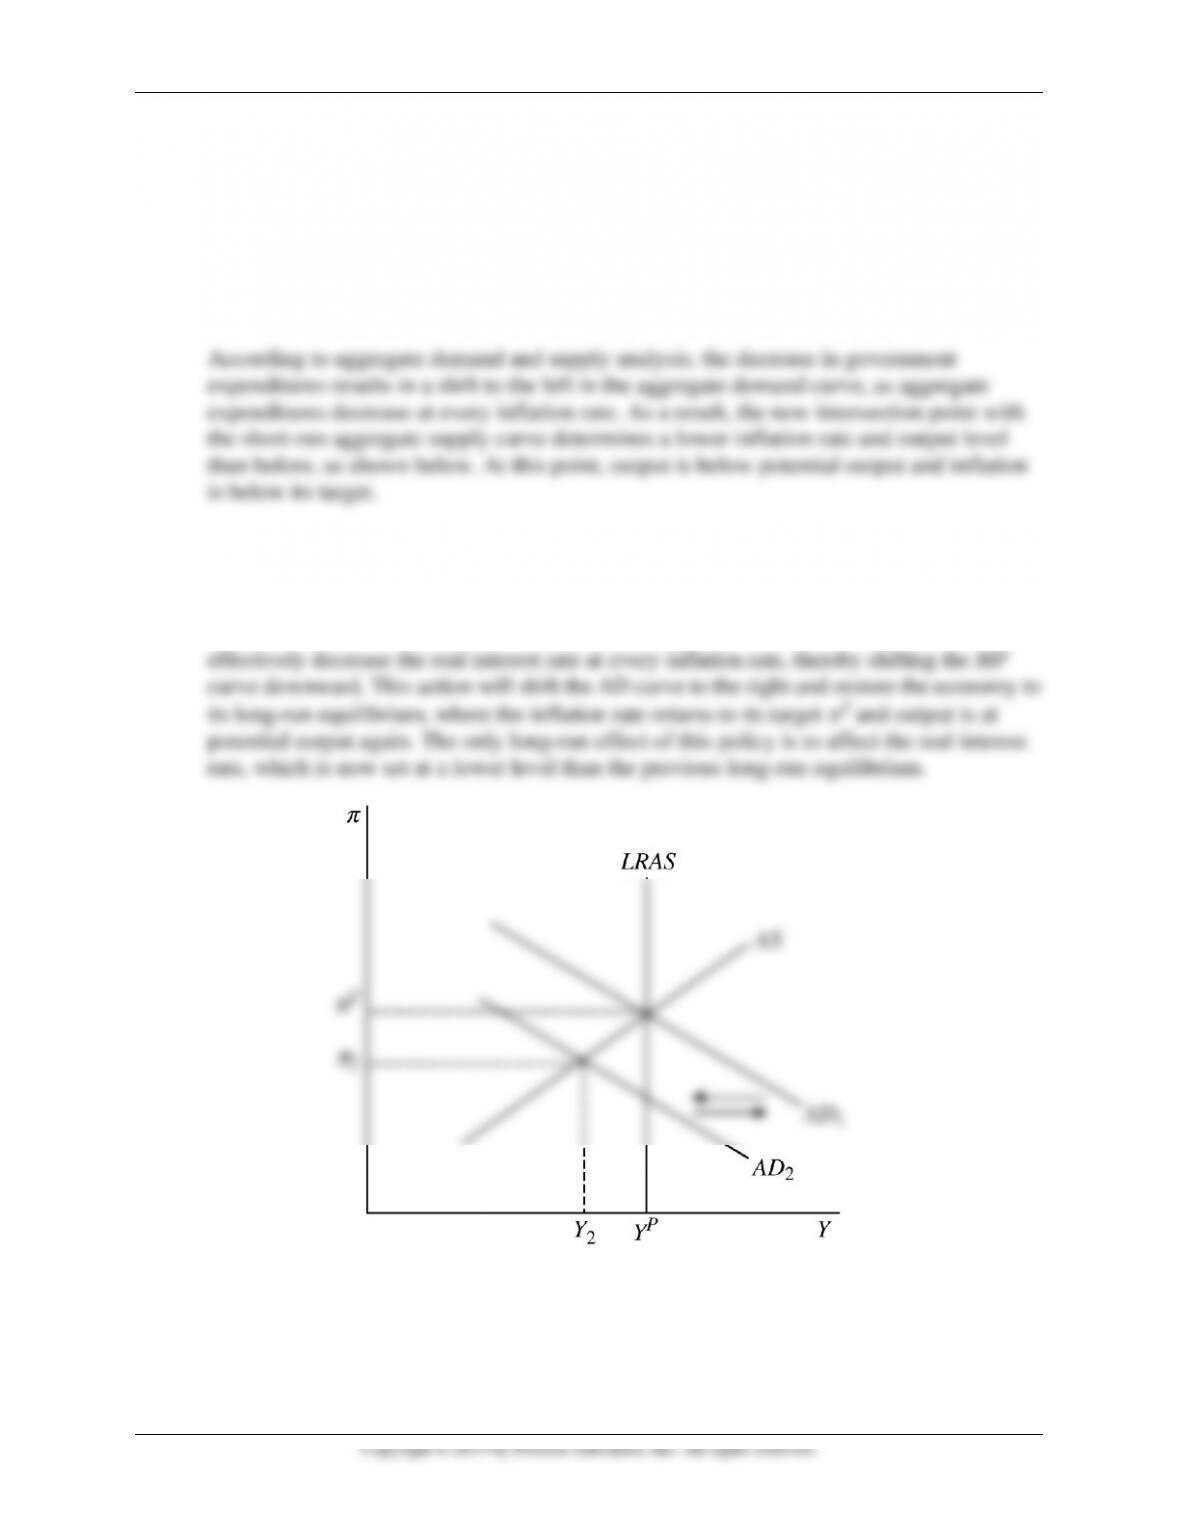
25. Suppose the current administration decides to decrease government expenditures as a means
of cutting the existing government budget deficit.
a. Using a graph of aggregate demand and supply, show the effects of such a decision on
the economy in the short run. Describe the effects on inflation and output.
b. What will be the effect on the real interest rate, the inflation rate, and the output level if
the Federal Reserve decides to stabilize the inflation rate?
If the Federal Reserve decides to use its monetary policy tools to stabilize inflation, it will
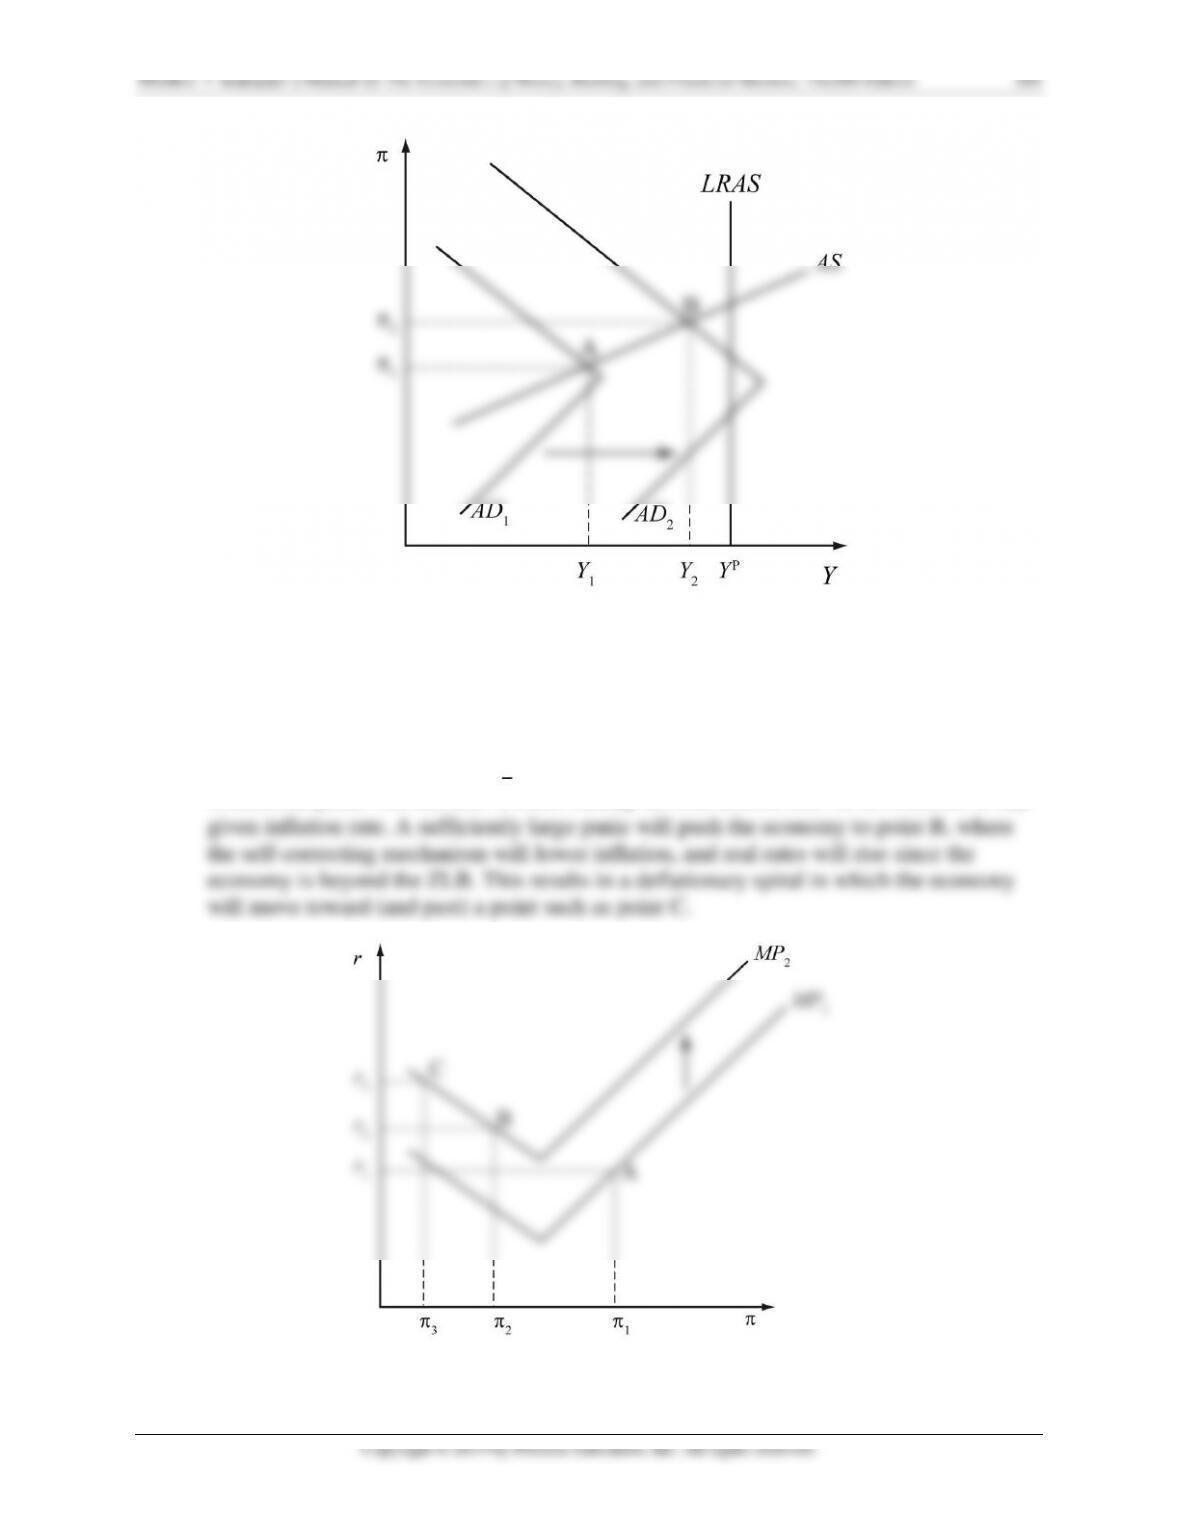
Mishkin • Instructor’s Manual for The Economics of Money, Banking, and Financial Markets, Twelfth Edition 265
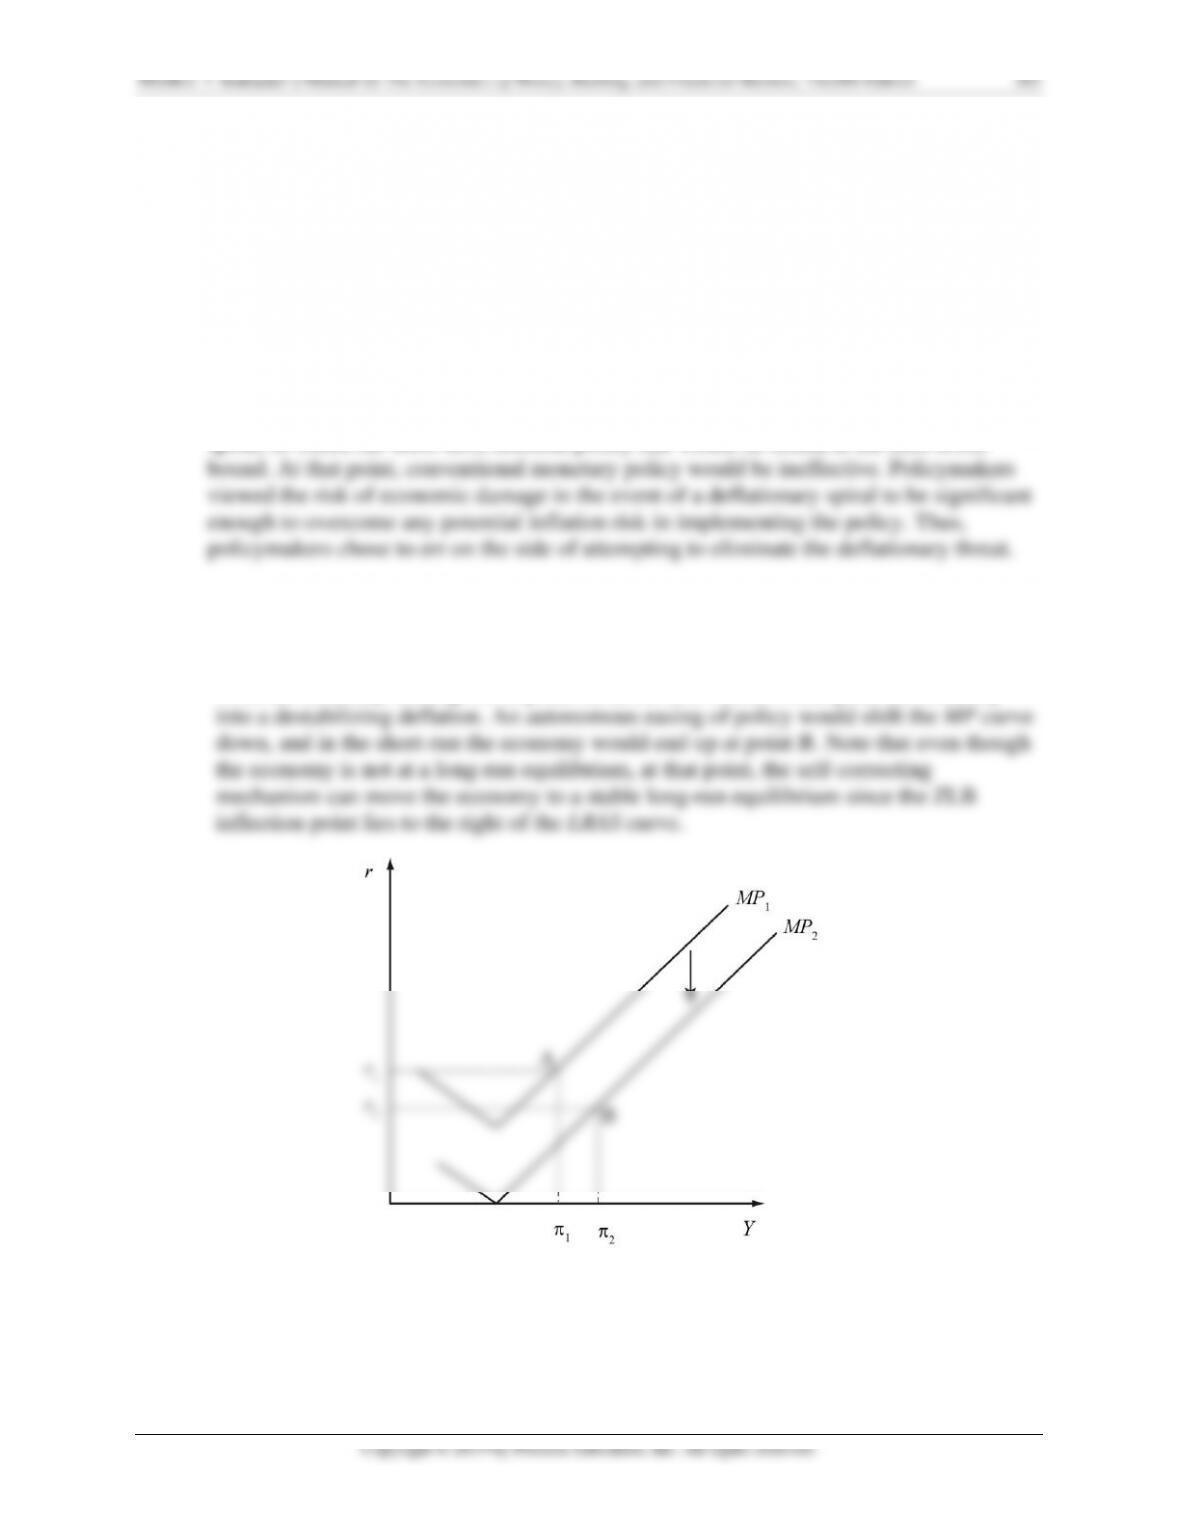
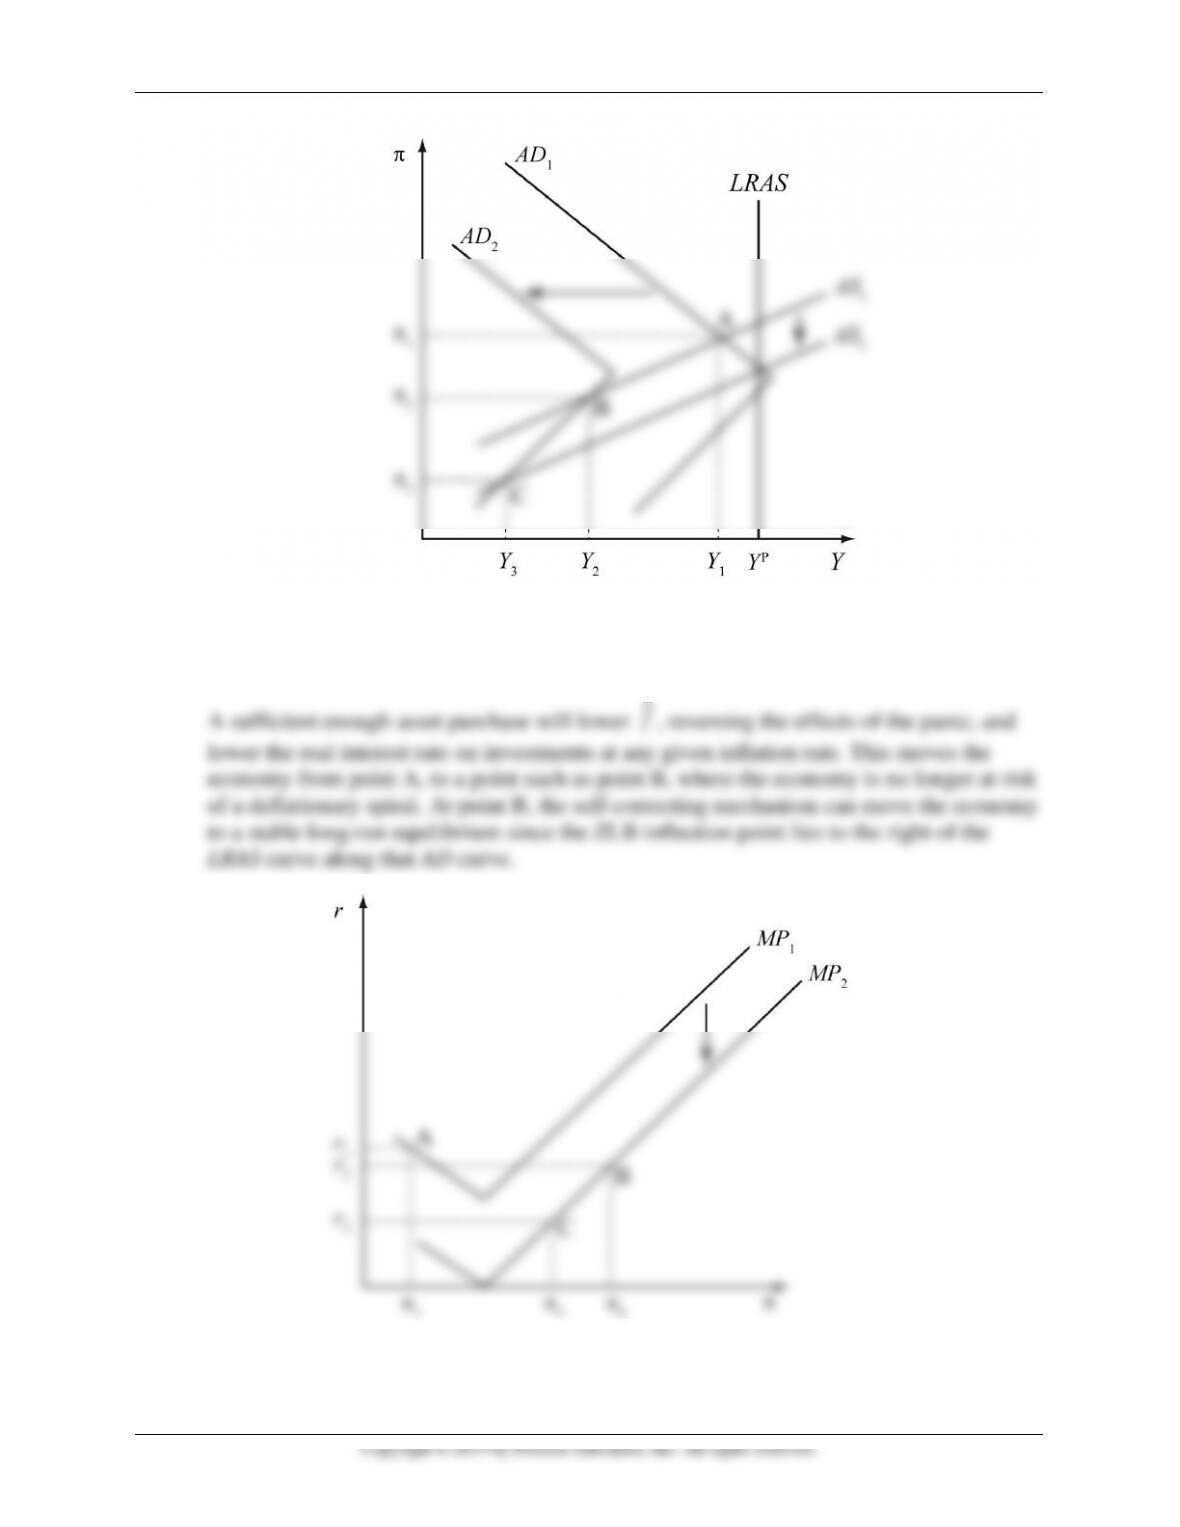
b. Using an MP curve and an AS/AD graph, show how a sufficient amount of asset
purchases can reverse the effects of the financial panic depicted in part (a).
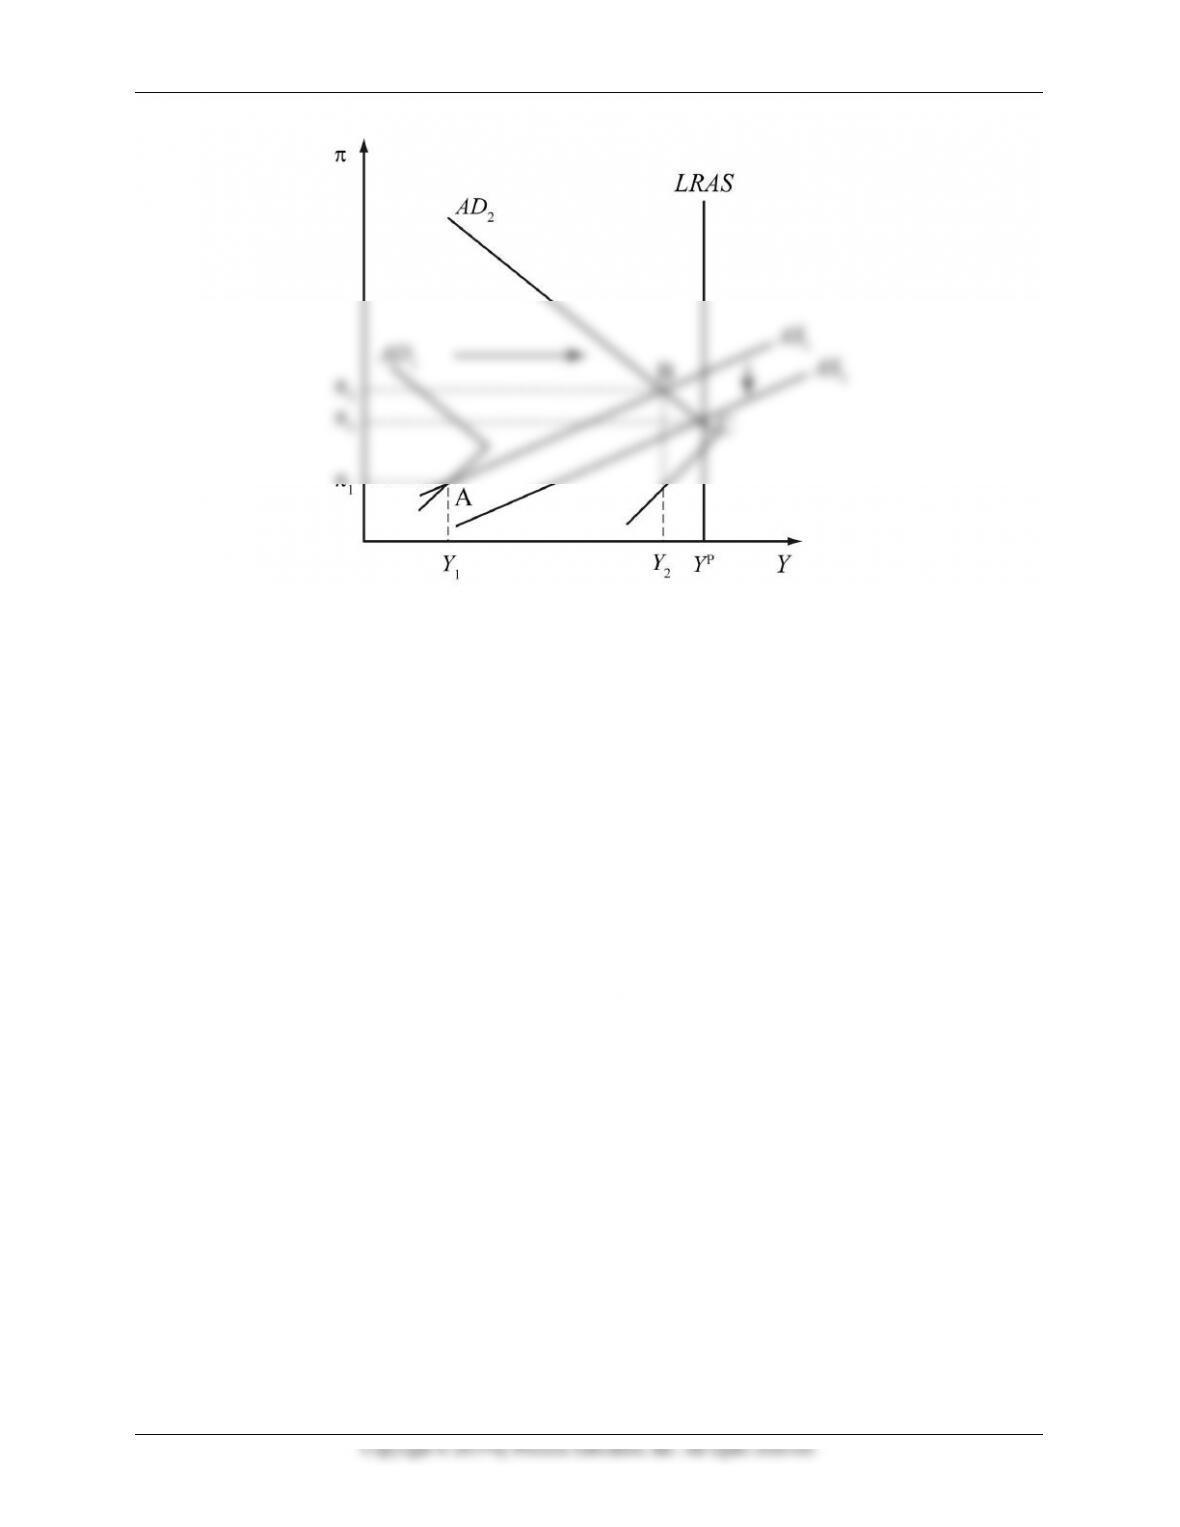
Mishkin • Instructor’s Manual for The Economics of Money, Banking, and Financial Markets, Twelfth Edition 266
ANSWERS TO DATA ANALYSIS PROBLEMS
1. On January 19, 2017, the Federal Reserve released its amended statement on longer-run
goals and monetary policy strategy. It stated: “The Committee reaffirms its judgment that
inflation at the rate of 2%, as measured by the annual change in the price index for personal
consumption expenditures, is most consistent over the longer run with the Federal Reserve’s
statutory mandate.” and that “the median of FOMC participants’ estimates of the longer-run
normal rate of unemployment was 4.8%.” Assume this statement implies that the natural rate
of unemployment is believed to be 4.8%. Go to the St. Louis Federal Reserve FRED
database, and find data on the personal consumption expenditure price index (PCECTPI),
the unemployment rate (UNRATE), real GDP (GDPC1), and real potential gross domestic
product (GDPPOT), an estimate of potential GDP. For the price index, adjust the units
setting to “Percent Change From Year Ago.” For the unemployment rate, adjust the
frequency setting to ‘Quarterly’. Download the data into a spreadsheet.
a. For the most recent four quarters of data available, calculate the average inflation gap
using the 2% target referenced by the Fed. Calculate this value as the average of the
inflation gaps over the four quarters.
b. For the most recent four quarters of data available, calculate the average output gap
using the GDP measure and the potential GDP estimate. Calculate the gap as the
percentage deviation of output from the potential level of output. Calculate the average
value over the most recent four quarters of data available.
c. For the most recent four quarters of data available, calculate the average unemployment
gap, using 4.8% as the presumed natural rate of unemployment. Based on your answers
to parts (a) through (c), does the divine coincidence apply to the current economic
situation? Why or why not? What does your answer imply about the sources of shocks
that have impacted the current economy? Briefly explain.
Mishkin • Instructor’s Manual for The Economics of Money, Banking, and Financial Markets, Twelfth Edition 267
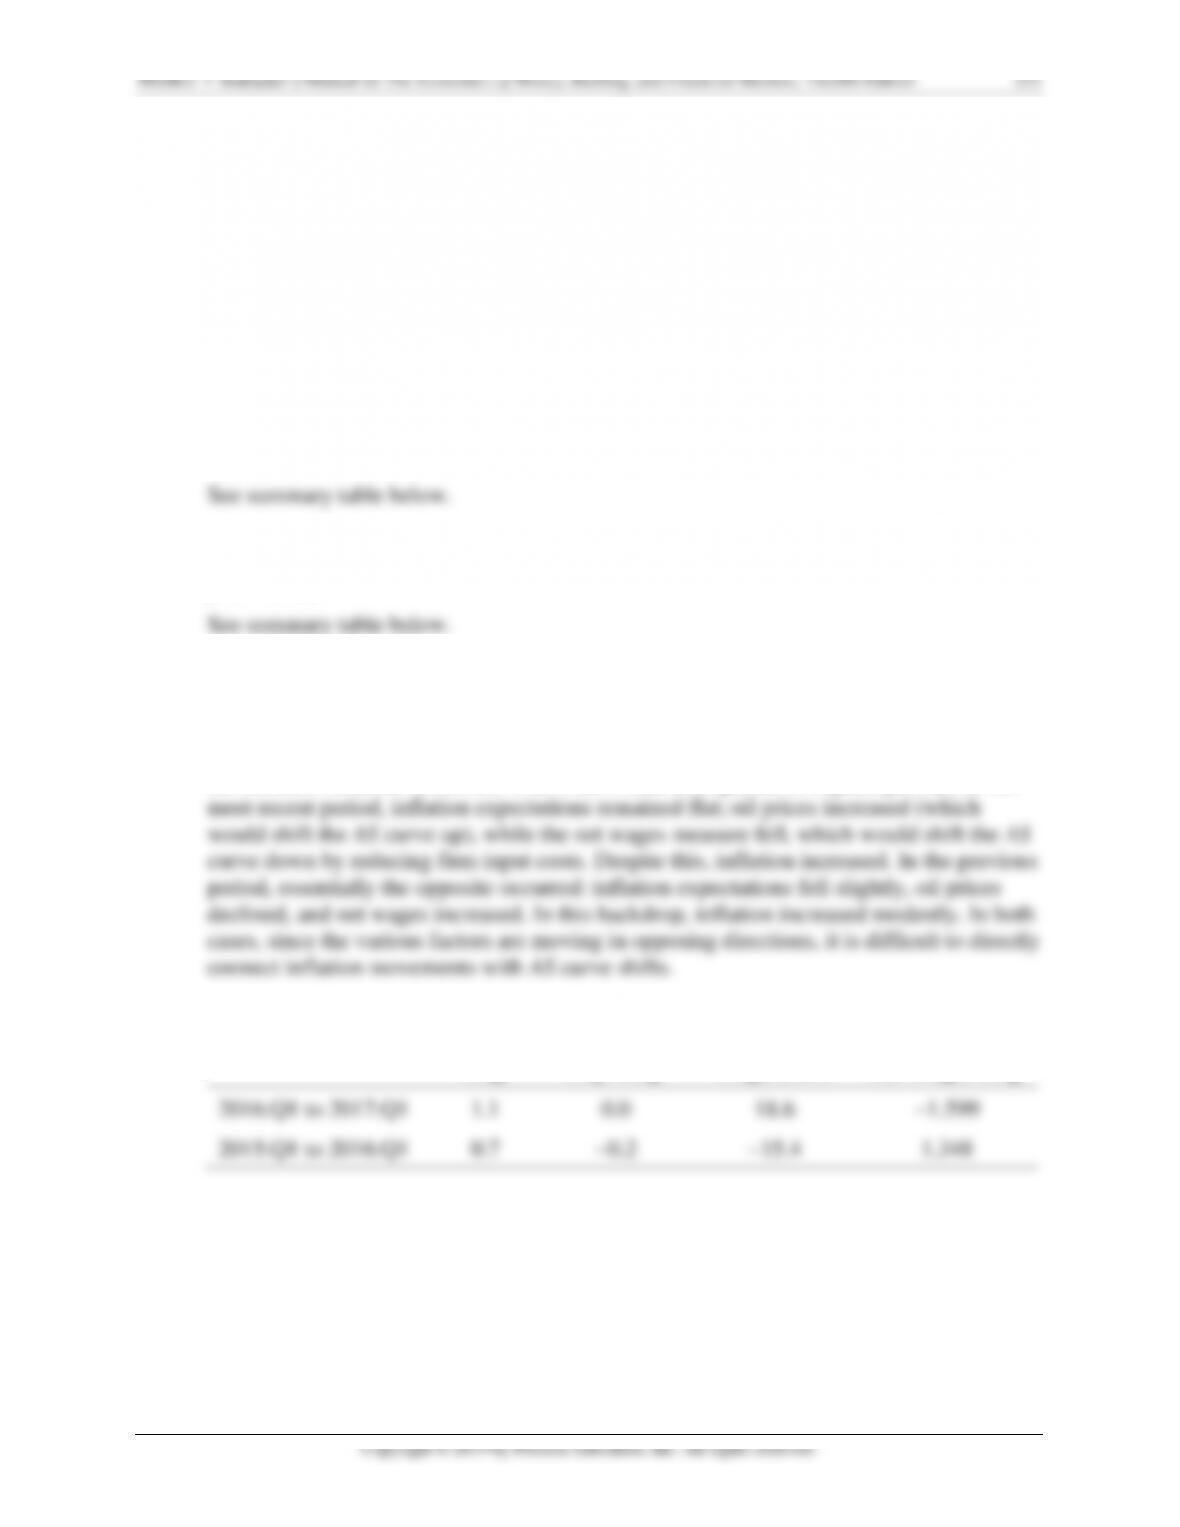
2. Go to the St. Louis Federal Reserve FRED database and find data on the personal
consumption expenditure price index (PCECTPI), the unemployment rate (UNRATE), and an
estimate of the natural rate of unemployment (NROU). For the price index, adjust the units
setting to “Percent Change From Year Ago.” For the unemployment rate, adjust the
frequency setting to ‘Quarterly’. Select the data from 2000 through the most current data
available, download the data, and plot all three variables on the same graph. Using your
graph, identify periods of demand-pull or cost-push movements in the inflation rate. Briefly
explain your reasoning.
See graph below. The period from around early 2001 to around the end of 2003 appears to be


