Mishkin • Instructor’s Manual for The Economics of Money, Banking, and Financial Markets, Twelfth Edition 234
Copyright © 2019 by Pearson Education, Inc. All rights reserved.
False. If the Fed changes interest rates by exactly the amount of the change in
f,
this will
mitigate the adverse effects of financial frictions on investment. However, the decrease in the
real interest rate will increase net exports, so that aggregate output will increase. Thus, to
offset the increase in financial frictions, the Fed would need to reduce the real interest rate by
a little bit less than the change in
f
to keep output constant.
ANSWERS TO APPLIED PROBLEMS
19. Assume that the monetary policy curve is given by r = 1.5 + 0.751
.
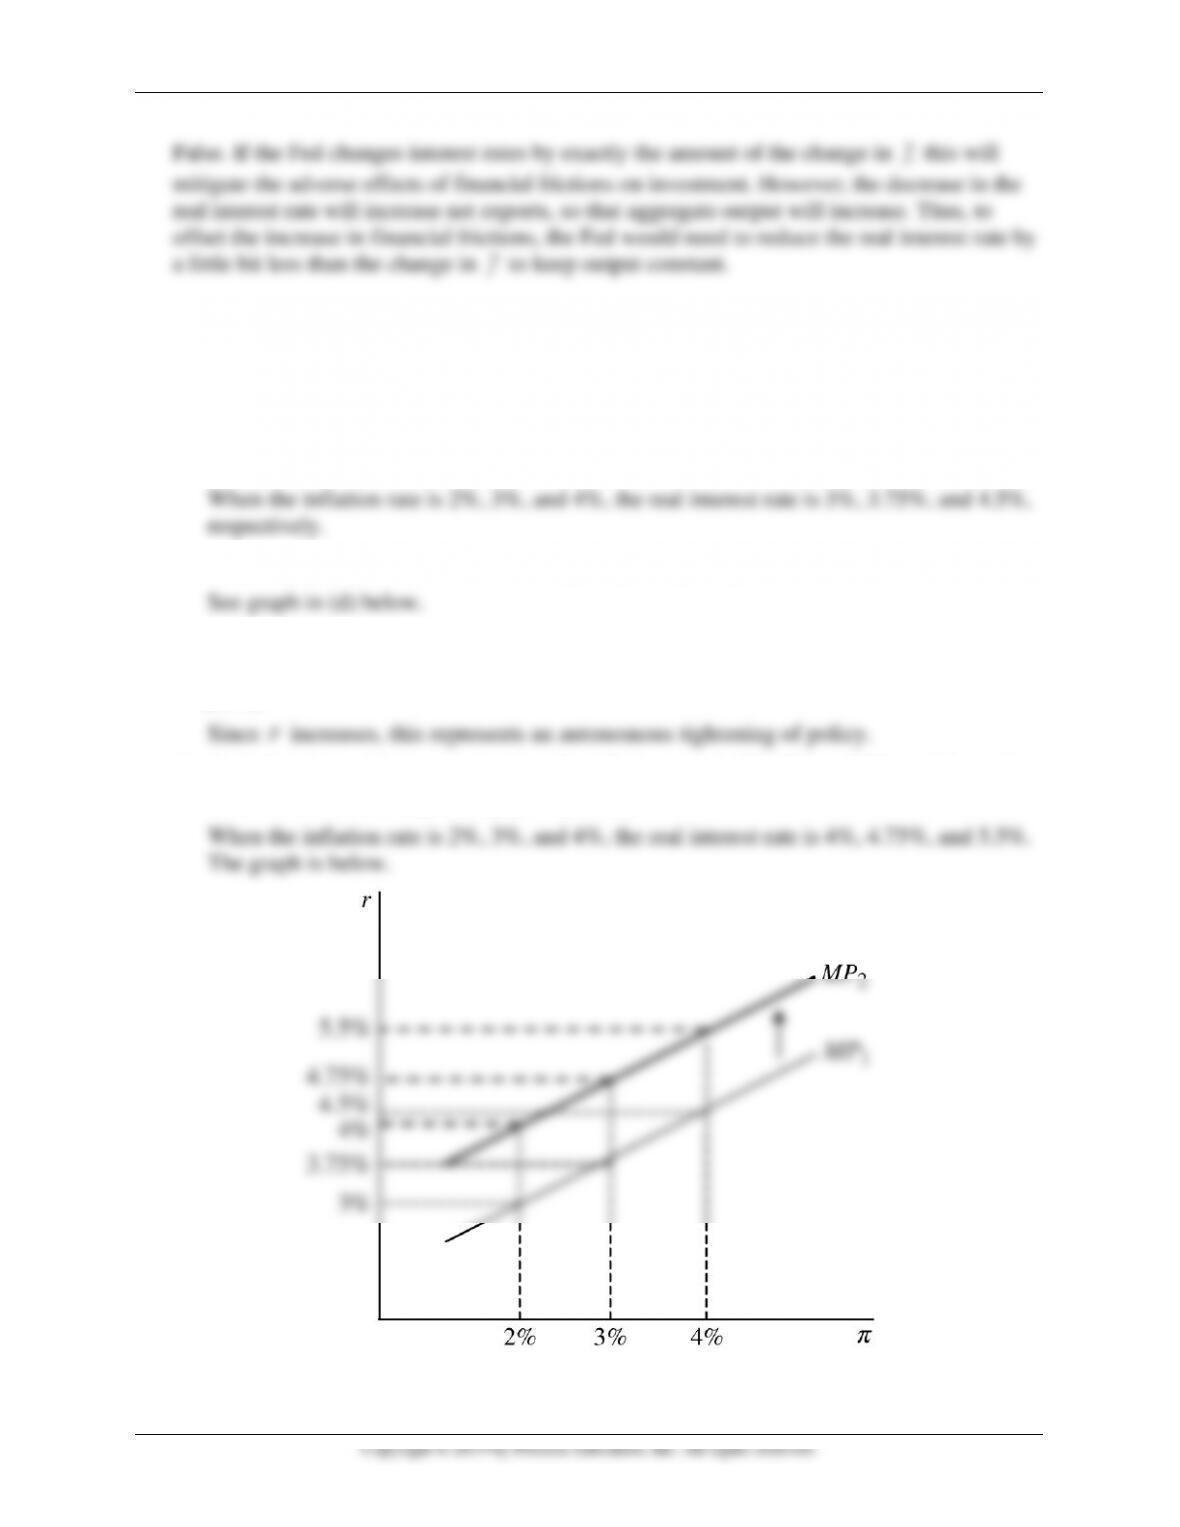
a. Calculate the real interest rate when the inflation rate is 2%, 3%, and 4%.
b. Draw a graph of the MP curve, labeling the points from part (a).
c. Assume now that the monetary policy curve is given by r = 2.5 + 0.751
. Does the new
monetary policy curve represent an autonomous tightening or loosening of monetary
policy?
d. Calculate the real interest rate when the inflation rate is 2%, 3%, and 4%, and draw the
new MP curve, showing the shift from part (b).


Mishkin • Instructor’s Manual for The Economics of Money, Banking, and Financial Markets, Twelfth Edition 238
d. If the Fed wants to keep output constant, then what monetary policy change should it
make?
25. Suppose the MP curve is given by r = 2 +
, and the IS curve is given by Y = 20 – 2r.
a. Derive an expression for the AD curve, and draw a graph labeling points at
= 0,
= 4, and
= 8.
b. Suppose that
increases to
= 2. Derive an expression for the new AD curve, and draw
the new AD curve using the graph from part (a).
c. What does your answer to part (b) imply about the relationship between a central bank’s
distaste for inflation and the slope of the AD curve?

Mishkin • Instructor’s Manual for The Economics of Money, Banking, and Financial Markets, Twelfth Edition 239
ANSWERS TO DATA ANALYSIS PROBLEMS
1. A measure of real interest rates can be approximated by the Treasury Inflation-Indexed
Security, or TIIS. Go to the St. Louis Federal Reserve FRED database and find data on the
five-year TIIS (FII5) and the personal consumption expenditure price index (PCECTPI), a
measure of the price index. Choose “Quarterly” for the frequency setting of the TIIS, and
download both data series. Convert the price index data to annualized inflation rates by
taking the quarter-to-quarter percent change in the price index and multiplying it by 4. Be
sure to multiply by 100 so that your results are percentages.
a. Calculate the average inflation rate and the average real interest rate over the most
recent four quarters of data available, and the four quarters prior to that.
b. Calculate the change in the average inflation rate between the most recent annual period
and the year prior. Then calculate the change in the average real interest rate over the
same period.
c. Using your answers to part (b), compute the ratio of the change in the average real
interest rate to the change in the average inflation rate. What does this ratio represent?
Comment on how it relates to the Taylor principle.
2. A measure of real interest rates can be approximated by the Treasury Inflation-Indexed
Security, or TIIS. Go to the St. Louis Federal Reserve FRED database and find data on the
five-year TIIS (FII5) and the personal consumption expenditure price index (PCECTPI), a
measure of the price index. Choose “Quarterly” for the frequency setting for the TIIS, and
choose “Percent Change From Year Ago” for the units setting on (PCECTPI). Plot both
series on the same graph, using data from 2007 through the most current data available. Use
the graph to identify periods of autonomous monetary policy changes. Briefly explain your
reasoning.
See graph below. Periods of autonomous monetary policy change are characterized by a
decoupling of real rates and inflation rates. From the middle of 2007 to late 2008, inflation
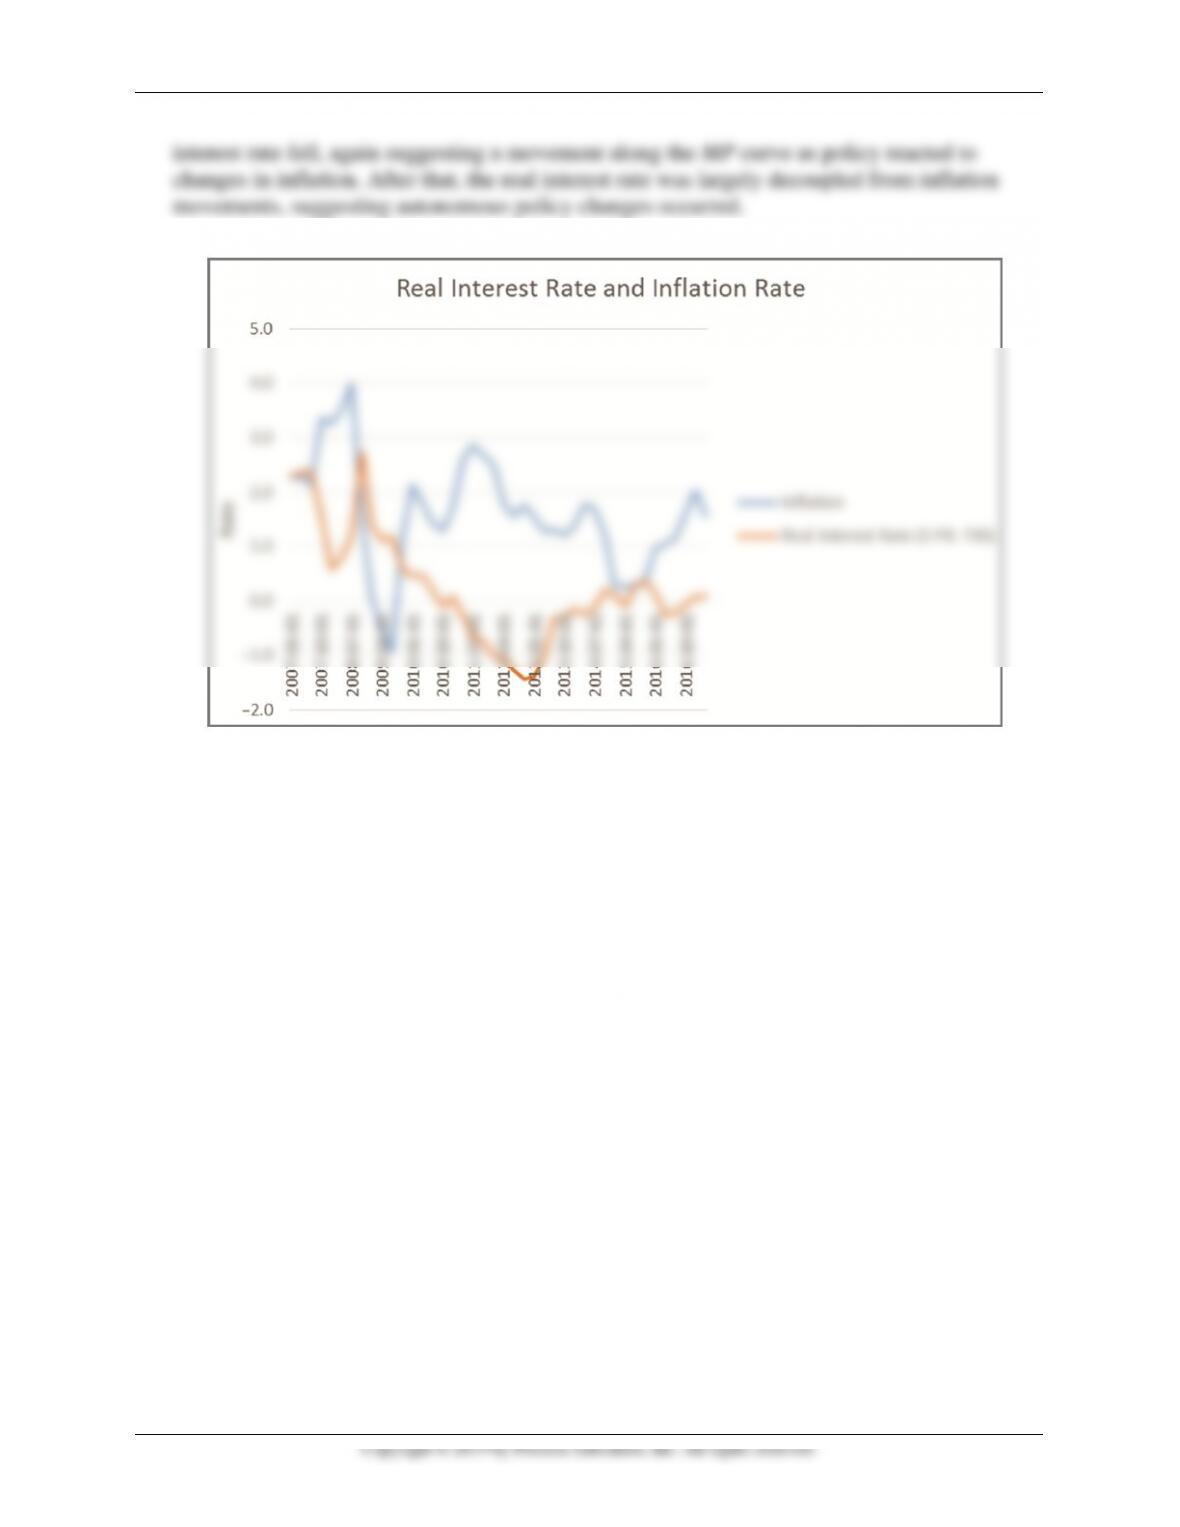
Mishkin • Instructor’s Manual for The Economics of Money, Banking, and Financial Markets, Twelfth Edition 240
Copyright © 2019 by Pearson Education, Inc. All rights reserved.
interest rate fell, again suggesting a movement along the MP curve as policy reacted to
changes in inflation. After that, the real interest rate was largely decoupled from inflation
movements, suggesting autonomous policy changes occurred.

Mishkin • Instructor’s Manual for The Economics of Money, Banking, and Financial Markets, Twelfth Edition 241
Chapter 22
ANSWERS TO QUESTIONS
1. Explain why the aggregate demand curve slopes downward and the short-run aggregate
supply curve slopes upward.
A rise in inflation causes monetary policymakers to raise the real interest rate. This reduces
planned expenditures and lowers the level of output necessary for goods market equilibrium.
2. Identify three factors that can shift the aggregate demand curve to the right and three different
factors that can shift the aggregate demand curve to the left.
The following changes shift the aggregate demand curve to the right: monetary policy easing,
3. “The appreciation of the dollar from 2012 to 2017 had a negative effect on aggregate demand
in the United States.” Is this statement true, false, or uncertain? Explain your answer.
The statement is correct. An appreciation of the U.S. dollar makes U.S. exports more
expensive for foreign consumers at the same time it makes imports into the U.S. cheaper. As
4. In many countries around the world, the population is aging and large segments of the
population are retiring or close to retirement. What effect would this have on a countries’
long-run aggregate supply curve? What will happen to income as a result?

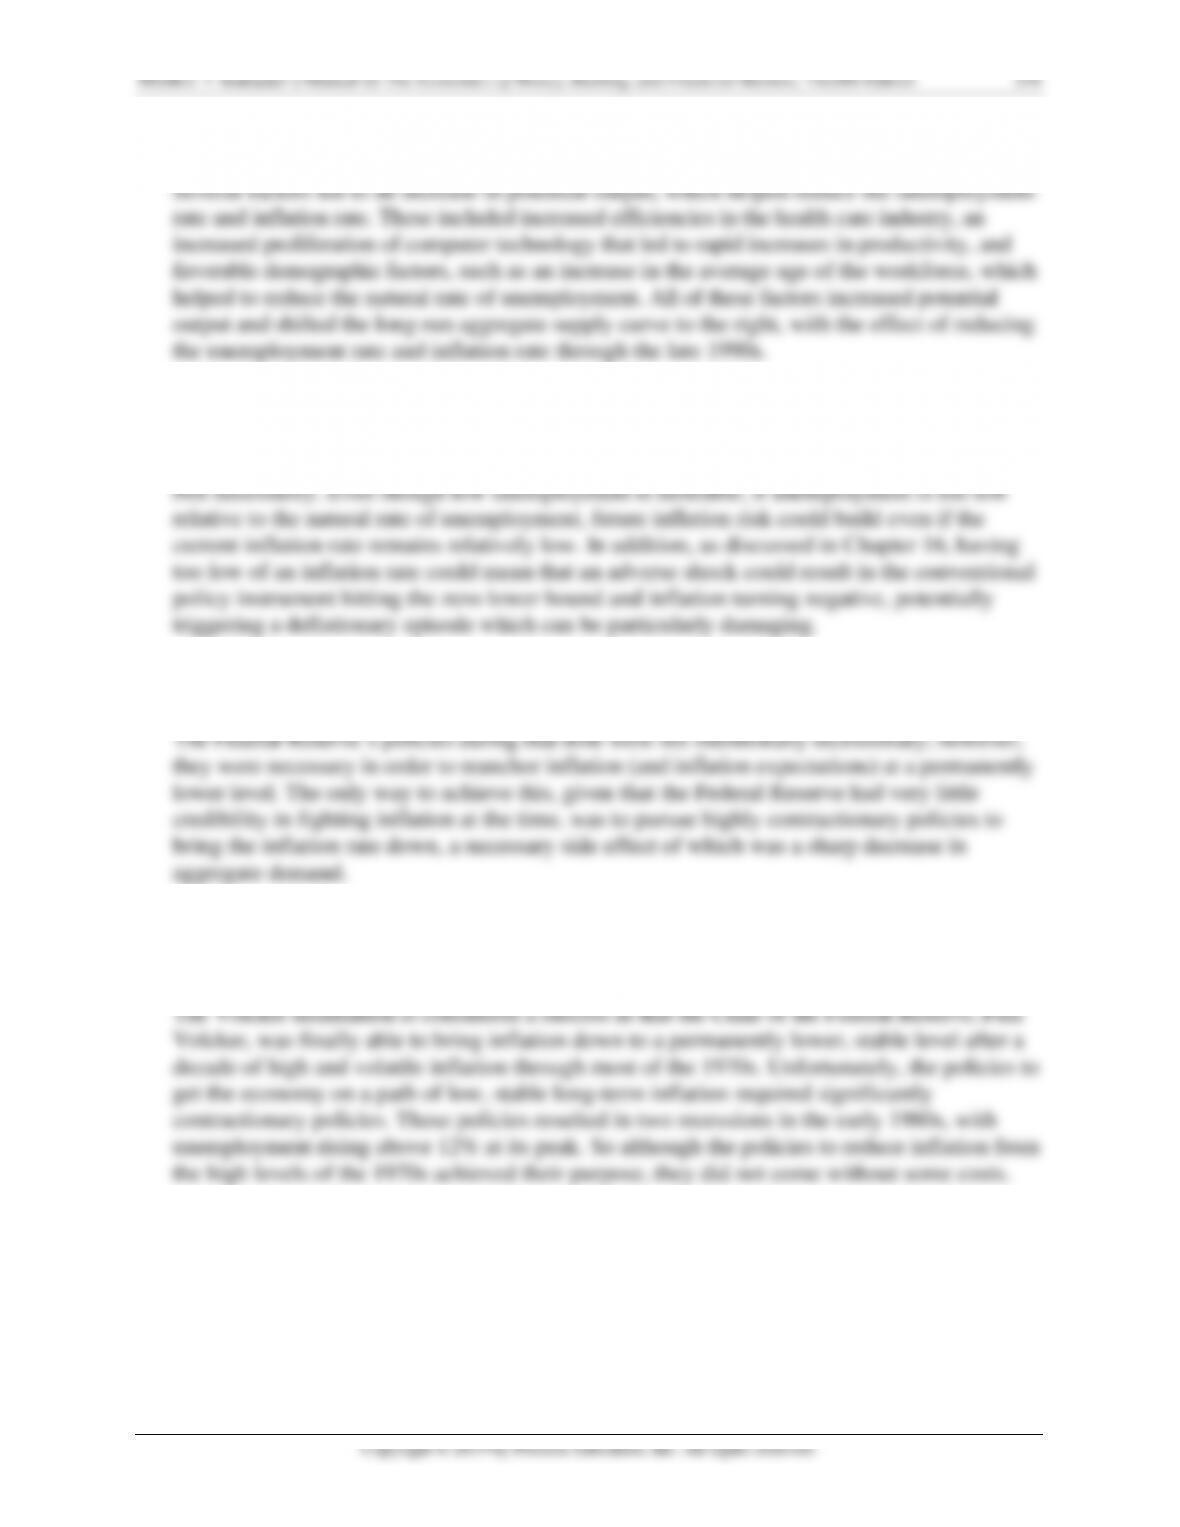
Mishkin • Instructor’s Manual for The Economics of Money, Banking, and Financial Markets, Twelfth Edition 246
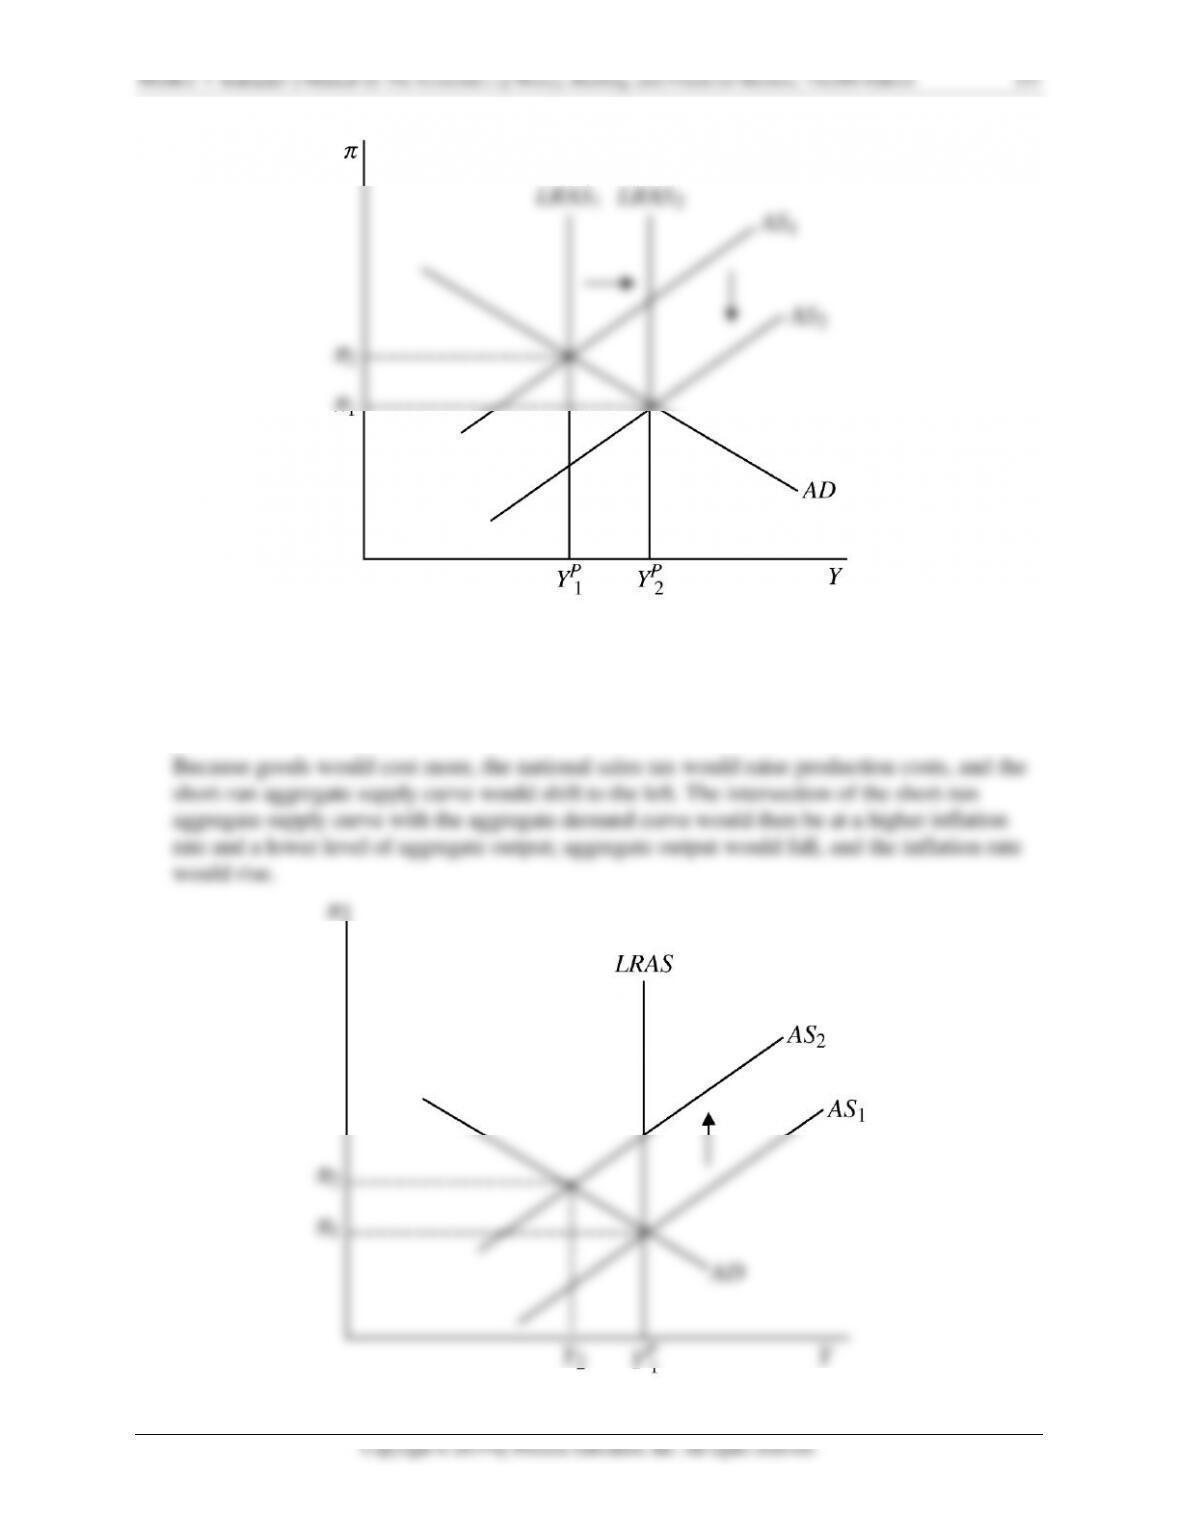
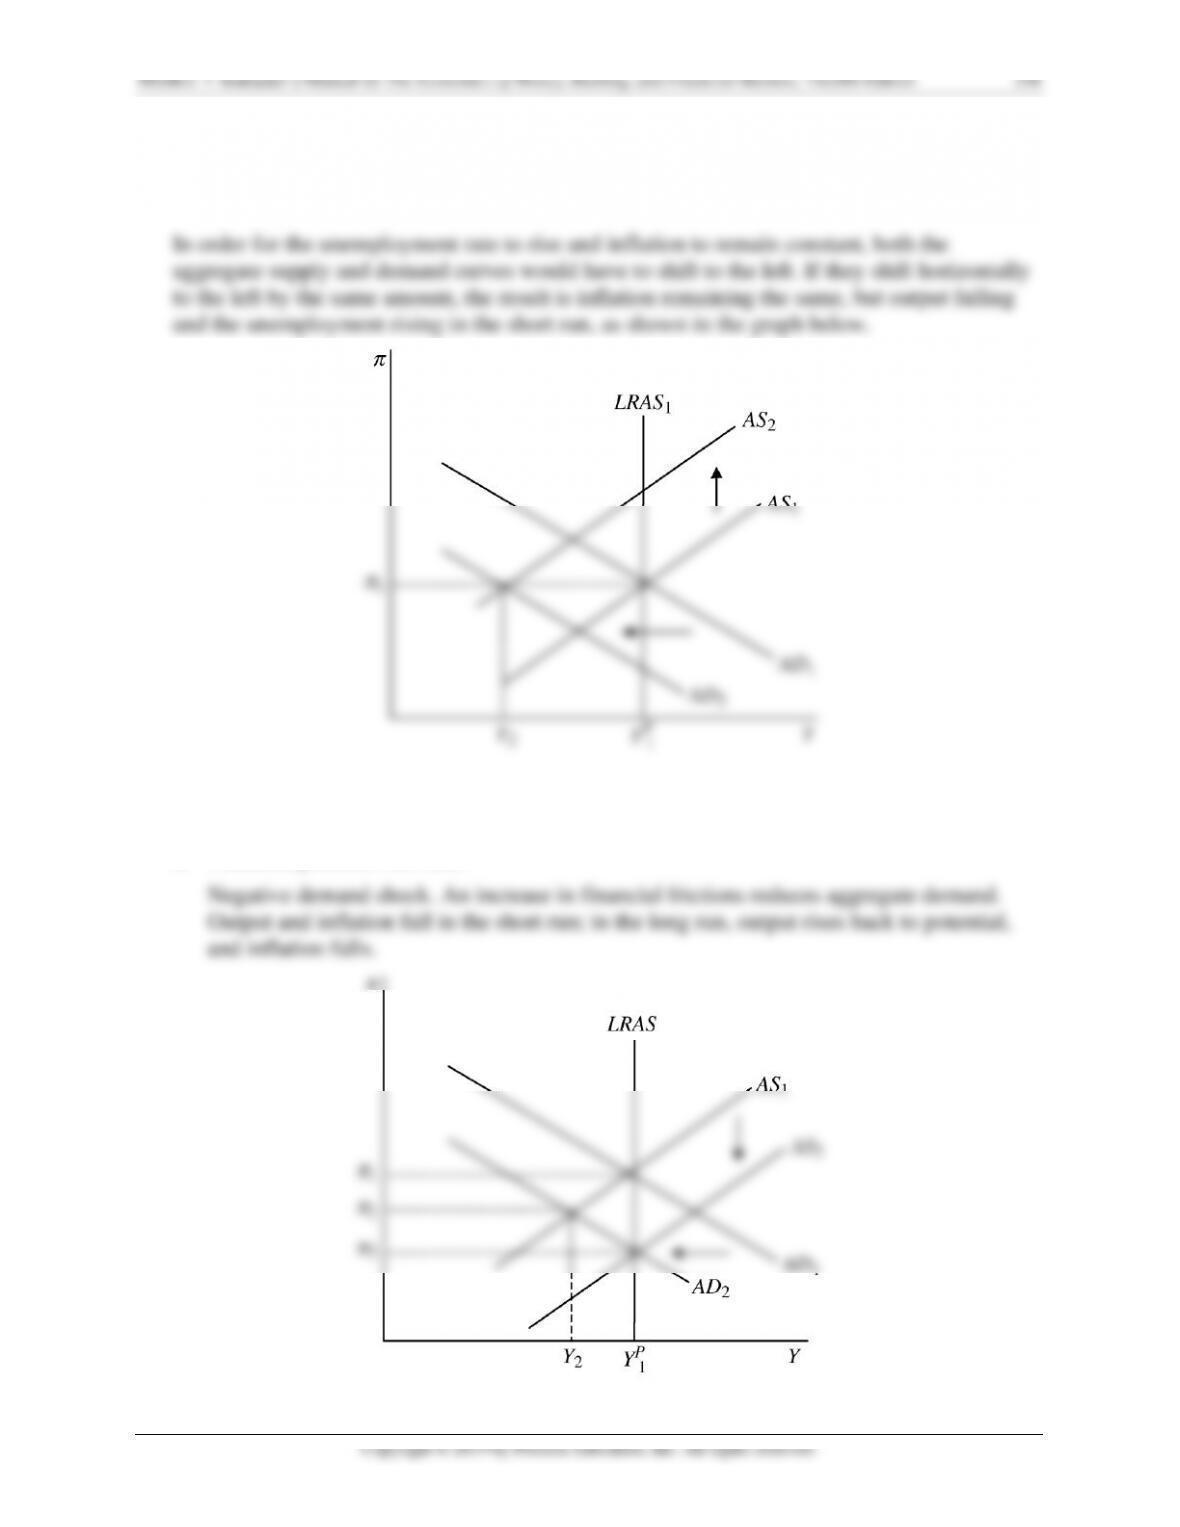
b. A permanent negative supply shock.
With a permanent negative supply shock, the long-run aggregate supply curve shifts to
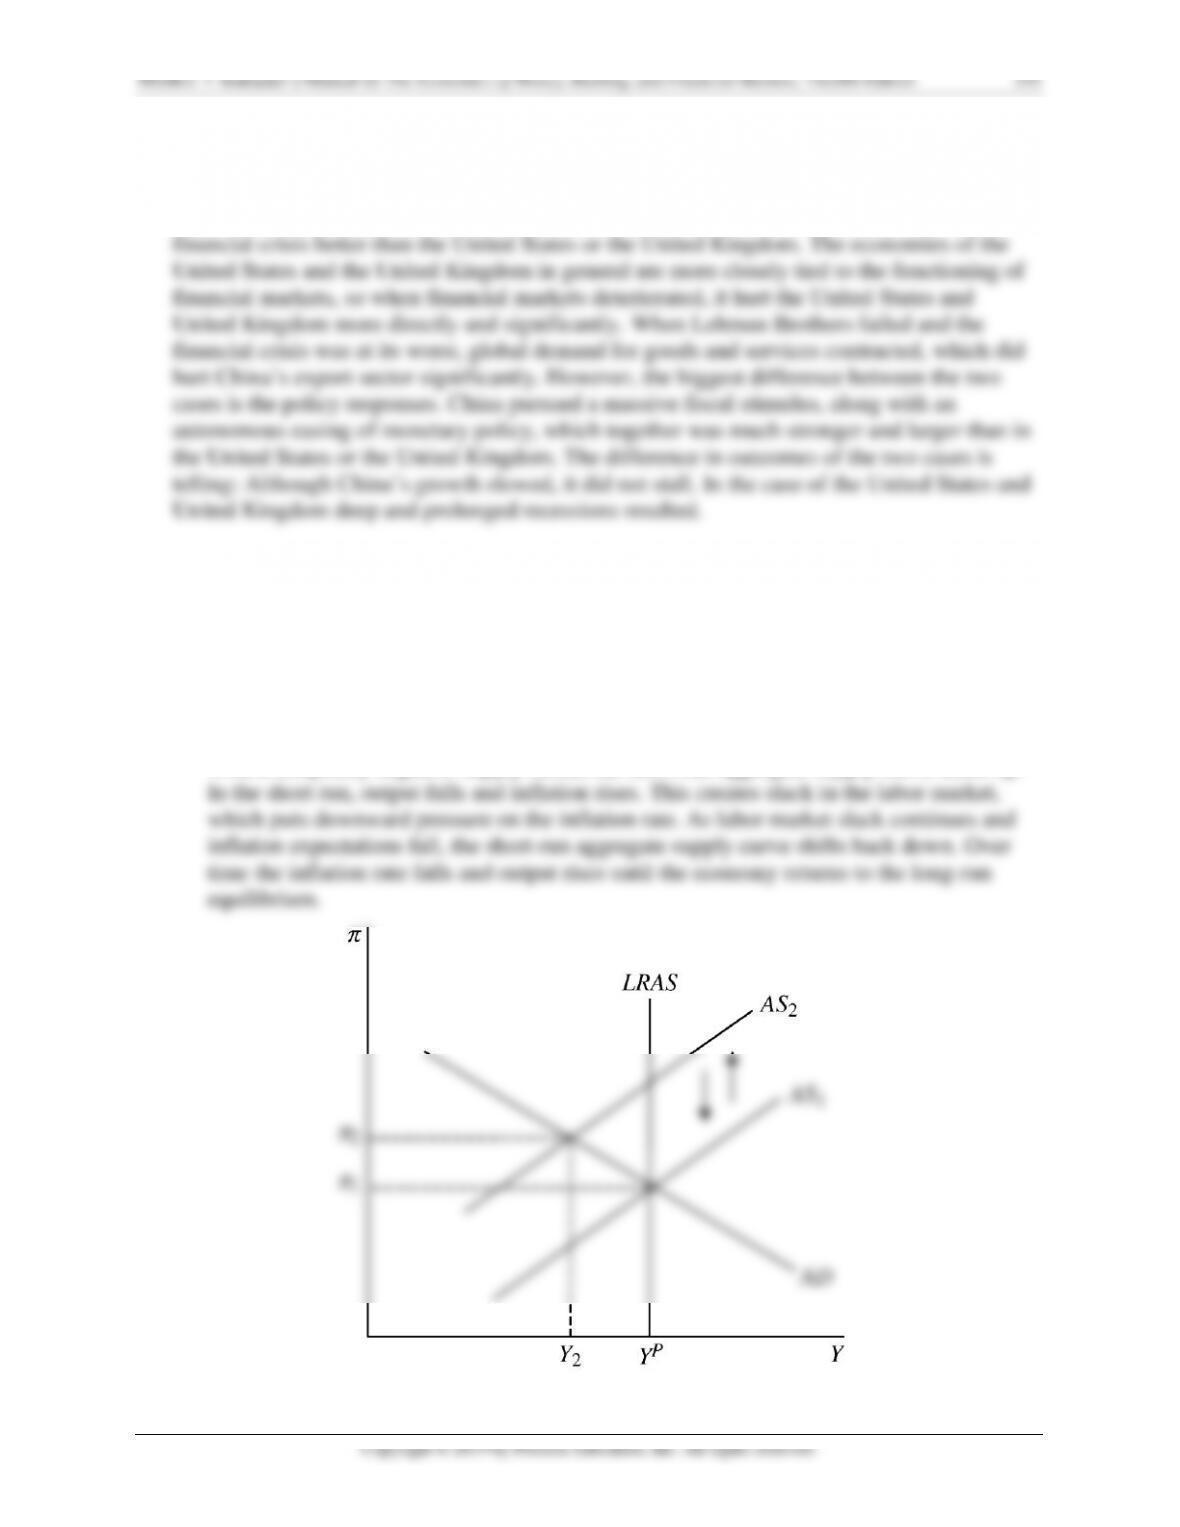
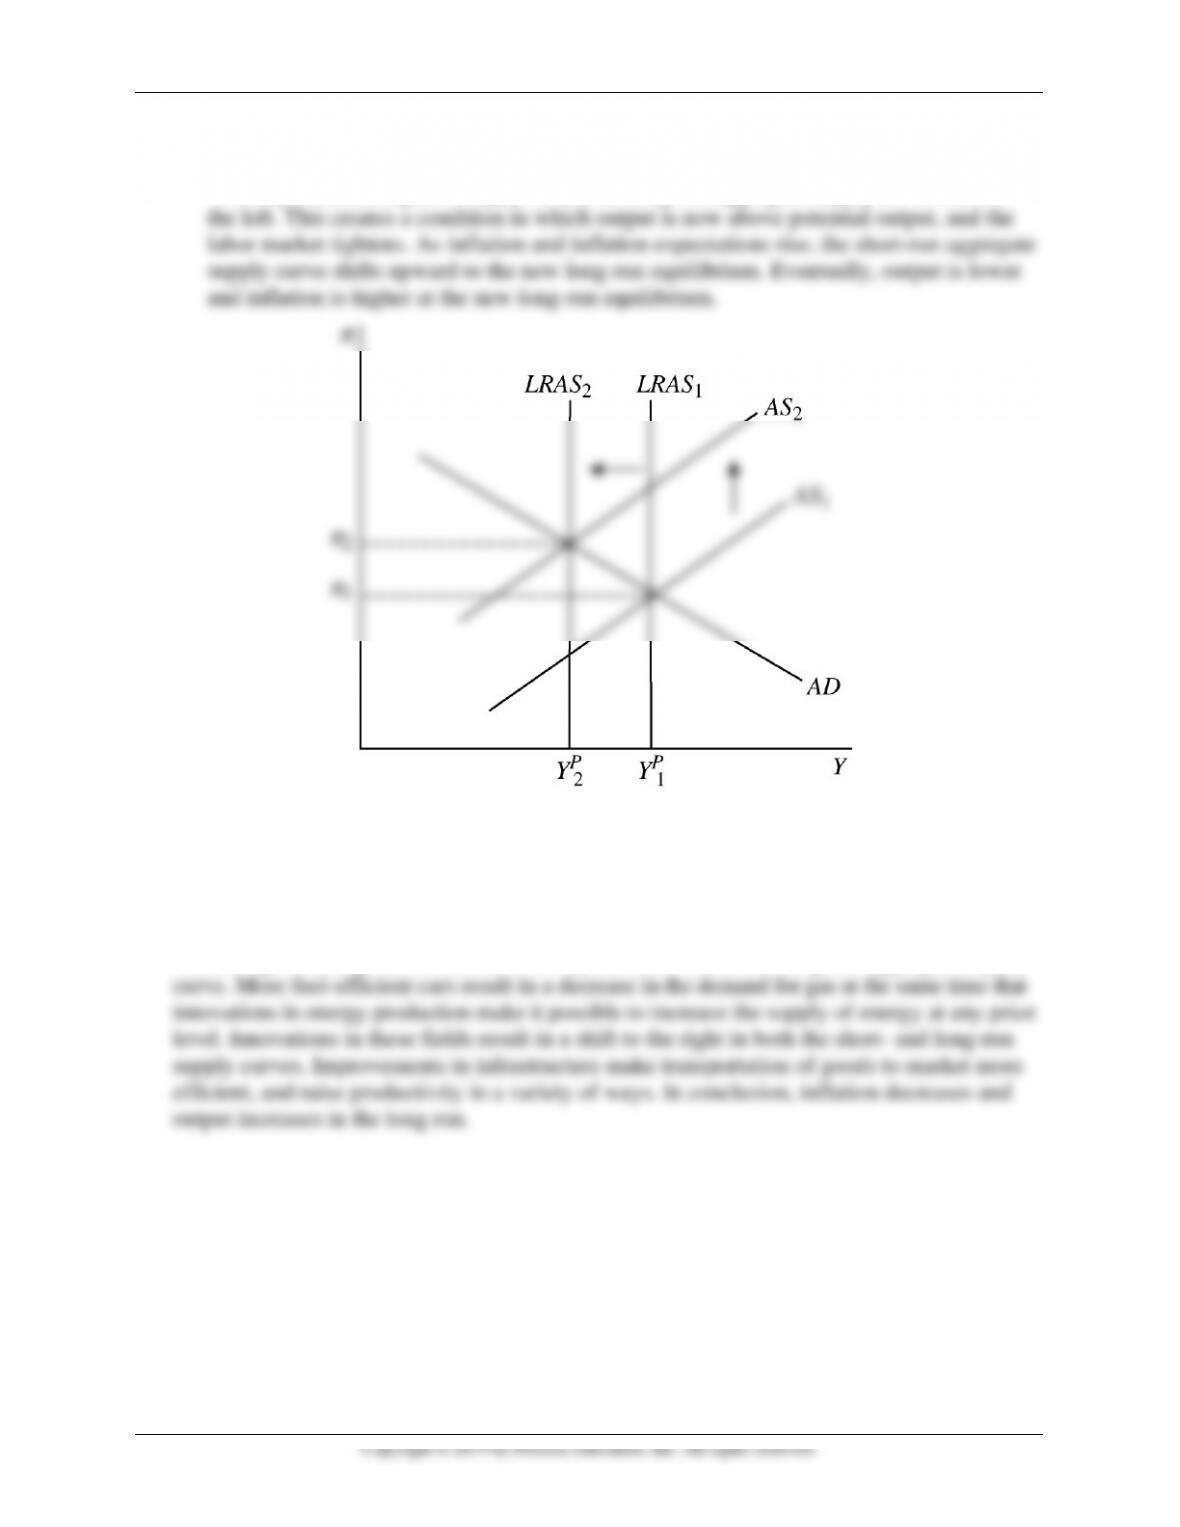
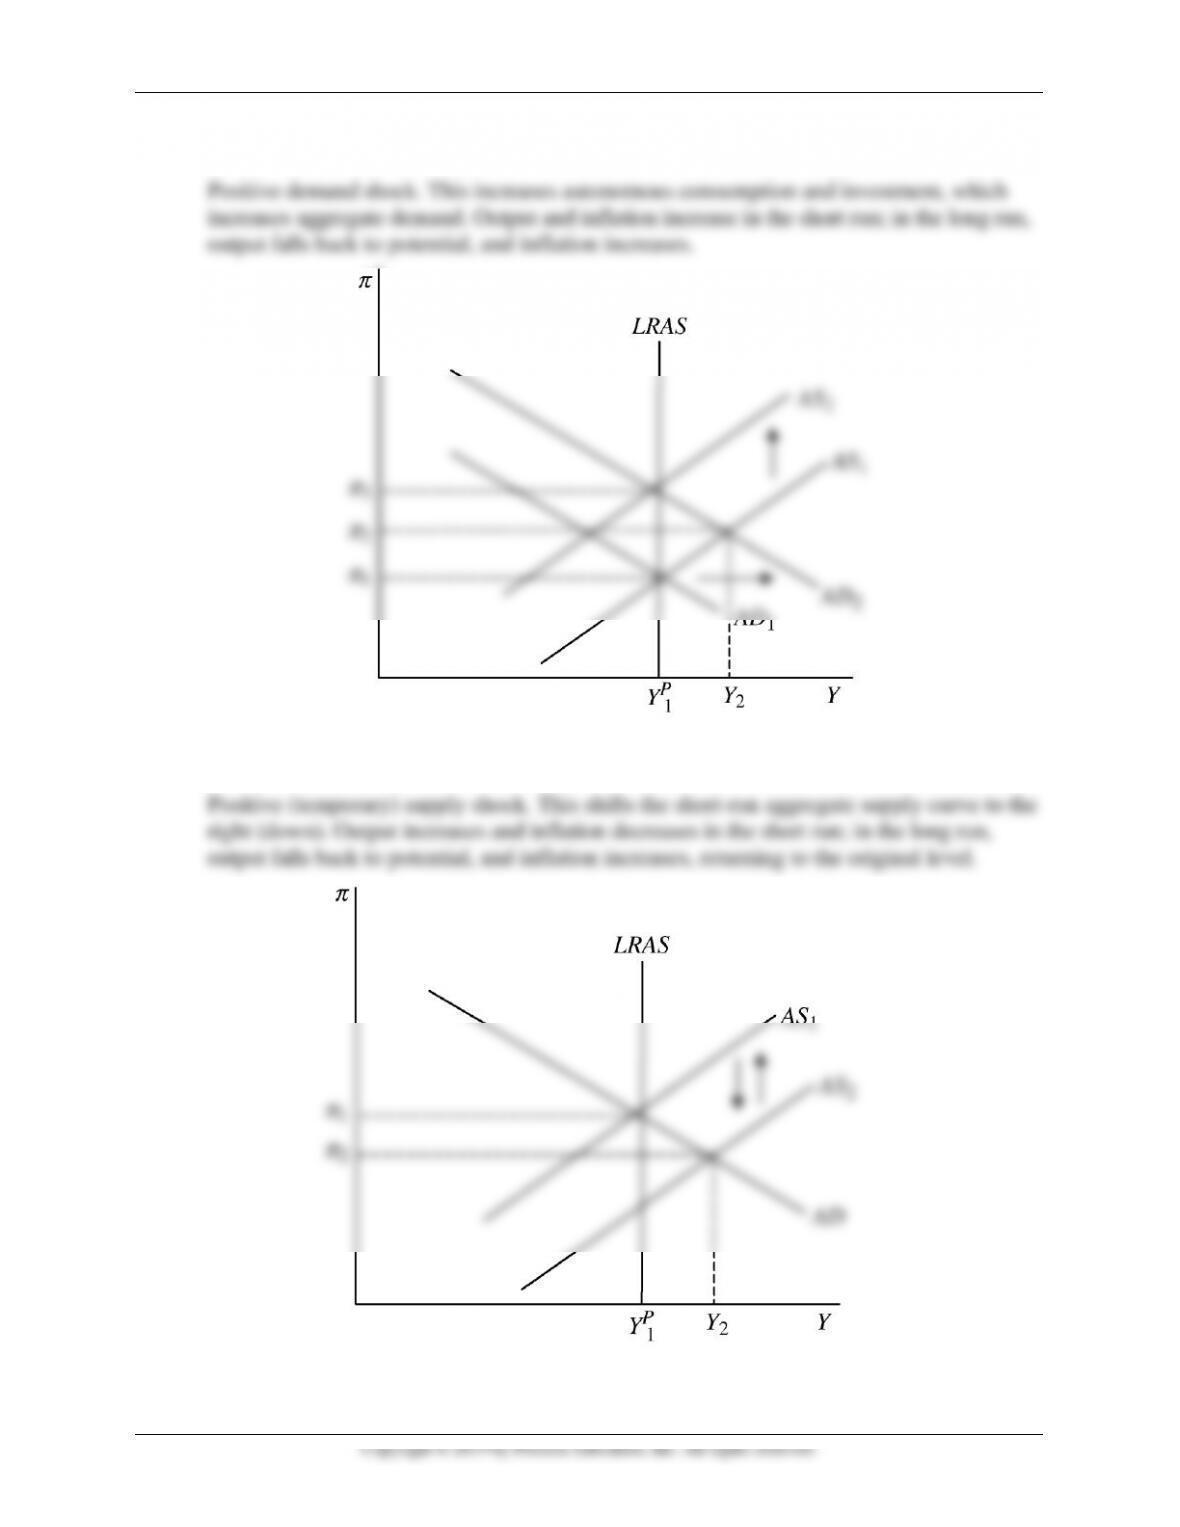
21. Suppose the President gets Congress to pass legislation that encourages investment in
research and the development of new technologies. Assuming this policy leads to a positive
productivity change for the U.S. economy, use aggregate demand and supply analysis to
predict the effects on inflation and output. Demonstrate these effects on a graph.
Technological change and infrastructure improvements affect the long-run aggregate supply
Mishkin • Instructor’s Manual for The Economics of Money, Banking, and Financial Markets, Twelfth Edition 249
b. Households and firms become more optimistic about the economy.
c. Favorable weather produces a record crop of wheat and corn in the Midwest.
Mishkin • Instructor’s Manual for The Economics of Money, Banking, and Financial Markets, Twelfth Edition 250
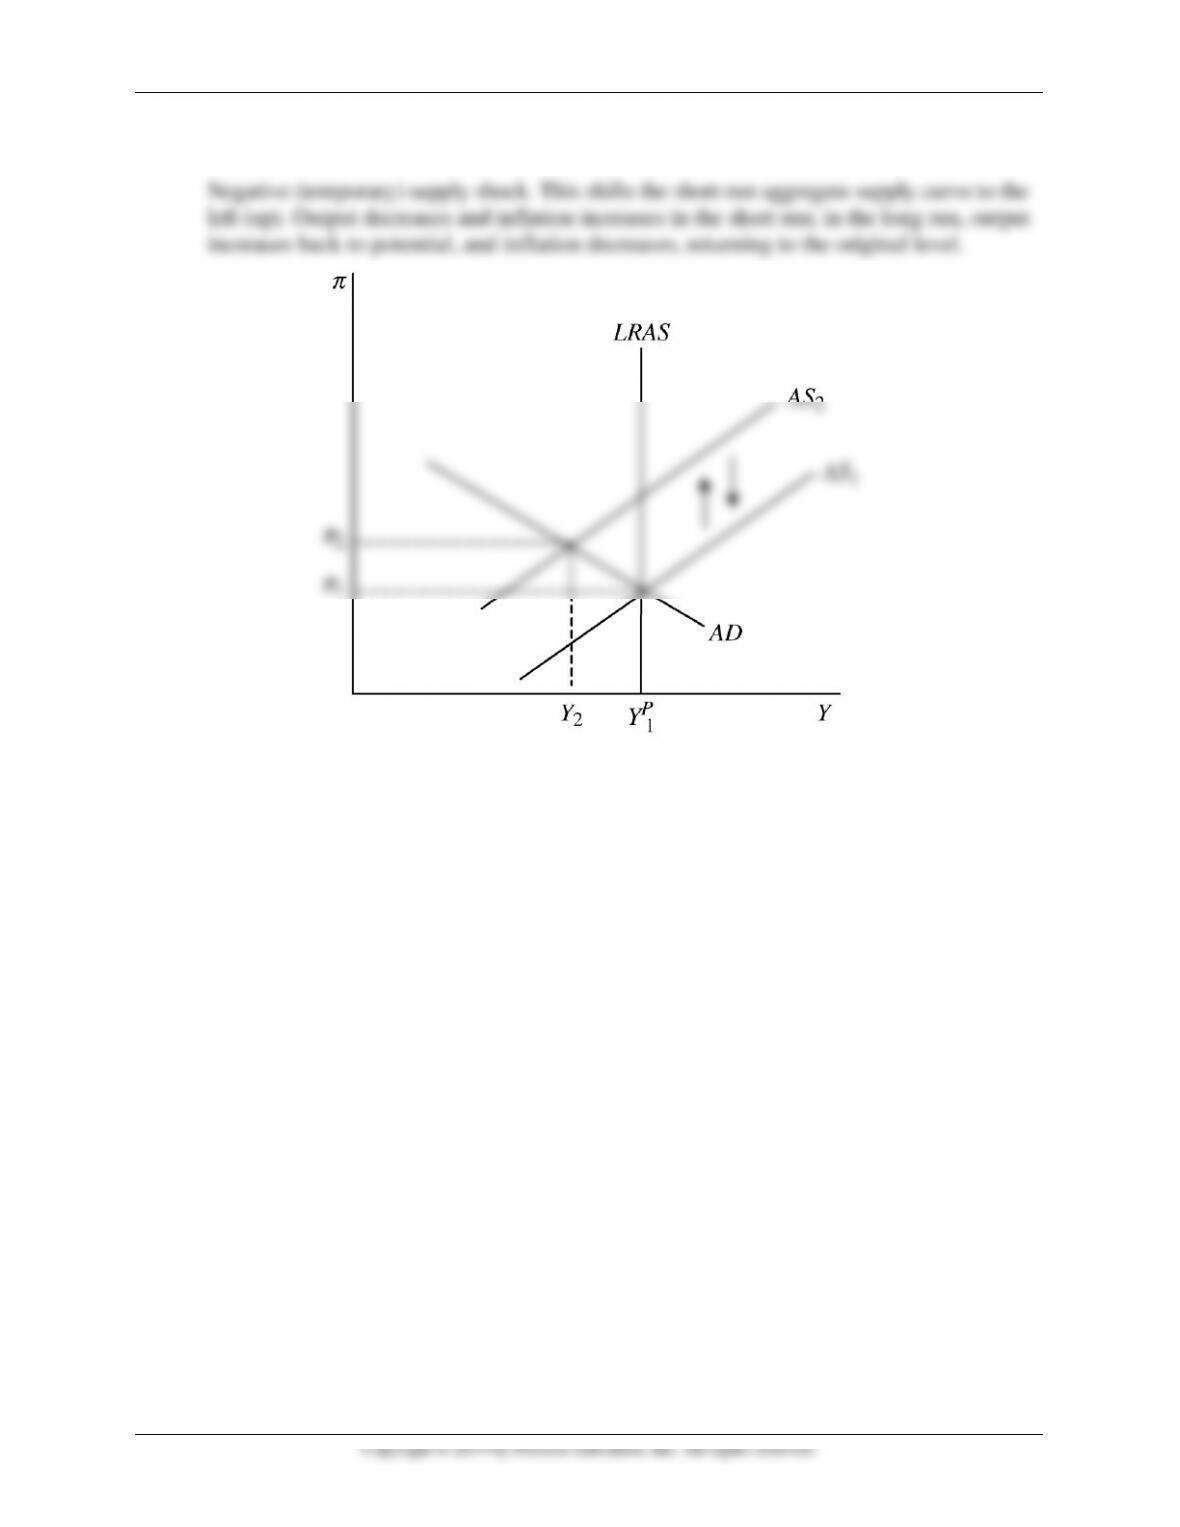
d. Auto workers go on strike for four months.